| num_items | reliability | n.stdts | var_theta | mean_SE_var |
|---|---|---|---|---|
| <20 | 0.55 | 910 | 2.23 | 1.01 |
| 20-29 | 0.81 | 1446 | 3.21 | 0.61 |
| 30-39 | 0.85 | 1832 | 4.11 | 0.60 |
| 40-49 | 0.89 | 203 | 3.46 | 0.39 |
| 50-59 | 0.92 | 71 | 5.76 | 0.46 |
| 60-69 | 0.91 | 32 | 5.85 | 0.53 |
| 70-79 | 0.71 | 19 | 2.36 | 0.68 |
| >=80 | -0.68 | 125 | 0.42 | 0.71 |
19 ROAR-Written Vocabulary Calibration
The calibration of the ROAR-Written Vocabulary items was done using a sample of 4,638 students in grades K-12. For each student, their responses from their first time taking ROAR-Written Vocabulary was used as learning and memory are known to affect the item difficulty estimates.
Student responses were dichotomously scored (0 = incorrect; 1 = correct) and calibrated using a Rasch model (Rasch 1993) with a fixed lower asymptote. To account for the four-choice response format, the guessing parameter was constrained to 0.25 for all items. The mirt (ver. 1.45.1) package (Chalmers 2025) in R was used for this calibration.
Of the 101 items administered, a total of 12 was dropped for the following reasons: (a) responses were too random, under-fitting the Rasch model’s expectation, (b) low item-EAP person estimate point-biserial correlation (i.e., not distinguishing higher/lower ability students well; r<.20), (c) replacing the old version with a new version, and (d) functioning differently for elementary vs. secondary students (i.e., more difficult the latter). See Table 21.1 in the Appendix for details on items that were excluded.
The exclusion of items based on the initial round of calibration resulted in retaining 89 items for this calibration.
19.1 Model Fit
The Rasch Model (Rasch 1993) was used to calibrate the ROAR-Written-Vocabulary response data. The mean of (ability) was fixed to 0 for model identification. This allows for the placement of both items and students on the same interval scale, facilitating interpretation of student performance relative to item difficulty on the Wright map.
Across all items, infit values ranged from 0.723 to 1.138. One item (equipment) exhibited a slight degree of overfit, with an Infit Mean Square (MSQ) of 0.723. While this value falls just below the conventional threshold of 0.75, it indicates that the observed response patterns are more deterministic than predicted by the Rasch model. However, because overfit does not introduce noise into the measurement—unlike underfit—it does not degrade the quality of the measure. Consequently, the item was retained to preserve content coverage.
19.1.1 Reliability
The ROAR-Written Vocabulary assessment demonstrated strong internal consistency, with a Person Separation Reliability of 0.82 and an EAP Reliability of 0.85. These values indicate that the instrument effectively differentiates students along the intended construct hierarchy and possesses sufficient spread to distinguish between multiple levels of vocabulary ability (Wright and Masters 1982).
While these coefficients serve as the IRT-based equivalents to Cronbach’s alpha, they provide a more rigorous estimate of precision. Unlike alpha, which assumes a uniform measurement error across all students, these indices utilize the conditional standard errors associated with each student’s specific logit position (Fisher 1992). This approach is particularly valuable for this assessment, as it incorporates the increased measurement uncertainty at the lower end of the distribution inherent in a multiple-choice format with a fixed guessing parameter.
Reliability and Test Length Projections To examine how measurement precision scales with assessment length, we calculated empirical reliability for subgroups of students based on the number of items attempted (Table 19.1). As expected, reliability increases as students engage with a larger proportion of the item bank, peaking at 0.92 for students completing 50–59 items. This trend reflects the expected gain in measurement precision from increased assessment length. However, reliability begins to decline in the upper brackets of items attempted and reaches a negative value (–0.68) for the group attempting 80 or more items. This negative result is a mathematical artifact of the specific student profiles in that subgroup: these students exhibit a severe restriction of range (indicated by the very low theta/ability variance of 0.42) paired with high measurement noise (indicated by the high mean measurement error variance of 0.71). Essentially, because this small group consists of very low-performing students with inconsistent response patterns, the estimated measurement error exceeds the observed variance of their scores, rendering the reliability coefficient uninterpretable for this specific subset.
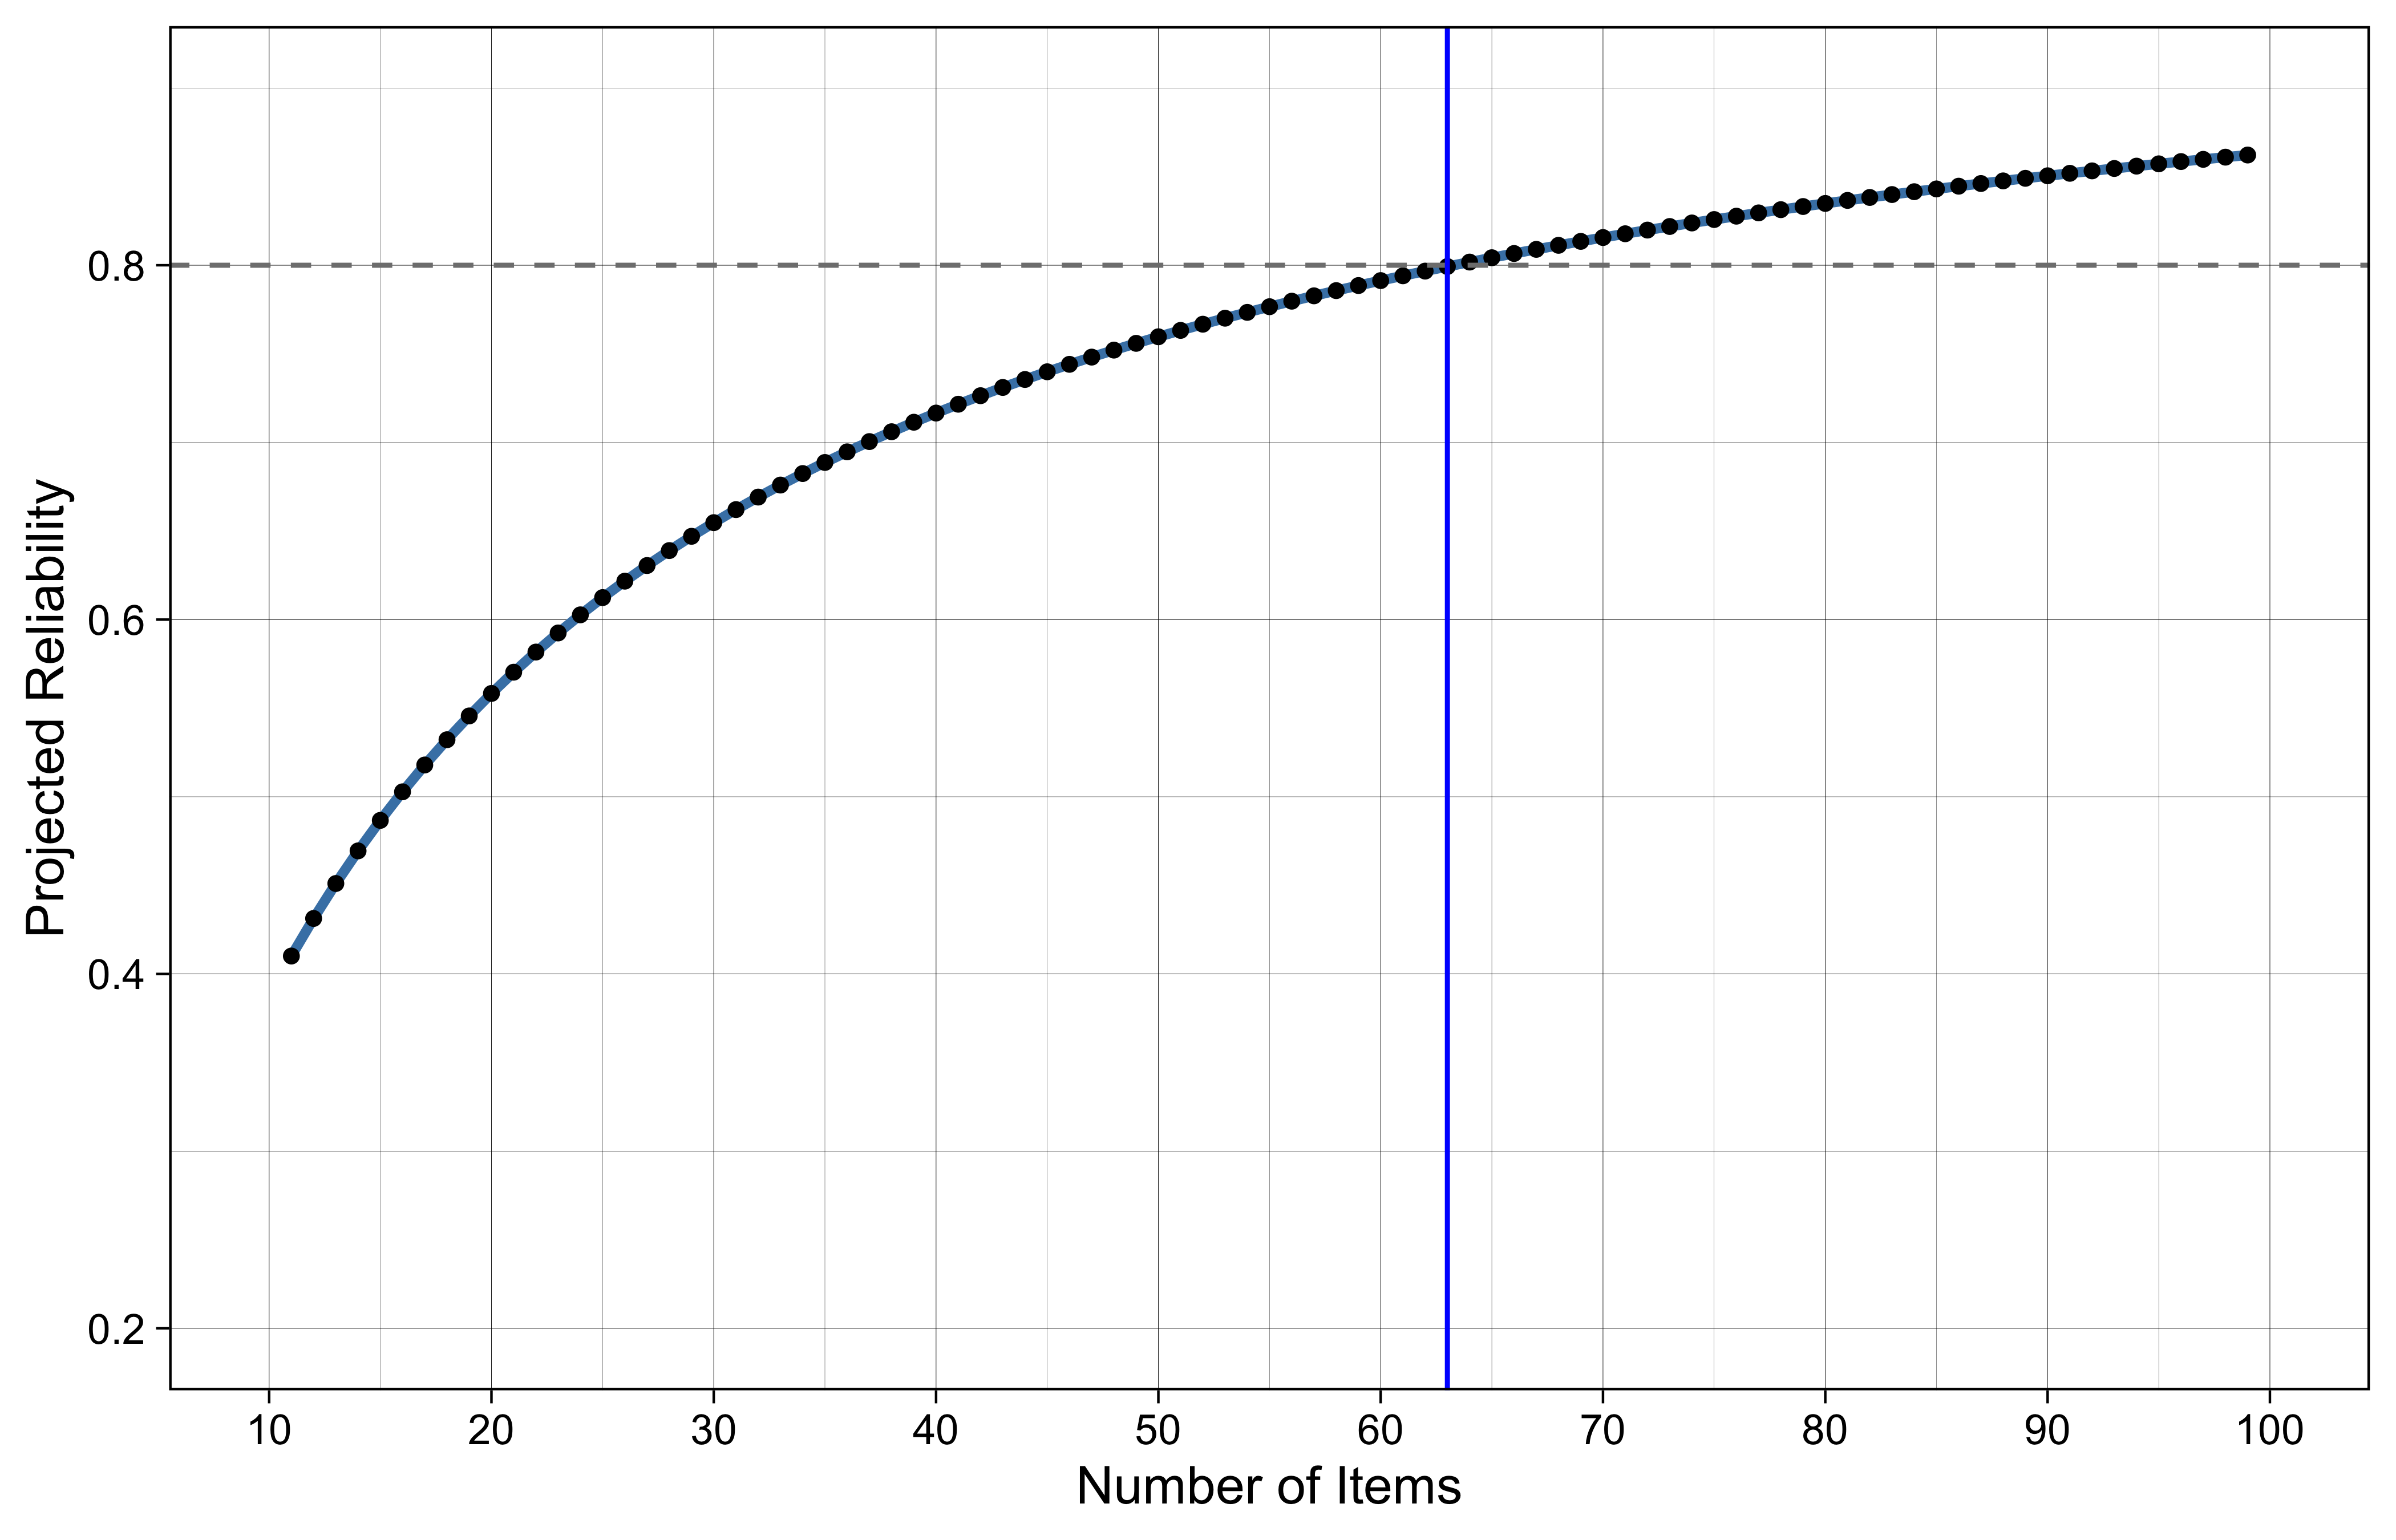
To guide future test design, we applied the Spearman-Brown prophecy formula to project the relationship between test length and reliability (Figure 19.1). Based on the current item parameters, a fixed-form assessment would require approximately 63 items to maintain a reliability of 0.80. However, because computer adaptive testing (CAT) strategically selects items that maximize information for each student’s specific ability level, we anticipate achieving this 0.80 reliability threshold with significantly fewer items than the fixed-form projection suggests.
19.2 Wright Map
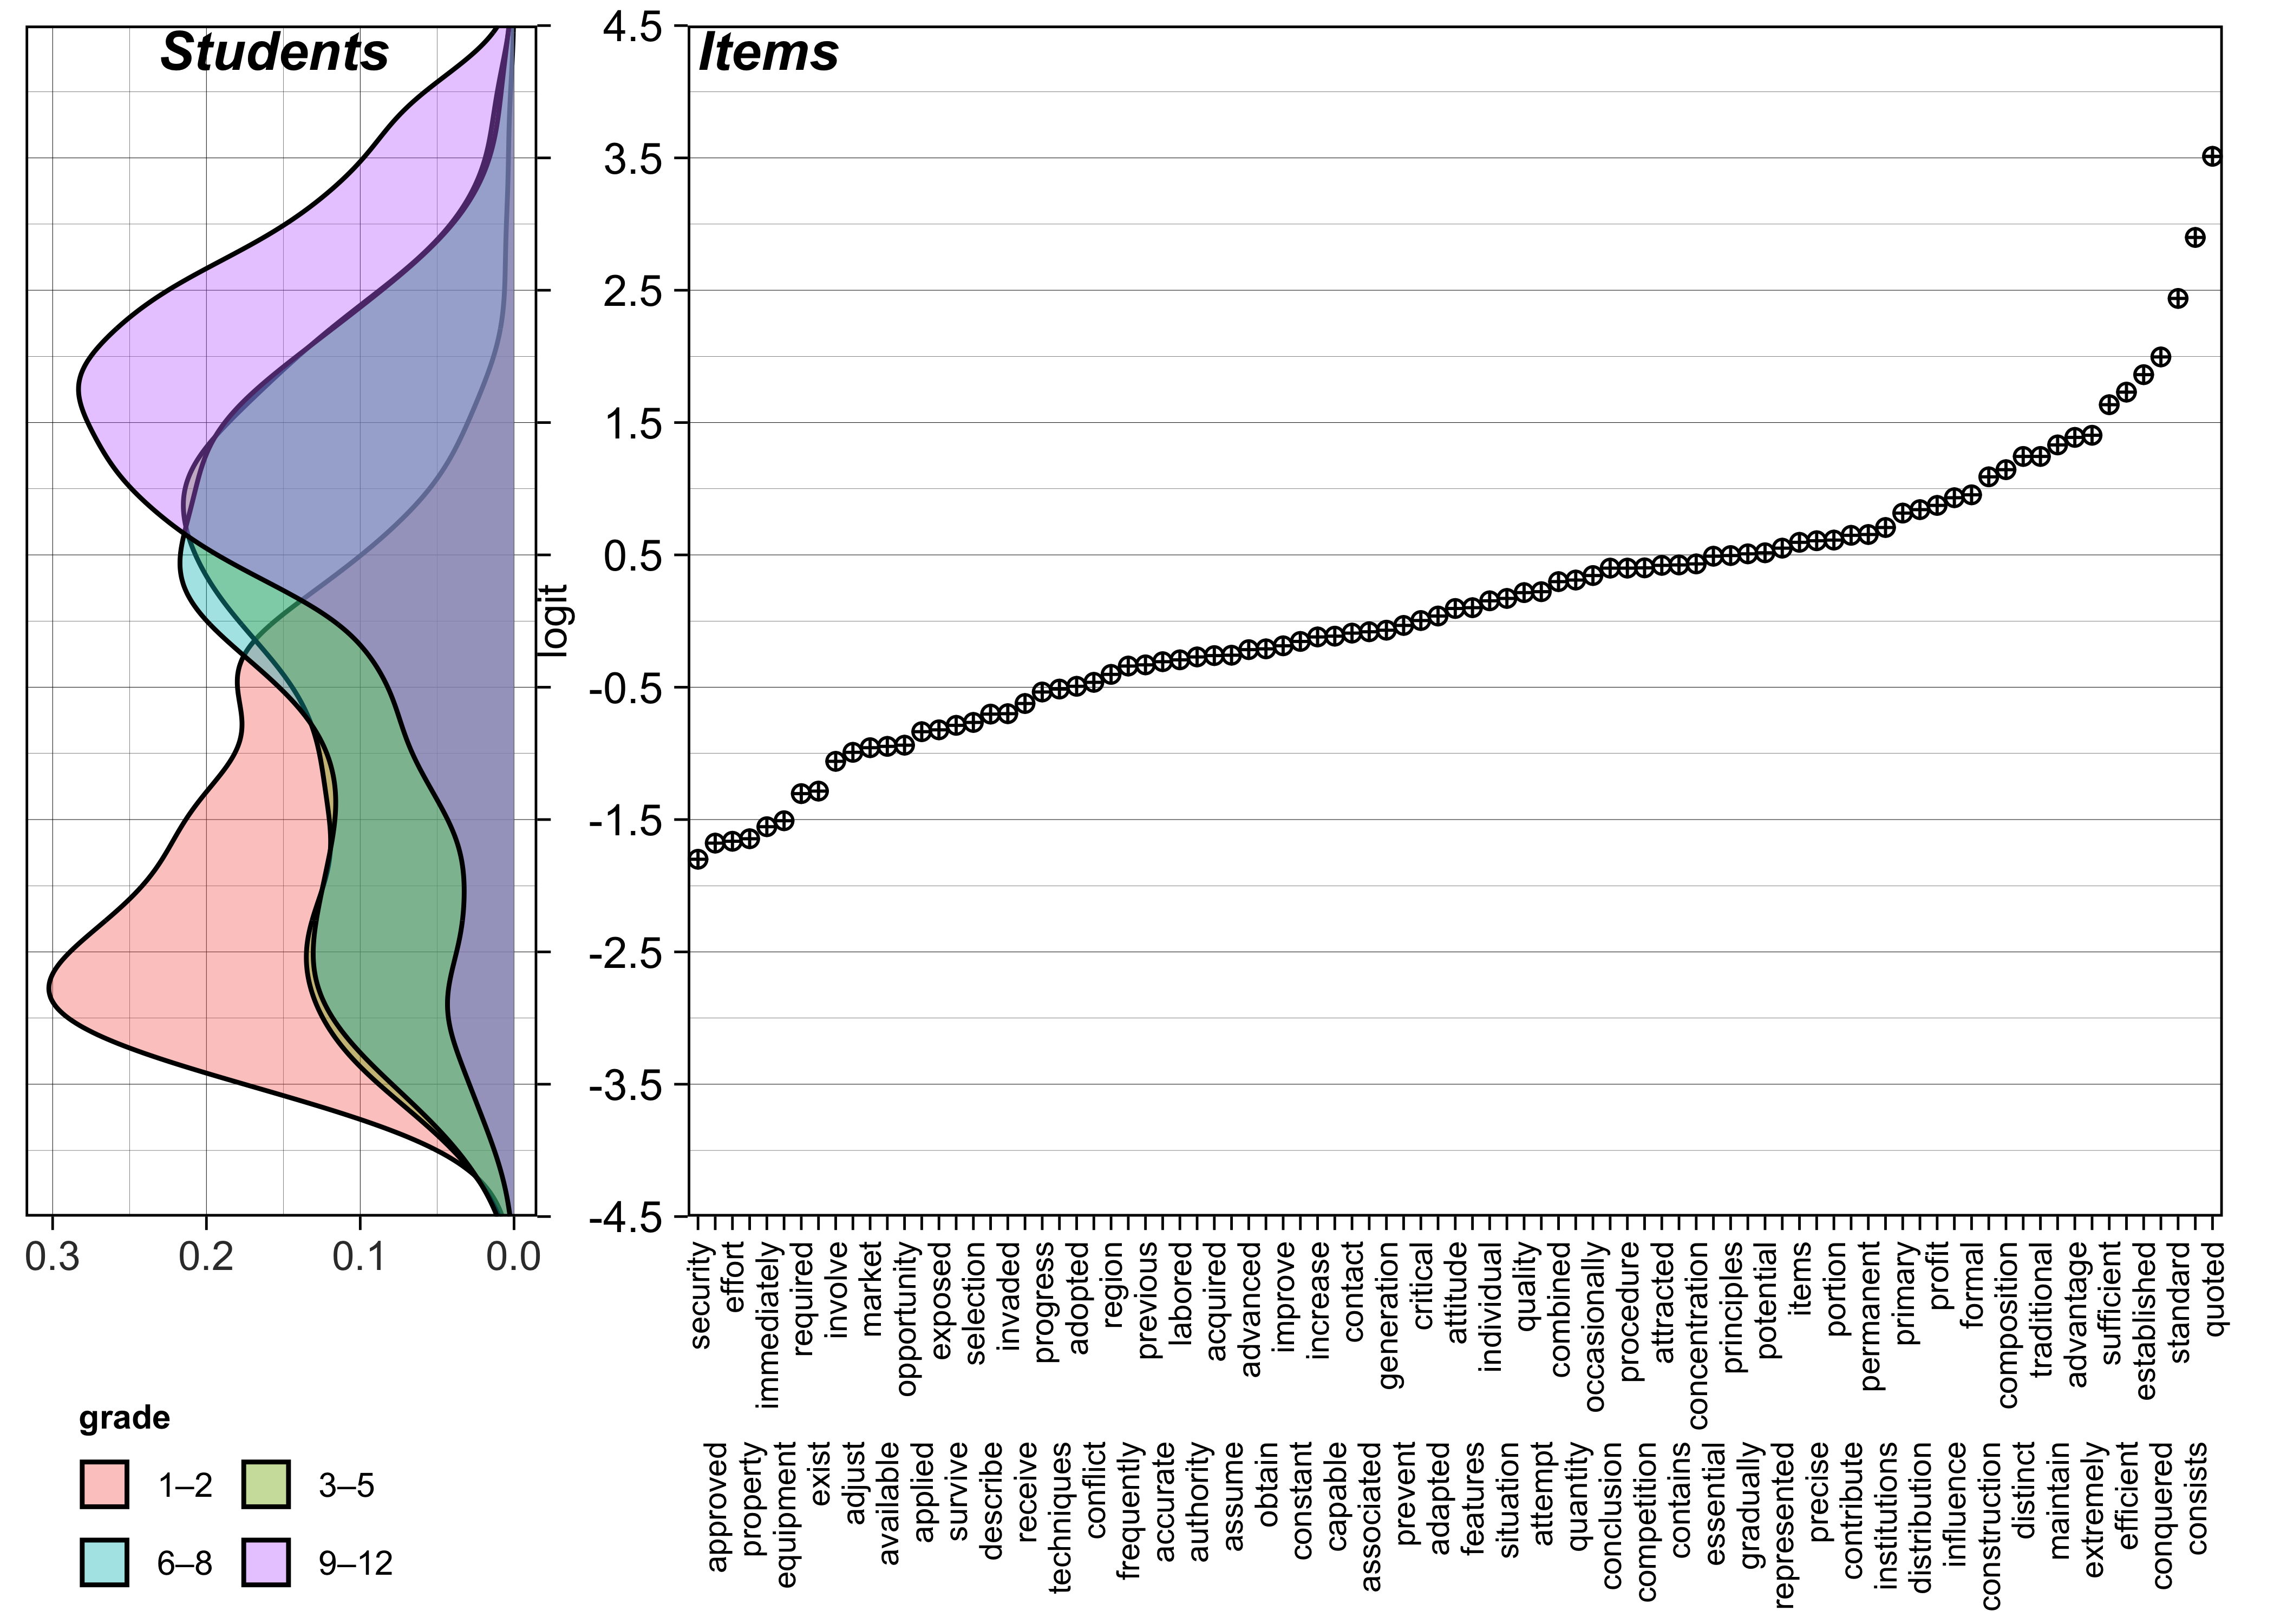
The Wright Map (Figure 19.3) indicates that the ROAR-Written-Vocabulary assessment effectively targets a broad range of the latent construct. Item difficulties (right panel) range from approximately -1.8 to +3.5 logits (\(M = 0.13, SD = 1.01\)), aligning well with a student ability distribution centered near zero (\(M = 0.01, SD = 1.95\)). While the 89-item set provides excellent coverage for average and high-ability students, a “floor effect” is visible for the lowest-performing students—particularly in the Grade 1–2 and 3–5 cohorts. In these groups, student density extends down to -4.5 logits, while the easiest items (e.g., security, approved, effort) are located at roughly -1.8 logits. This gap suggests that the assessment may lack the measurement precision required for very low-ability students.
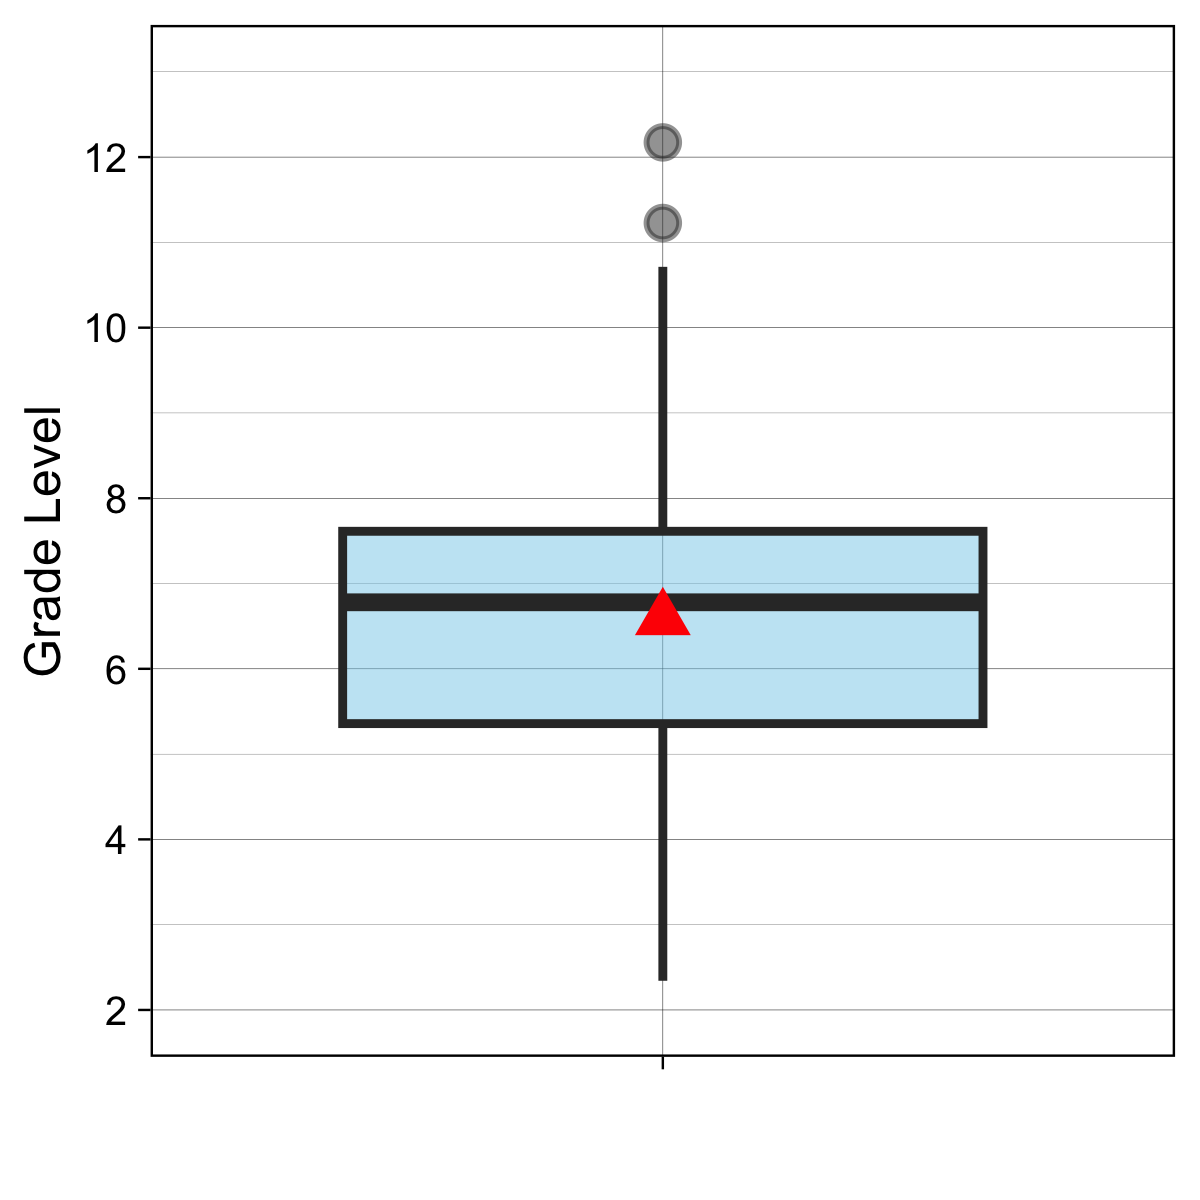
This psychometric floor is further compounded by the items’ linguistic complexity. Readability analysis of CVA sentence prompts reveals a mean Flesch-Kincaid Grade Level of 6.53 (SD = 2.1), with even the simplest items requiring nearly a second-grade reading level (Min = 1.87) while the most complex sentences are above a twelveth grade level (Max = 12.17, inter-quatile range = 5.23 - 7.61; see Figure 19.2). For the substantial number of Grade 1–2 students and older students with reading challenge positioned below -2.0 logits, these readability values may represent a “decoding hurdle.” Consequently, incorrect responses in this range may reflect a failure to decode the item text rather than a lack of core academic vocabulary knowledge.
For students not yet reading at a second-grade level, the linguistic demands of the written item format may obscure their true vocabulary knowledge. To address this limitation, ROAR-Written Vocabulary results for these students should be interpreted alongside complementary measures of oral vocabulary knowledge, such as receptive vocabulary assessments that do not require decoding (e.g., [@dunn2019]). Oral vocabulary measures can provide a more accurate estimate of core word knowledge for students whose reading ability has not yet reached the threshold required to engage reliably with written item formats. Additionally, ROAR platform measures that assess related language constructs—including ROAR-Morphology and ROAR-Inference—may offer useful supplementary information about students’ broader language and literacy profiles. An oral administration mode for ROAR-Written Vocabulary is currently under development and will extend the assessment’s utility to emergent readers and students with decoding difficulties, enabling more equitable measurement of core vocabulary knowledge across the full ability range.
CVA levels are grade-referenced word tiers that use U-score frequency ranges as an entry criterion but incorporate additional corpus-based filters including age of acquisition, dispersion, and developmental trajectory to determine final level membership (see Table Table 18.1 for an illustration of this process at Level 4). As a result, the current item pool is concentrated within Zones 3–4, with minimal representation below this range. Variation in item difficulty within this span reflects the combined influence of multiple lexical properties (e.g., U-function frequency, age of acquisition, morphological family size, concreteness, and dispersion) rather than CVA level membership alone.
Finally, when interpreting the Wright Map, it is important to note that the inclusion of a fixed pseudo-guessing parameter (c = 0.25) modifies the standard Rasch interpretation of person-item alignment. Unlike a standard Rasch model where a student matched to an item difficulty has a 50% probability of success, the fixed lower asymptote in this model means that a student at the same logit location as an item has a 62.5% theoretical probability of answering correctly. Consequently, the alignment shown in Figure 19.3 reflects a higher success threshold than is typical in Rasch/1PL models.
The ROAR-Written-Vocabulary items appear to follow a logical progression of complexity.
Easy Items: Words such as security, approved, and property occupy the bottom of the map (approximately -1.8 logits). Because the model incorporates a fixed pseudo-guessing parameter of 0.25, the success probabilities reflect both student ability and the multiple-choice format. For the Grade 1–2 cohort (\(\text{M}_{\theta} = -1.65\)), the average student has a 65% probability of correctly answering the easiest items. In contrast, the Grade 3–5 and 6–8 cohorts (combined \({M}_{\theta} \approx -0.24\)) show a much higher mastery level, with average students having an 87% probability of success on these items. Finally, the Grade 9–12 cohort (\({M}_{\theta} = 1.16\)) exhibits near-ceiling performance on the easier items, with the average students having 96% probability of success.
Moderate Items: The WrightMap reveals a dense cluster of items—a ‘difficulty plateau’—situated between approximately -0.5 and +0.5 logits. This region includes terms such as accurate, authority, and improve, which serve as critical discriminators within the sample. Notably, the person-side distribution for both the upper elementary (Grades 3–5) and middle school (Grades 6–8) cohorts exhibits a nearly identical bimodal profile. This distributional stability suggests that across both grade bands, the population is characterized by two distinct latent subgroups: an ‘emerging’ group (centered near -2.4 logits) and a ‘higher-mastery’ group (centered near 0.6 logits).
From a measurement perspective, the mid-range items are optimally targeted to differentiate between these two modes. Students in the higher-mastery subgroup demonstrate a high conditional probability of success on these items, whereas the emerging subgroup falls significantly below the difficulty threshold of the academic tier. The persistence of this bimodal pattern across different cross-sectional cohorts indicates a consistent ‘lexical gap’—where a substantial portion of students in both elementary and middle schools are still developing the mid-range academic vocabulary necessary to fully access the academic text.
Furthermore, the moderate-difficulty items could perform a critical diagnostic function for the high-school cohort. While the majority of the Grade 9–12 students exhibit mastery well above this level, the items in this range are essential for accurately capturing the lower tail of the high school distribution. For high school students performing significantly below their grade-level peers, the moderate-difficulty items provide the necessary measurement range to ensure their ability estimates are based on active item-person interactions rather than extrapolation. This confirms the instrument’s utility in capturing the full spectrum of high school performance, including those students requiring the greatest instructional support.
Difficult Items: Words such as quoted, standard, and consists are found at the top of the scale (+2.5 to +3.5 logits). These items are highly challenging and serve to differentiate the top-performing students in the upper elementary through high school from their peers. Without these difficult items, the highest-performing students would likely achieve perfect scores, creating a ‘ceiling effect’ that would make it impossible to distinguish between their varying levels of vocabulary knowledge.
While these results offer valuable preliminary insights into vocabulary acquisition across grades 1–12, they must be viewed through the lens of a convenience sample used in this study. The lack of a representative normative sample means that the mean ability estimates and the observed ‘growth plateau’ in grades 3–8 may vary in different educational settings. Future work should prioritize a normative sampling design to establish more robust benchmarks and to examine the stability of the item-person map across diverse student populations in the United States and beyond.
Ability Distribution
Table 19.2 and Table 19.3 provide summary statistics for the student ability estimates.
| Variable | Overall N = 4,638 |
Elementary N = 2,141 |
Secondary N = 2,497 |
|---|---|---|---|
| Ability (theta) | |||
| Mean (SD) | 0.01 (1.95) | -0.51 (1.88) | 0.46 (1.90) |
| [Min, Max] | [-4.46, 4.34] | [-4.42, 4.16] | [-4.46, 4.34] |
| Variable | Overall N = 4,638 |
1–2 N = 386 |
3–5 N = 1,755 |
6–8 N = 1,257 |
9–12 N = 1,240 |
|---|---|---|---|---|---|
| Ability (theta) | |||||
| Mean (SD) | 0.01 (1.95) | -1.65 (1.40) | -0.25 (1.88) | -0.23 (1.84) | 1.16 (1.70) |
| [Min, Max] | [-4.46, 4.34] | [-4.42, 3.74] | [-4.26, 4.16] | [-4.46, 4.34] | [-4.35, 4.33] |
Item Difficulty Distribution
Table 19.4 summarizes the estimated item difficulty for the 89 ROAR-Written Vocabulary items.
| N | Mean | SD | Min | Max |
|---|---|---|---|---|
| 89 | 0.133 | 1.006 | -1.8 | 3.512 |
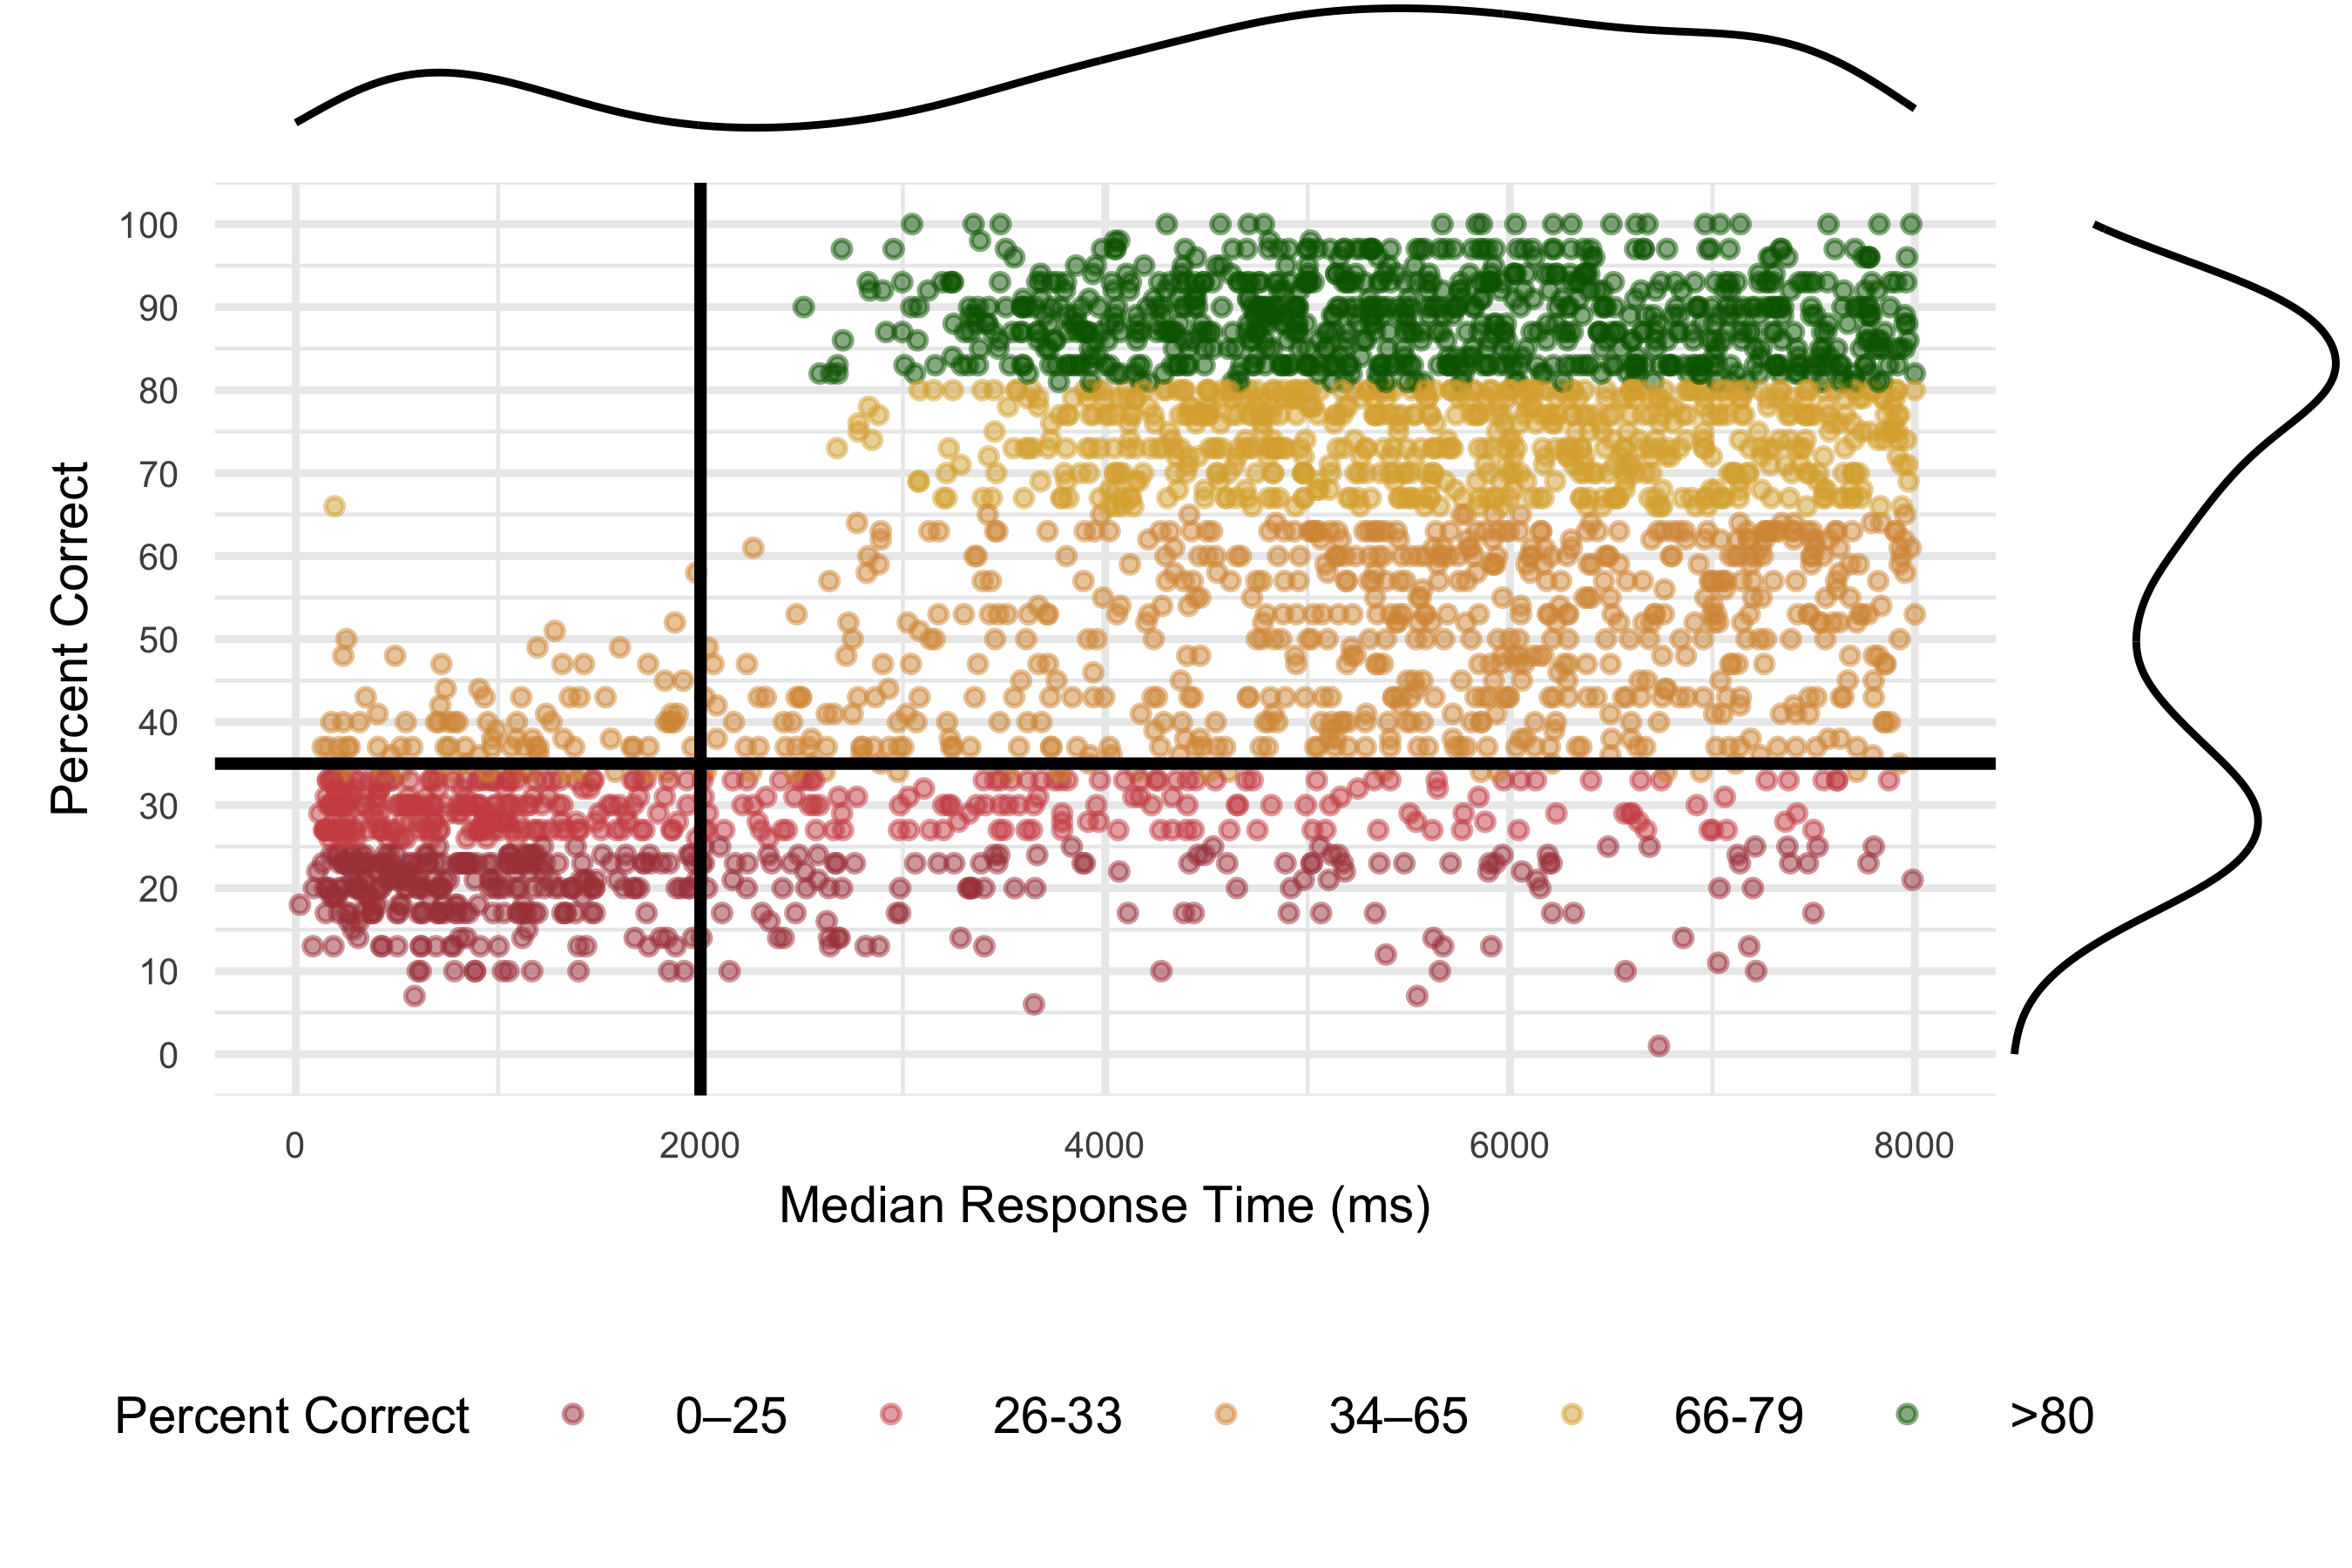
Detecting disengaged students The median response time (RT) versus proportion of items answered correctly for each participant is shown in Figure 19.4. The bottom left quadrant of students, indicated by mostly red with some yellow dots, are those spending less than 2000ms on average per item) with low overall accuracy (getting less than 50% of items correct) on ROAR-Written Vocabulary. These students are flagged as responding too fast in ROAR-Syntax score reports.