| Characteristic | N = 4,5891 |
|---|---|
| grade | |
| K | 0 (0%) |
| 1 | 324 (7.1%) |
| 2 | 411 (9.0%) |
| 3 | 575 (13%) |
| 4 | 784 (17%) |
| 5 | 379 (8.3%) |
| 6 | 272 (5.9%) |
| 7 | 191 (4.2%) |
| 8 | 174 (3.8%) |
| 9 | 690 (15%) |
| 10 | 329 (7.2%) |
| 11 | 266 (5.8%) |
| 12 | 194 (4.2%) |
| gender | |
| Female | 1,849 (50%) |
| Male | 1,833 (50%) |
| Other | 1 (<0.1%) |
| Unknown | 906 |
| race.r | |
| Asian | 522 (17%) |
| Black/African American | 236 (7.8%) |
| Hispanic/Latinx | 1,209 (40%) |
| Other/Multiracial | 292 (9.7%) |
| White | 751 (25%) |
| Unknown | 1,579 |
| age | |
| Mean (SD) | 11.9 (3.3) |
| Min, Max | 6.0, 19.0 |
| 1 n (%) | |
8 ROAR-Syntax Study Description
8.1 Study Overview
In the 2023-24 and 2024-25 school years, we conducted a calibration study to establish the measurement properties of ROAR-Syntax and examine its technical qualities, including reliability and external validity. While the primary focus of the study was grades 2-5, we also collected data from first grade classrooms and secondary schools. The study employed a cross-sectional design with a total of 4589 students from first through twelfth grade.
The study contains three parts:
Main Calibration Analysis (overall sample, n=4589, grades 1-12): The study focused on item calibration, pilot testing of new items, reliability, and internal validity.
External Validity Analysis (subsample, n=870, grades 3-5): Four districts from the overall sample provided scores from state testing (CAASPP/SBAC-ELA). This subset was used for external validity analysis.
Fairness Analysis (subsample, n = 3683): Of the 4589 students from the calibration sample, school districts shared demographic information for 3683 students. This subsample was used to investigate differential item functioning.
8.2 Methods
8.2.1 Data Collection
We collected data using three versions of ROAR-Syntax which differed in the size of the item bank and the time limit for the assessment (Table 8.1).
| Test version | School Year | Item bank | Time Limit | n |
| Pilot A | 2023-24 | 79 items | 8 min | 285 |
| Pilot B | 2024-25 | 79 items | 5 min | 1742 |
| Pilot C | 2024-25 | 95 items | 5 min | 4672 |
Participating districts chose their preferred testing dates for the ROAR assessments. California state testing – Smarter Balanced Assessment Consortium (SBAC-ELA) English Language Arts – occurred according to the usual assessment schedules. This approach enabled efficient data collection while minimizing additional testing burden on students and schools.
8.2.2 Analysis Overview
The calibration study used Rasch measurement modeling to examine item performance and establish the reliability of the ROAR-Syntax measure. Item response theory enabled data from all three pilots to be modelled together regardless of differences in time limit or size of the item bank. Item response data was used to place both items and student ability on the same scale, facilitating comparison of student performance to item difficulties and supporting interpretation of developmental progressions in syntactic knowledge. The validation study used linear regression models to examine the ability of multiple ROAR measures to predict performance on state reading comprehension and English proficiency tests.
8.2.3 Participants
8.2.3.1 Calibration Sample
The calibration study included a total of 4589 students spanning grades 1-12 (mean age = 11.9 years, s.d. = 3.3; range = 6 to 19 years). Participants were a convenience sample recruited from public school districts, private schools, and after-school programs across multiple states. The secondary school students are overrepresentative of struggling students because some secondary districts administered ROAR only to students with low performance on benchmark or state assessments. The sample included data from two sources: (1) schools that adopted the ROAR assessment platform and volunteered to participate in validation research for new measures, and (2) schools participating in a concurrent intervention study conducted by the Language to Literacy Lab at Stanford University. All data were included with appropriate institutional approvals and permissions.
No students were excluded from analyses based on demographic characteristics, language status, ability designation, or special education status. This inclusive approach ensures that reliability and validity evidence reflects the full spectrum of students who will use ROAR-Syntax in schools, including those with diverse learning profiles.
8.2.3.2 External Validity Subsample
The external validity analysis was performed on a subsample from the calibration analysis – 870 students in grades 3-5 from 4 California districts that shared results from state assessment tests. (Students in grades 1 and 2 do not take the state assessment test and so were not included in the analysis. State test data was not available for secondary students.) Three of these districts participated in the concurrent intervention study.
8.2.3.3 Fairness Subsample
The fairness analysis was performed on a subsample from the calibration analysis using gender and race data shared by school districts. Gender was available for 3683 students and race was available for 2455 students.
8.2.3.4 Recruitment Procedures
Schools were recruited through the ROAR research team’s outreach efforts. School district leaders who inquired about the Rapid Online Assessment of Reading (ROAR) platform were given an overview of active research projects by a research coordinator. All administrators who expressed interest in the ROAR Comprehension Suite were provided information about the comprehension measures, including ROAR-Syntax. School leaders selected the specific combination of ROAR assessments to administer to their students based on their assessment priorities and instructional needs.
Schools in the concurrent intervention study were recruited through established partnerships with the Language to Literacy Lab at Stanford University. These schools actively participated in the intervention research and agreed to collect assessment data as part of the study protocol.
8.2.3.5 Demographic Characteristics
calibration sample
The calibration sample demonstrated substantial diversity across multiple demographic dimensions. Grade-level composition reflected participation across the 1-12 range, with intentional oversampling of grades 2-5 (the primary assessment focus) totaling 47% of the sample. Though an initial goal of the project was to develop measures for grades 2-5, we were able to administer the measure to students in grades 1 and 6-12 and use that data to examine assessment performance across the broader developmental range. Table 8.2 presents the complete grade-level distribution.
Across demographic characteristics, the sample reflected substantial racial and ethnic diversity. Approximately 40% of students identified as Hispanic/Latinx, 25% as White, 18% as Asian, 8% as Black/African American, and 10% as other or multiracial. Gender distribution was approximately equal, with 50% female and 50% male students. Gender and race/ethnicity data was not available for 1,580 students (19.7% of the total sample).
The sample included students with diverse language backgrounds and learning needs. Approximately 21% of the sample were identified as English Learners based on district or state criteria, and 47% of students spoke a language other than English at home. Additionally, approximately 7% of students had disabilities documented in their Individualized Education Plans (IEPs), and approximately 3% had 504 accommodation plans. Approximately 39% of students qualified for free or reduced-price lunch, indicating socioeconomic diversity within the sample. Schools represented a range of geographic contexts, including suburban, urban, and rural areas.
8.2.4 Procedures
8.2.4.1 Assessment Administration
Students logged into the ROAR platform and completed several ROAR assessments in their usual school classrooms between April 2024 and June 2025. Teachers or other educators (e.g., reading specialists, school psychologists, etc.) proctored assessments, providing brief verbal instructions to students about how log in to the ROAR platform. Instructions for ROAR-Syntax are given by the software through the students’ headphones. Students responded to items using the input method (mouse, keyboard, or touchscreen) best suited to their school-provided device (usually a Chromebook or iPad). The assessment presented items in random order (rather than the fixed developmental sequence of the TROG) to reduce practice and fatigue effects on item difficulty estimates.
8.2.4.2 Item Sample
The ROAR-Syntax calibration included a total of 95 items: 72 items retained from the original Test for Reception of Grammar (TROG) and 23 new items developed by the ROAR team. The original TROG items represent 18 of the 20 syntactic structures from the original test. (Eight items from two blocks were dropped – the “noun” block was used for practice items and the “masculine/feminine pronoun” block was not used.) The 23 new items systematically target six blocks of advanced syntactic structures identified in the construct mapping process: advanced prepositions, coordinating conjunctions, compound predicate, gerund phrase, participle phrase, and subordinating conjunctions.
8.2.4.3 Time Limits
In order to ensure the ROAR-Comprehension suite could be completed by most participants within an instructional period, a time limit for ROAR-Syntax was set at 8 minutes in version A and was reduced to 5 minutes in versions B and C (Table 8.1).
8.2.4.4 Data Management and Cleaning
Researchers downloaded and cleaned all ROAR-Syntax response data collected from April 2024 to June 2025. We removed data from students whose parents requested opt-out, and excluded data from organizations with fewer than 5 students to protect confidentiality. If students took ROAR-Syntax multiple times on the same day (some students exited the application early and restarted), only the first attempt with more than 5 items attempted was used. When students took ROAR-Syntax on different dates (for instance in fall and spring), we used both sets of responses for item calibration and the closest date to the state testing in the external validity analysis.
Reviewers identified five items that could be problematic for students with color-blindness. The artist changed the colors, and the team updated the items with corrected illustrations in version C. To ensure consistency, we excluded all trials with the original illustrations from the analyses. This quality control procedure ensures that all calibration analyses reflect consistent item presentation across participants.
8.3 Calibration Results
8.3.0.1 Methodology
The Rasch measurement model (Rasch 1993) was employed to calibrate the ROAR-Syntax response data using the mirt package (version 1.42) (Philip Chalmers 2012) in R (version 4.4.1) (R Core Team 2024). All items were dichotomously scored (1 = correct, 0 = incorrect). The mean ability (theta) was fixed to 0 for model identification purposes. This approach places both items and students on the same interval scale, facilitating interpretation of student performance relative to item difficulty. A fixed lower asymptote parameter of 0.25 was set in accordance with the four-choice multiple choice design of the assessment, accounting for the probability of correct response due to random guessing.
8.3.0.2 Item Evaluation
Multiple criteria were used to evaluate individual items to identify potential measurement problems and inform decisions about item retention, revision, or removal. This comprehensive item analysis ensures that all items in the final assessment contribute meaningfully to measurement precision and validity.
Item fit was examined using infit and outfit statistics, which indicate whether students’ responses to each item follow patterns predicted by the Rasch model. Acceptable infit and outfit values range from 0.7 to 1.3, with values near 1.0 indicating optimal fit (Wu and Adams (2013)).
Items were also evaluated by examining item-rest point-biserial correlations, which indicate whether endorsing a particular item correctly correlates with the score on the full assessment (higher-ability students are more likely to answer the item correctly). Correlations above 0.20 indicate items are informative for the construct measured by the rest of the items and function coherently. Items with correlations below 0.20 were flagged for further investigation through item characteristic curve (ICC) analysis and distractor analysis.
The item analysis followed a principled decision framework balancing statistical evidence with theoretical and practical considerations. Items retained from the original TROG have widespread use in clinical and research contexts. New items were held to rigorous standards, as they lacked this established track record. Decisions also considered the item’s contribution to construct coverage (e.g., representing important syntactic structures) and the practical impact of item removal.
8.3.0.3 Student Ability and Item Difficulty
The Wright map (Figure 8.1) presents a visual comparison of student ability distribution (left side) with item difficulty distribution (right side), both placed on the same interval scale. This comparison provides evidence for whether the assessment appropriately measures the ability of the student population and where measurement precision is strongest and weakest.
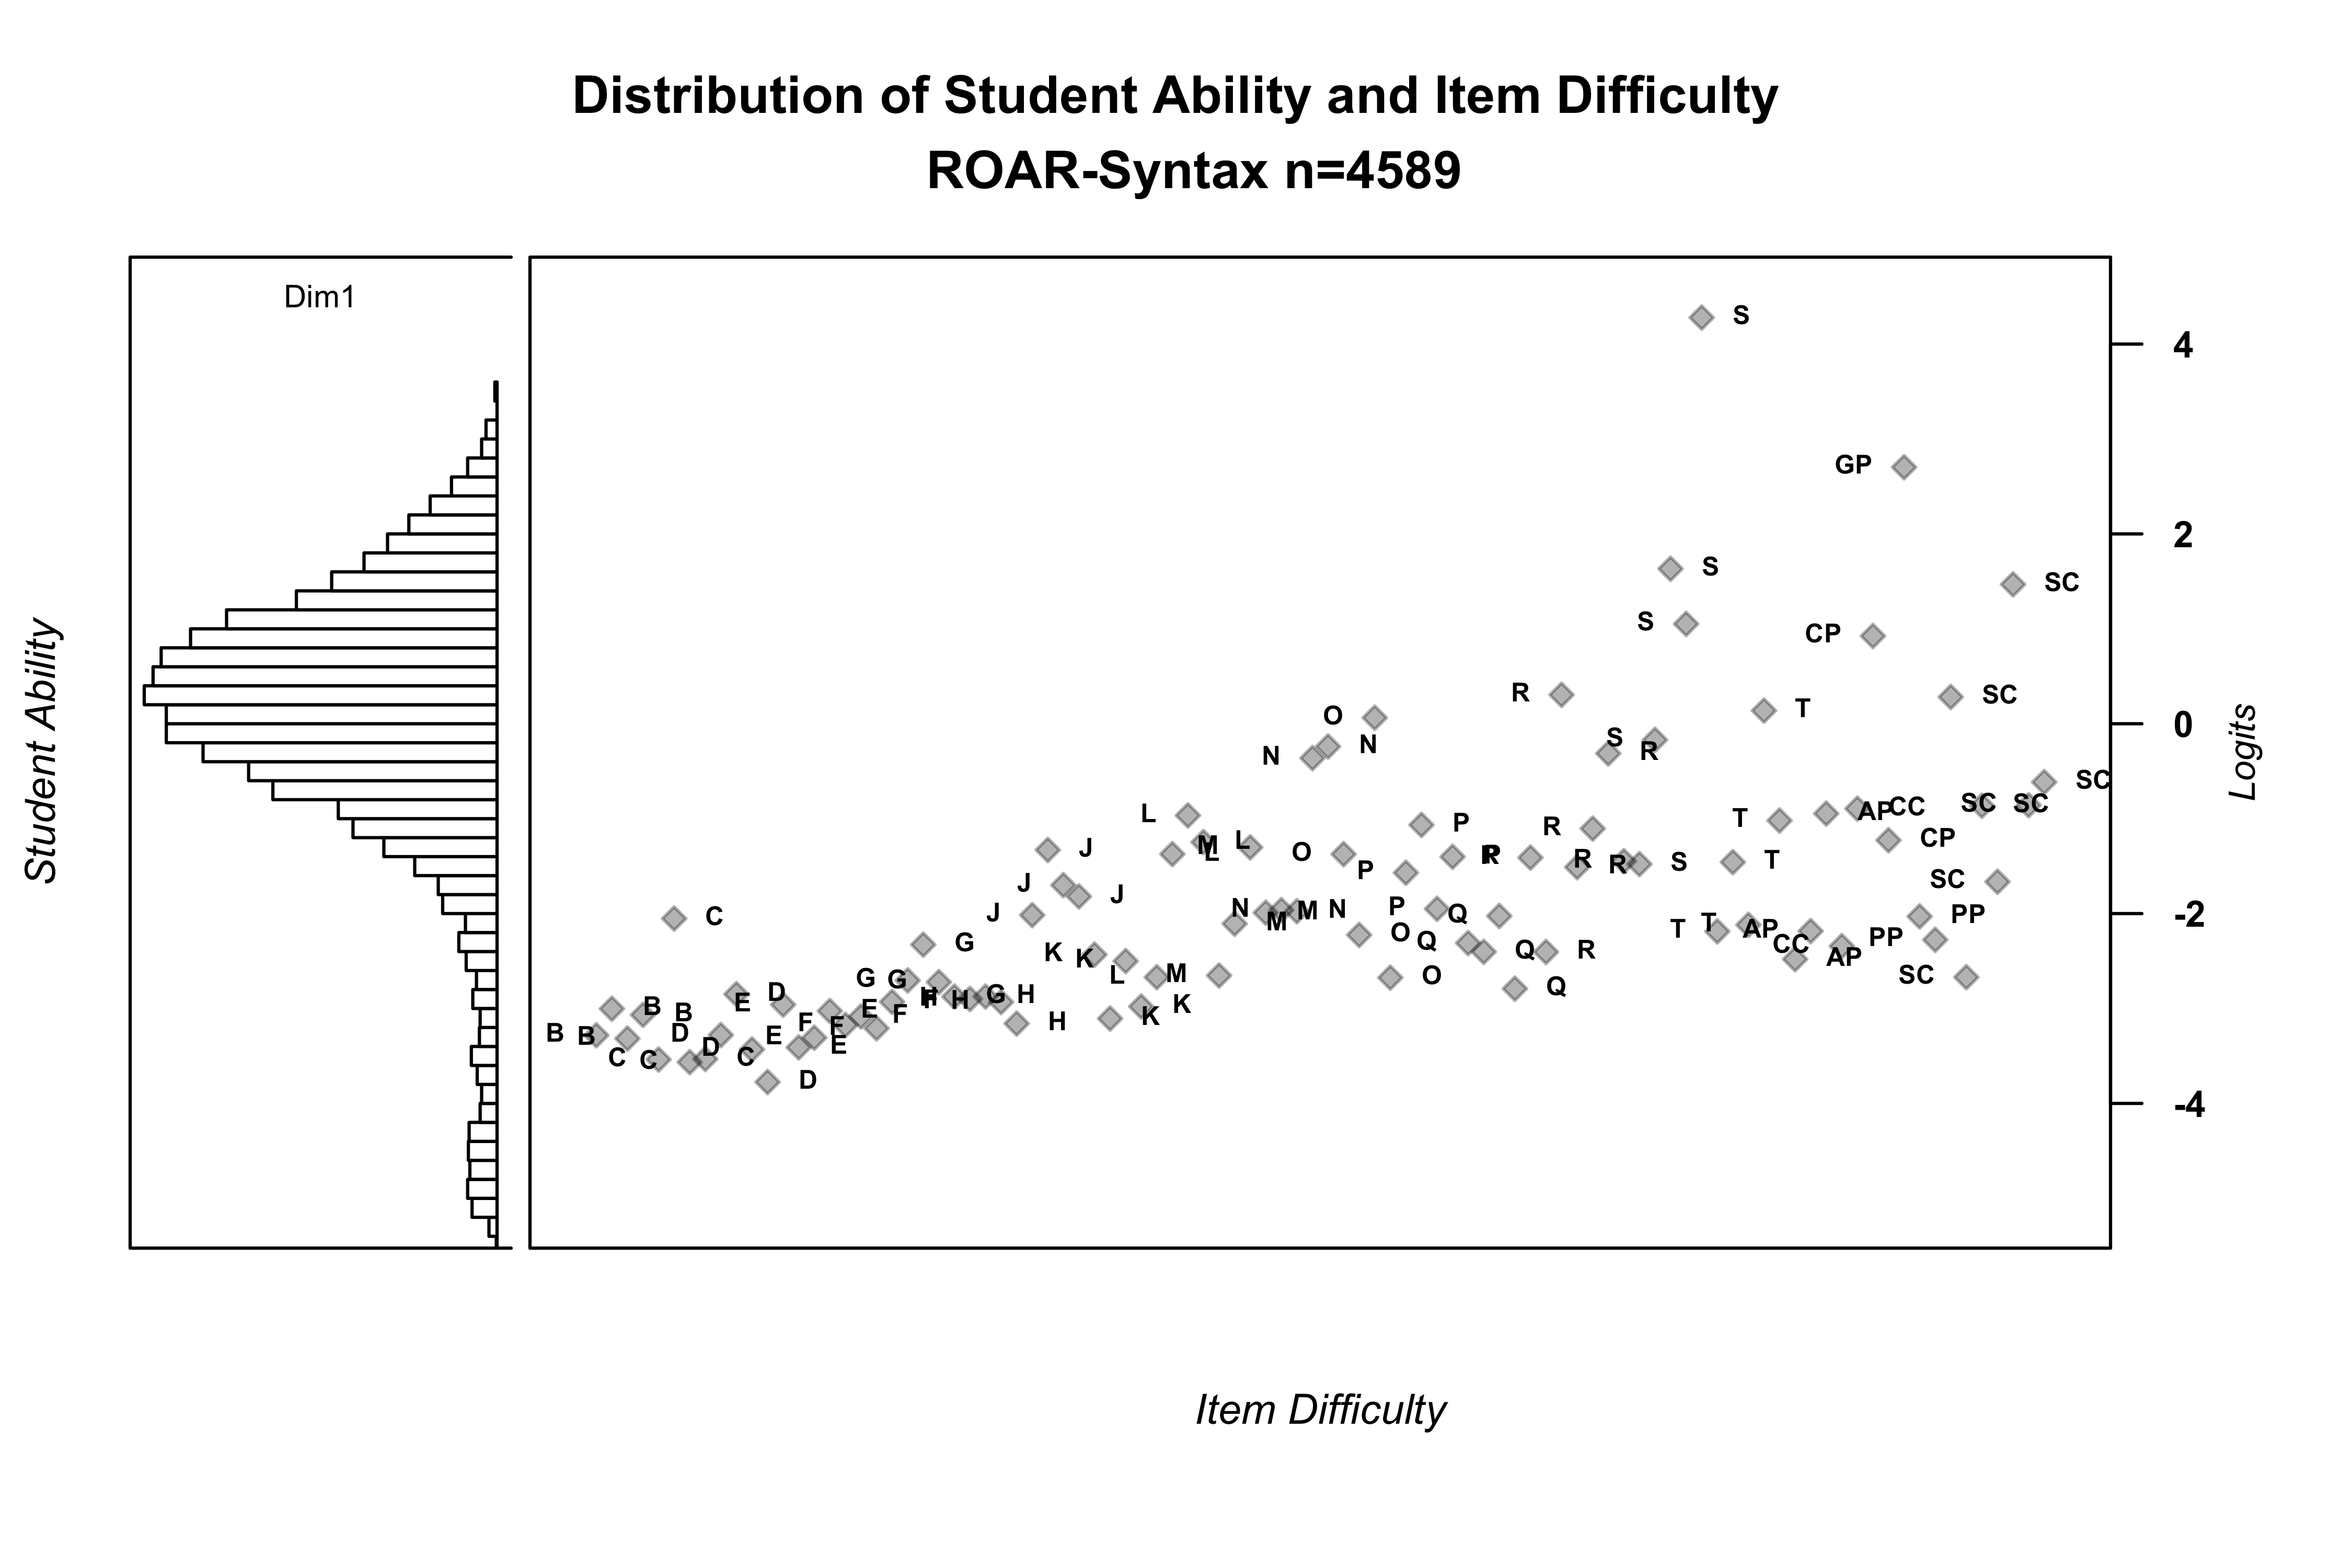
The distribution of student ability demonstrates substantial variation, ranging from students with very limited syntactic knowledge to those with sophisticated understanding of complex structures. The majority of students have abilities above the difficulty of most items in the assessment, indicating that many items are relatively easy for the sample as a whole. This pattern is expected given that students were assessed across grades 1-12, with younger students (grades 1-2) performing at the lower end and older students (grades 6-12) at the upper end.
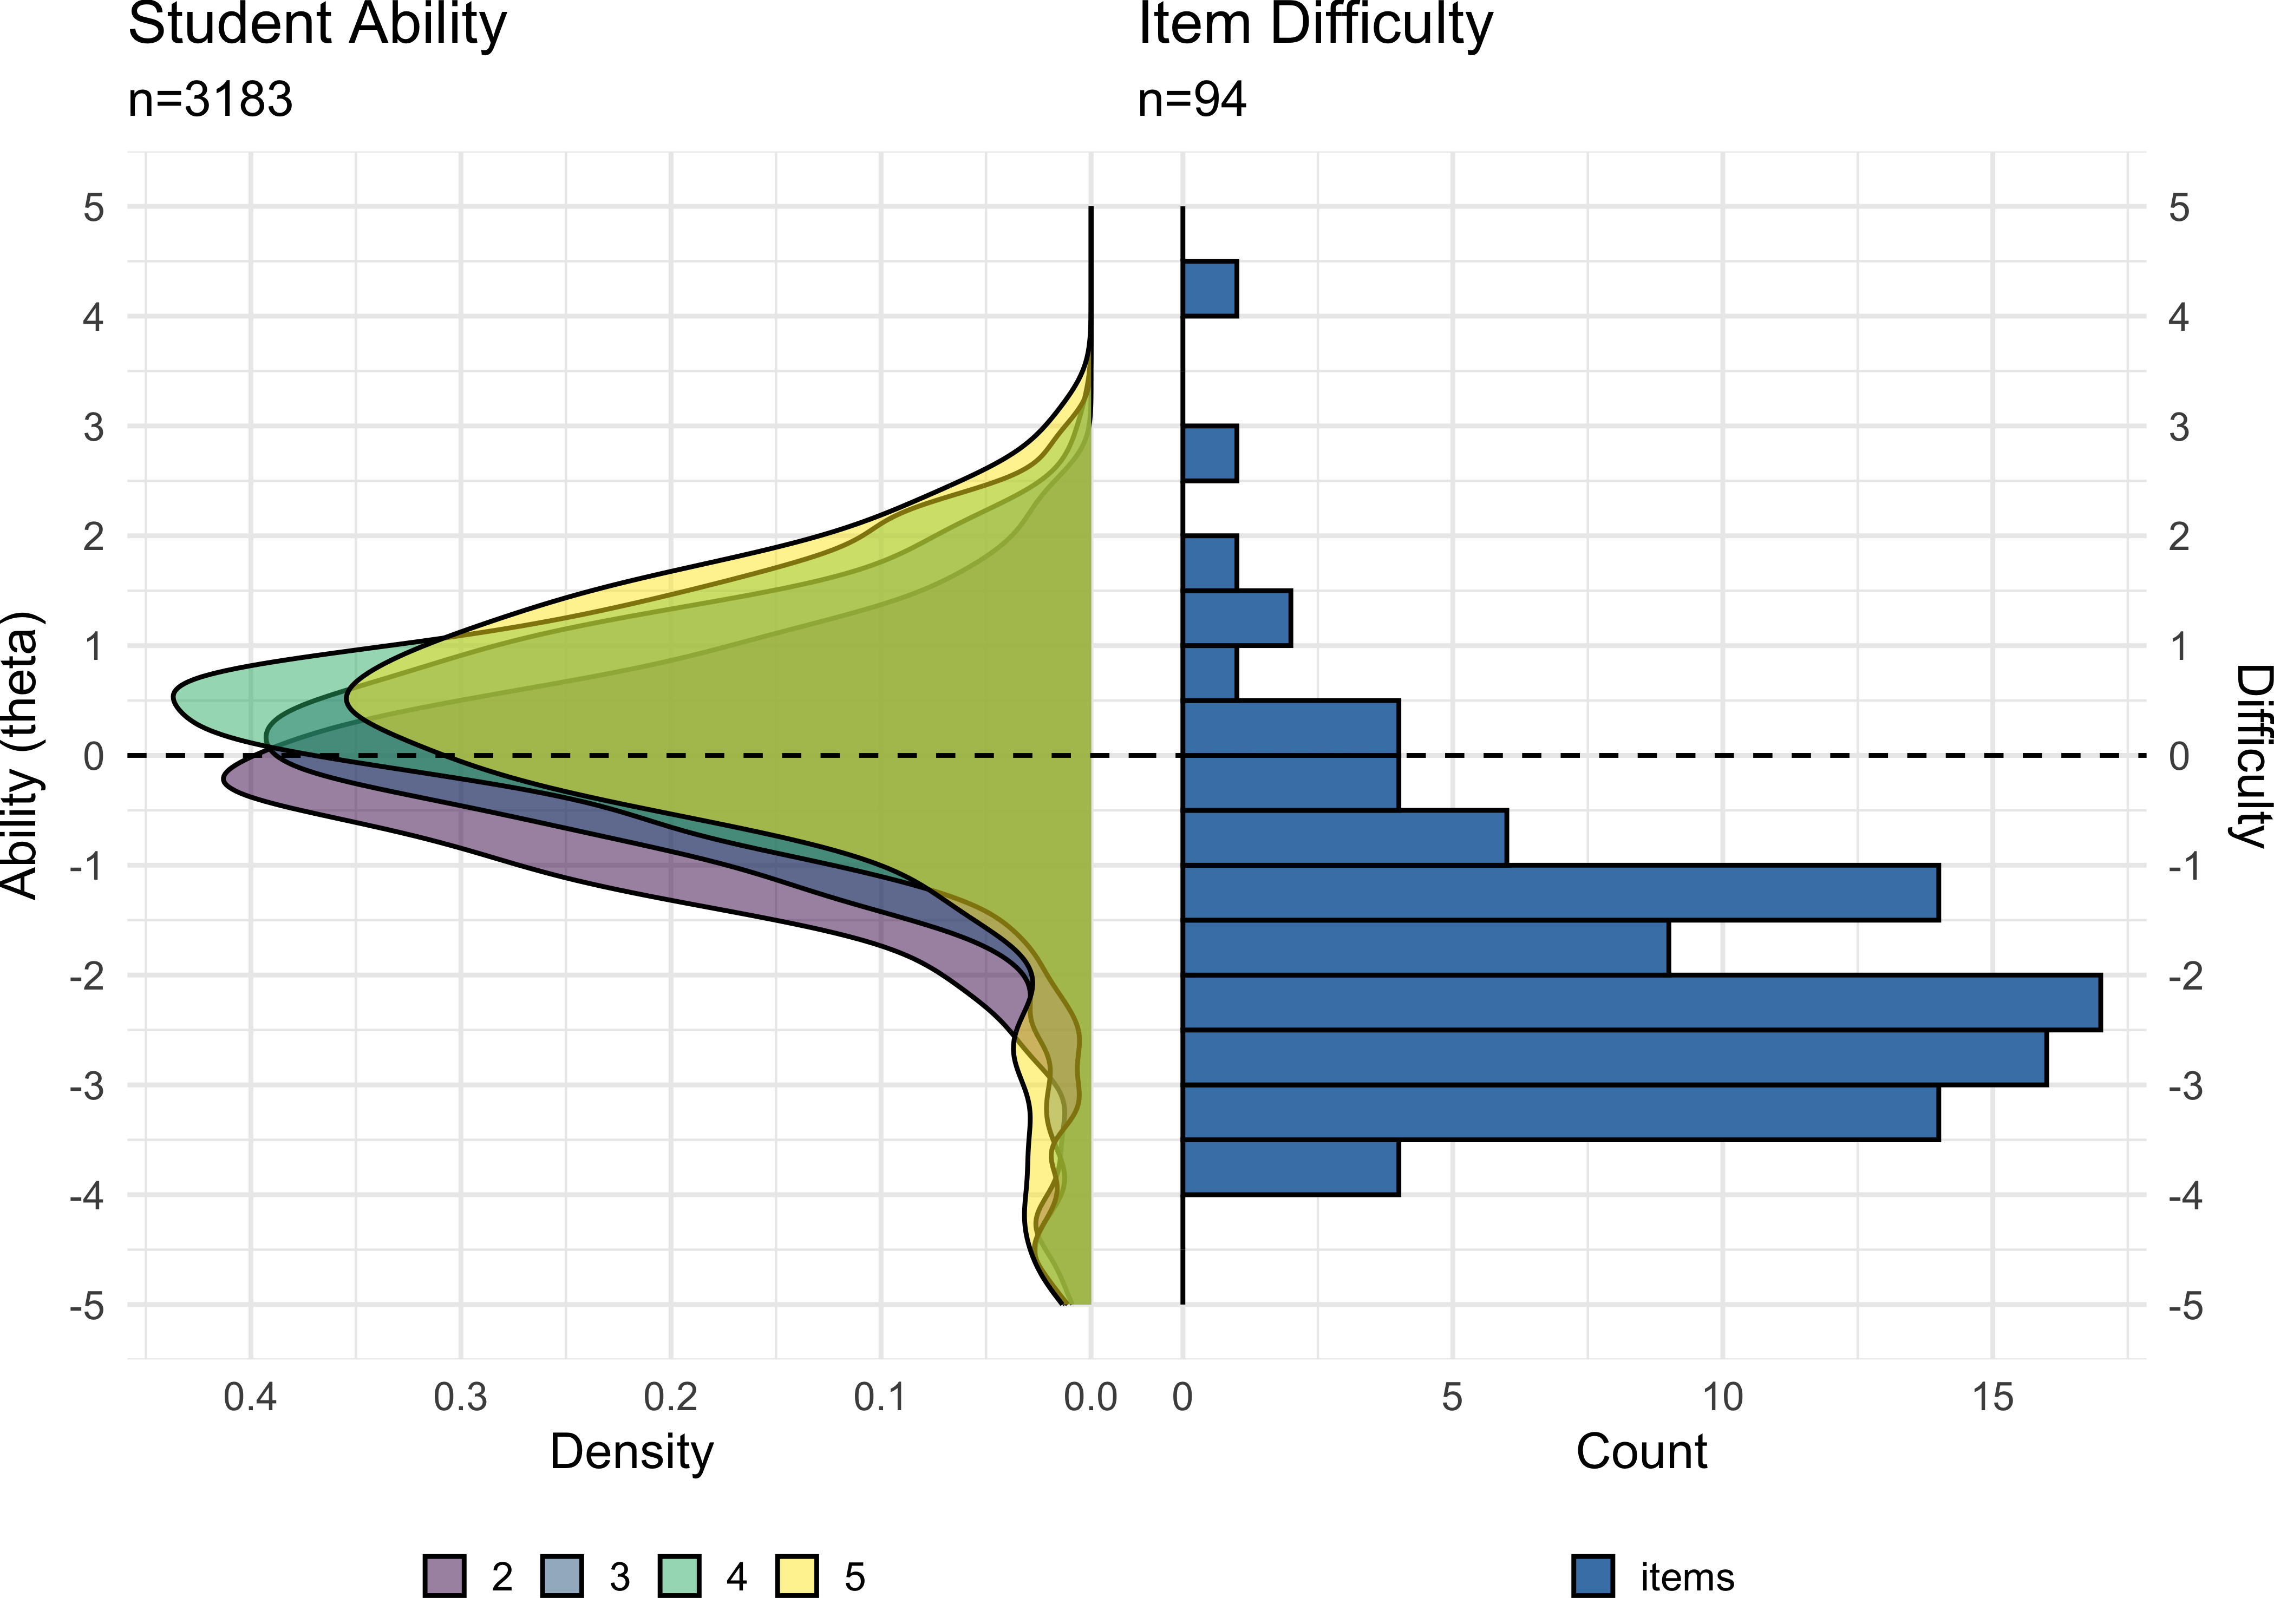
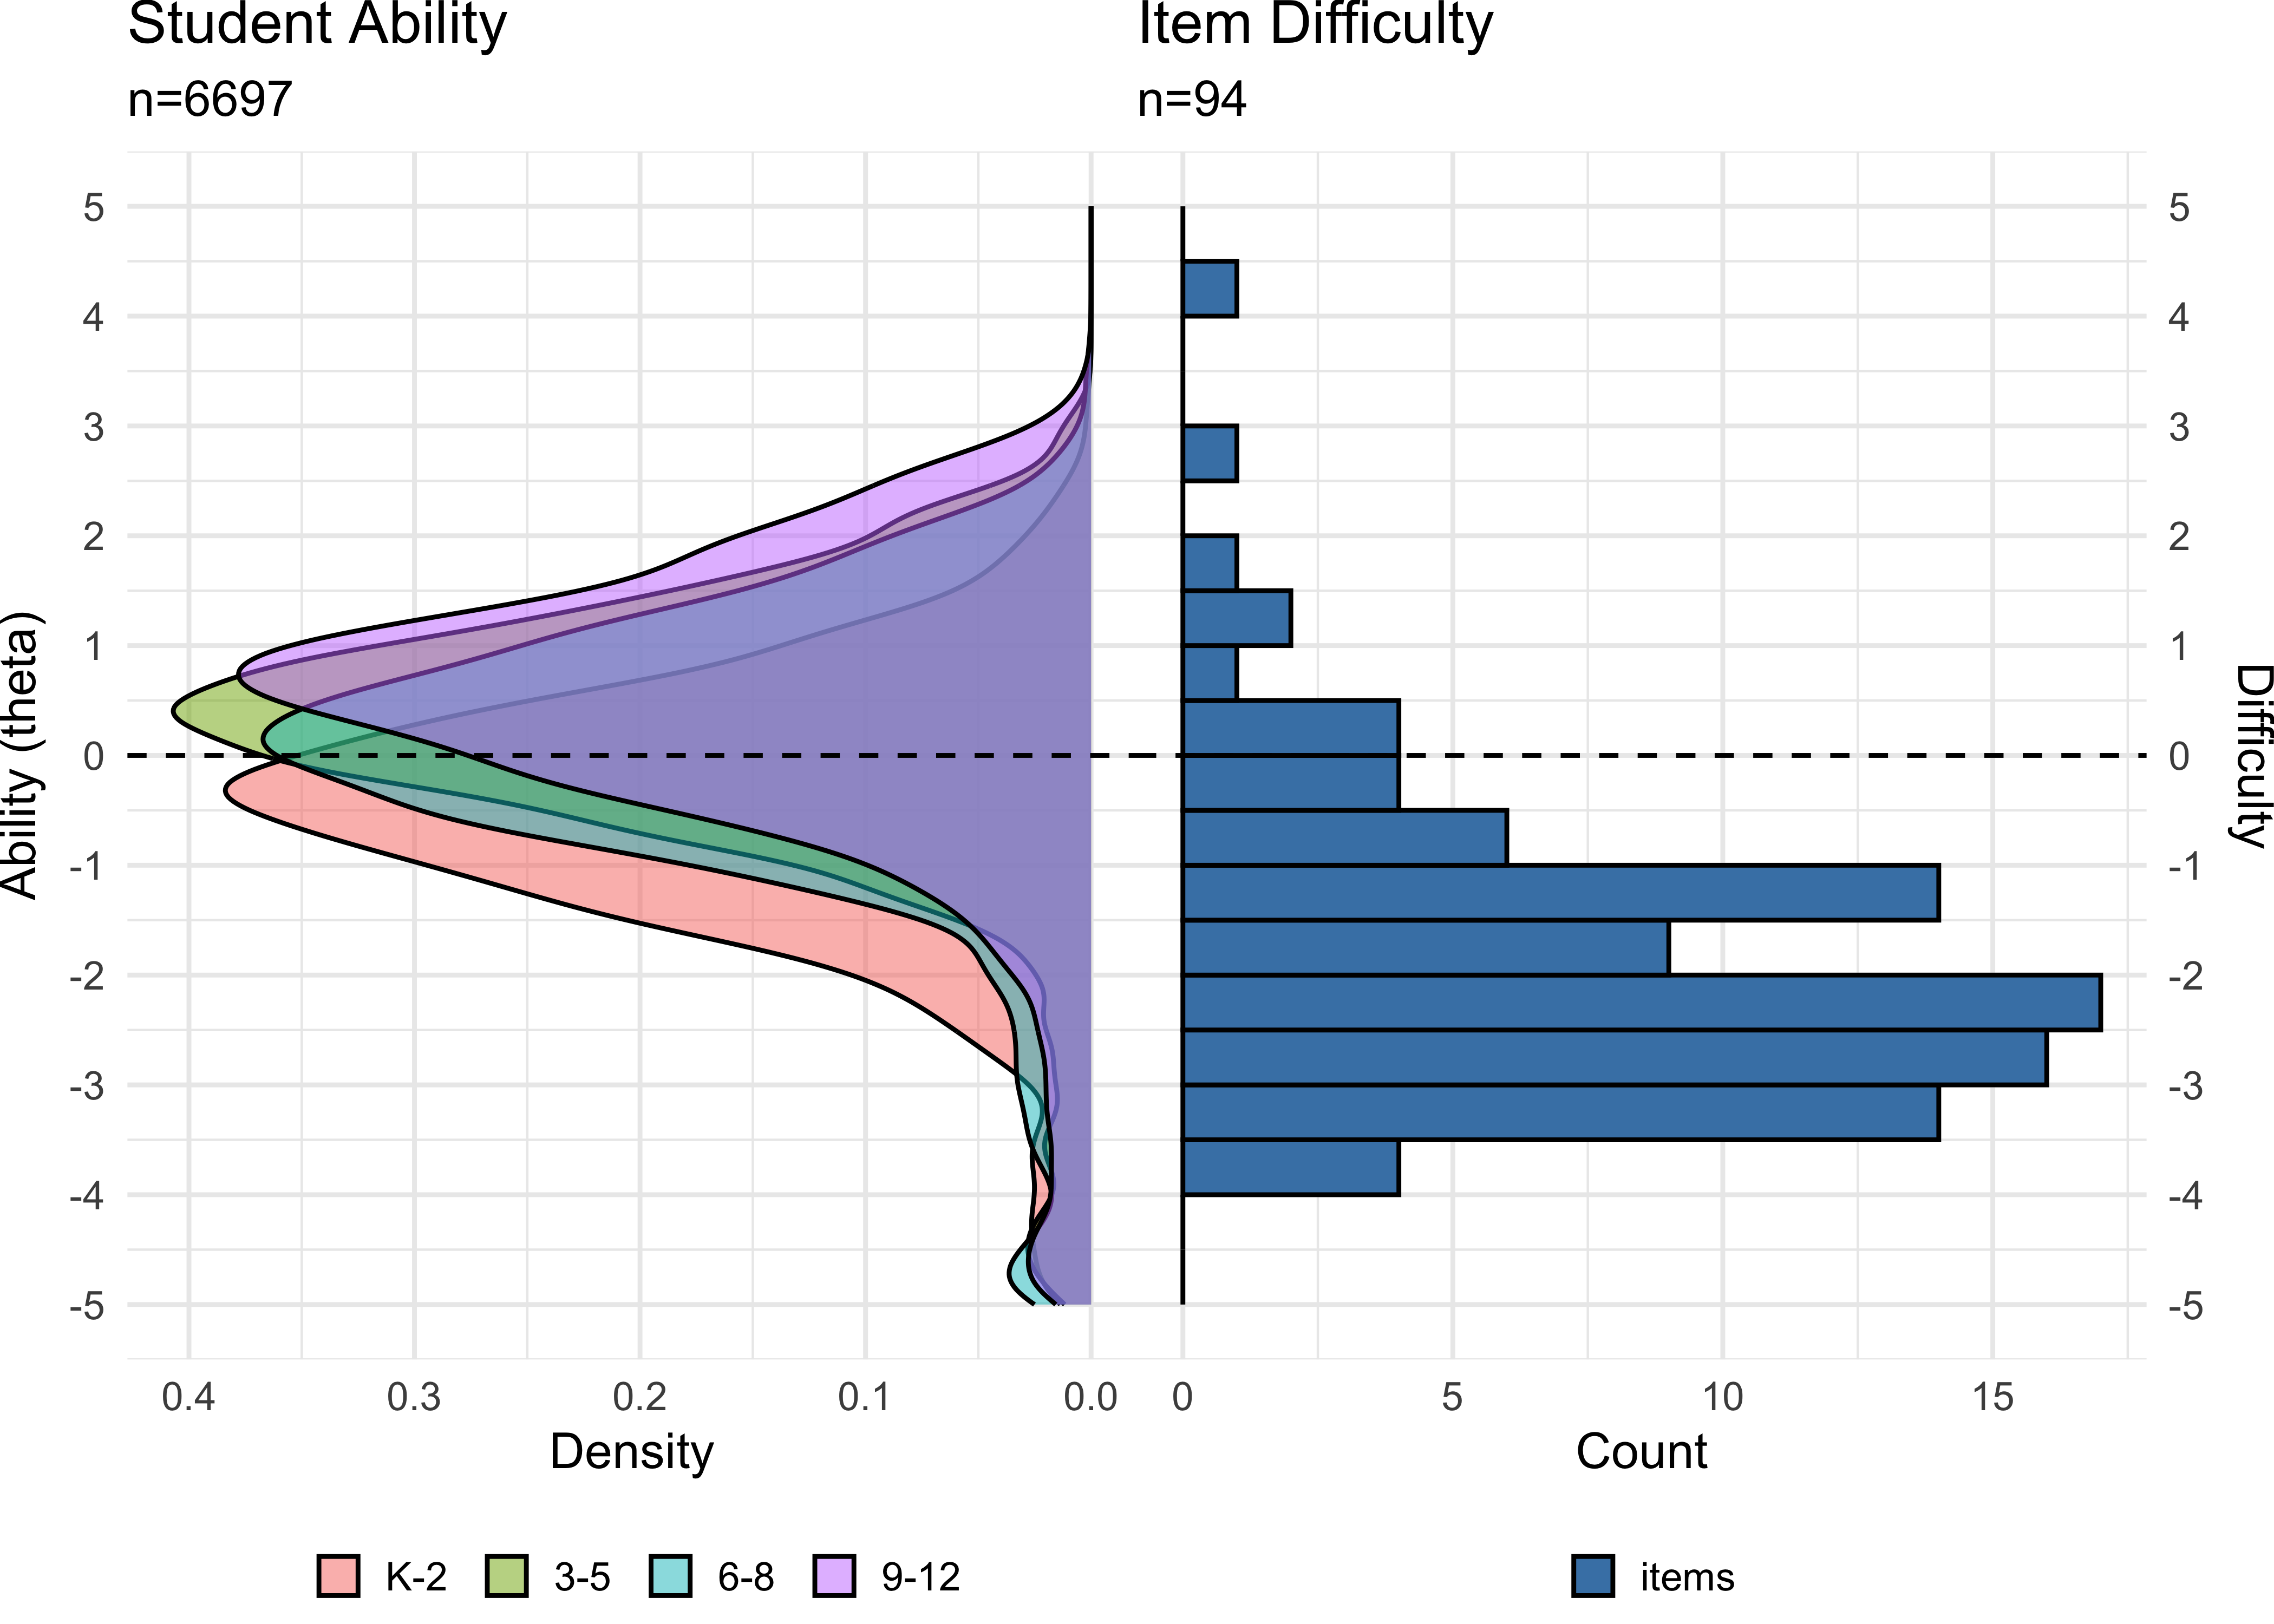
To examine whether the assessment appropriately measures student ability in different grade ranges, Figure 8.2 shows the distribution of ability density in grades 2-5 compared to item difficulty distribution. Figure 8.3 shows the distribution for all grades. This comparison reveals that the assessment provides reasonable coverage across grade levels, though the concentration of items at the lower difficulty range means that measurement precision is stronger for younger elementary students (grades 1-3) than for older students (grades 6-12) and at the lower end of the ability continuum compared to the upper end. This property makes ROAR-Syntax well suited as a quick assessment designed to detect relative strength or need in the area of syntactic knowledge but less well suited for measuring growth across the whole 1-12 ability range.
8.3.0.4 Difficulty by Syntactic Structure
The TROG organizes items into blocks representing distinct syntactic constructs, ordered developmentally from simple to complex. Examining item difficulty by block (Figure 8.4) provides evidence for whether the theoretical developmental ordering aligns with empirical performance patterns. This analysis also identifies blocks where items cluster together in difficulty versus blocks with more variability.
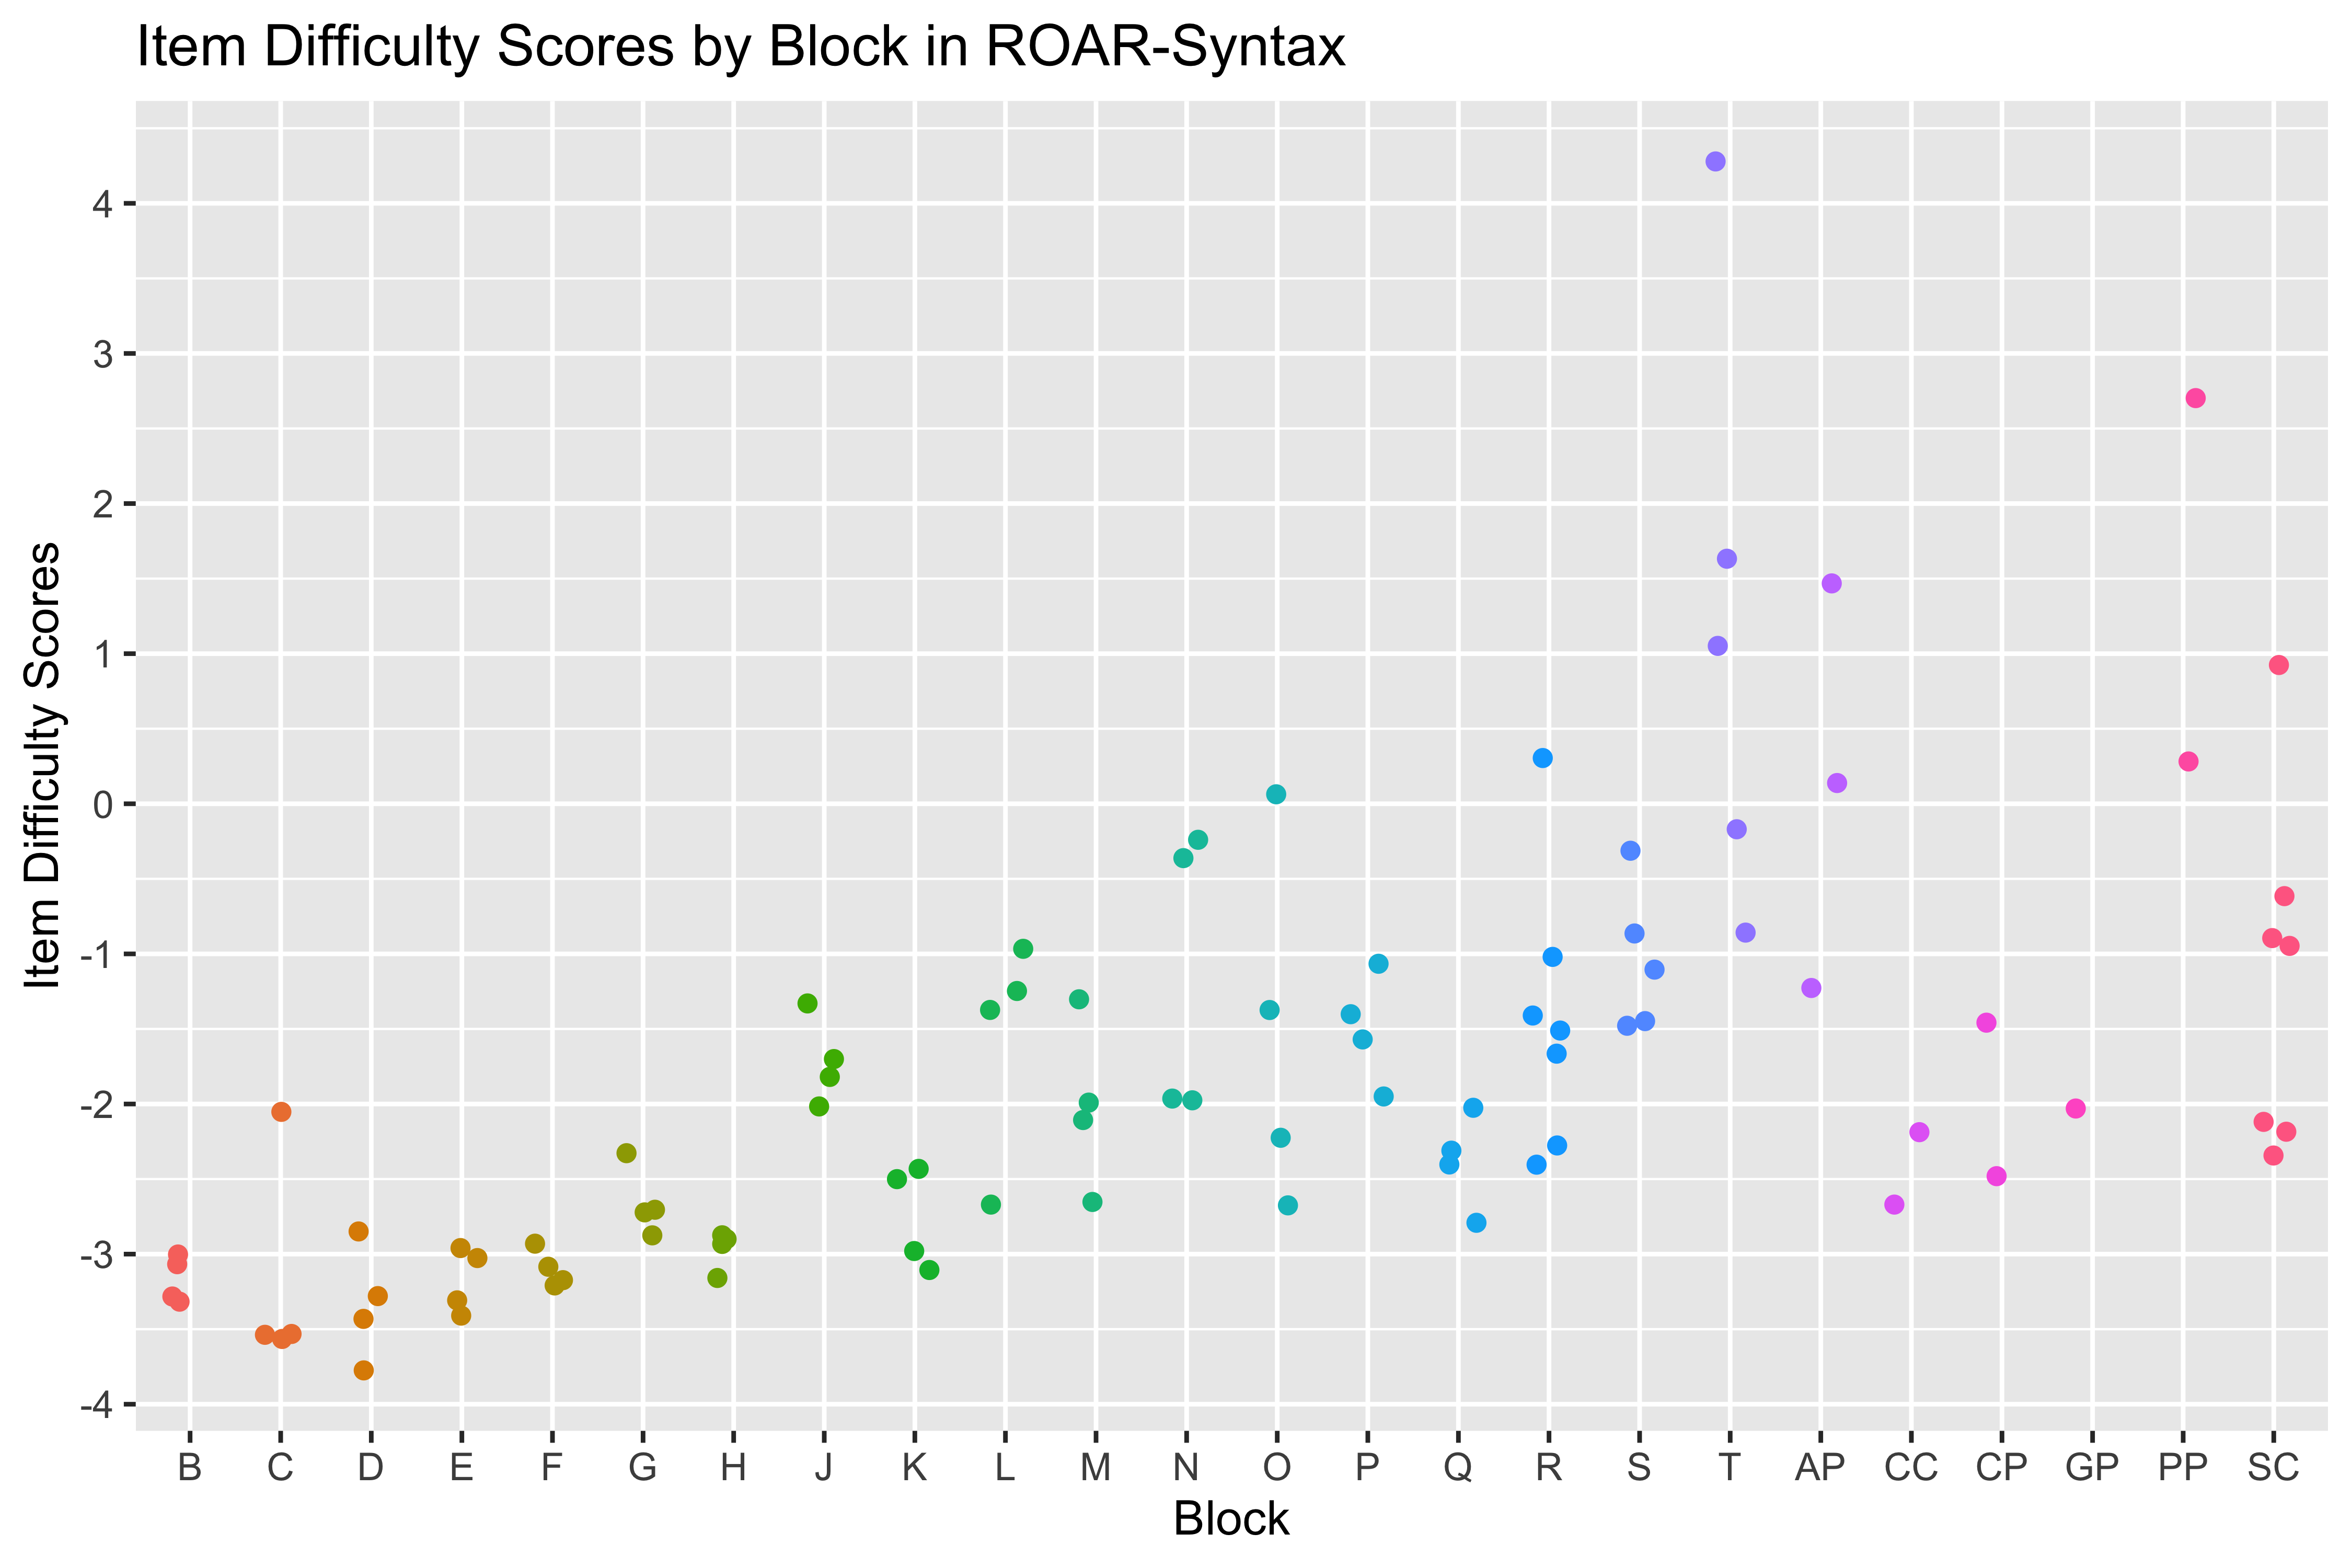
TROG blocks A, B, and C are lexical checks ensuring students can identify some of the objects and actions used later in the assessment. Block A (noun) was repurposed for practice items and was not included in the item calibration analysis. Items in blocks B (verbs) and C (adjectives) were answered correctly by 90-98 percent of students, indicating they are appropriately easy for the calibration sample. These items cluster tightly in difficulty, with one exception: Item B10 (“tall”) was answered correctly by only 85 percent of students, suggesting that this particular adjective was less well-known, or the Distractor analysis revealed that 8-11 percent of students in the middle ability quartiles were drawn to distractors for B10, compared to only 1-2 percent for other items in this block. Items in blocks D, E, and F target basic word order relationships.
In blocks E-L, which use the lexical-syntactic distractor strategy, most items within each block cluster within 1 logit, demonstrating consistent measurement of each syntactic construct. A general trend of increasing difficulty across blocks D through L is evident, supporting the theoretical developmental ordering. These blocks require students to track more complex syntactic relationships, including where word order changes could be misinterpreted. Block J (singular/plural noun inflection) shows an exception to this trend, being approximately 1 logit more difficult than its immediate neighbors, suggesting additional complexity in how students process plural inflection.
Items for blocks M-T, which use the multi-syntactic distractor strategy, ttend to have a wider range of difficulty within each block. The most difficult items overall appear in block T (embedded sentences), requiring students to understand relationships between multiple clauses.
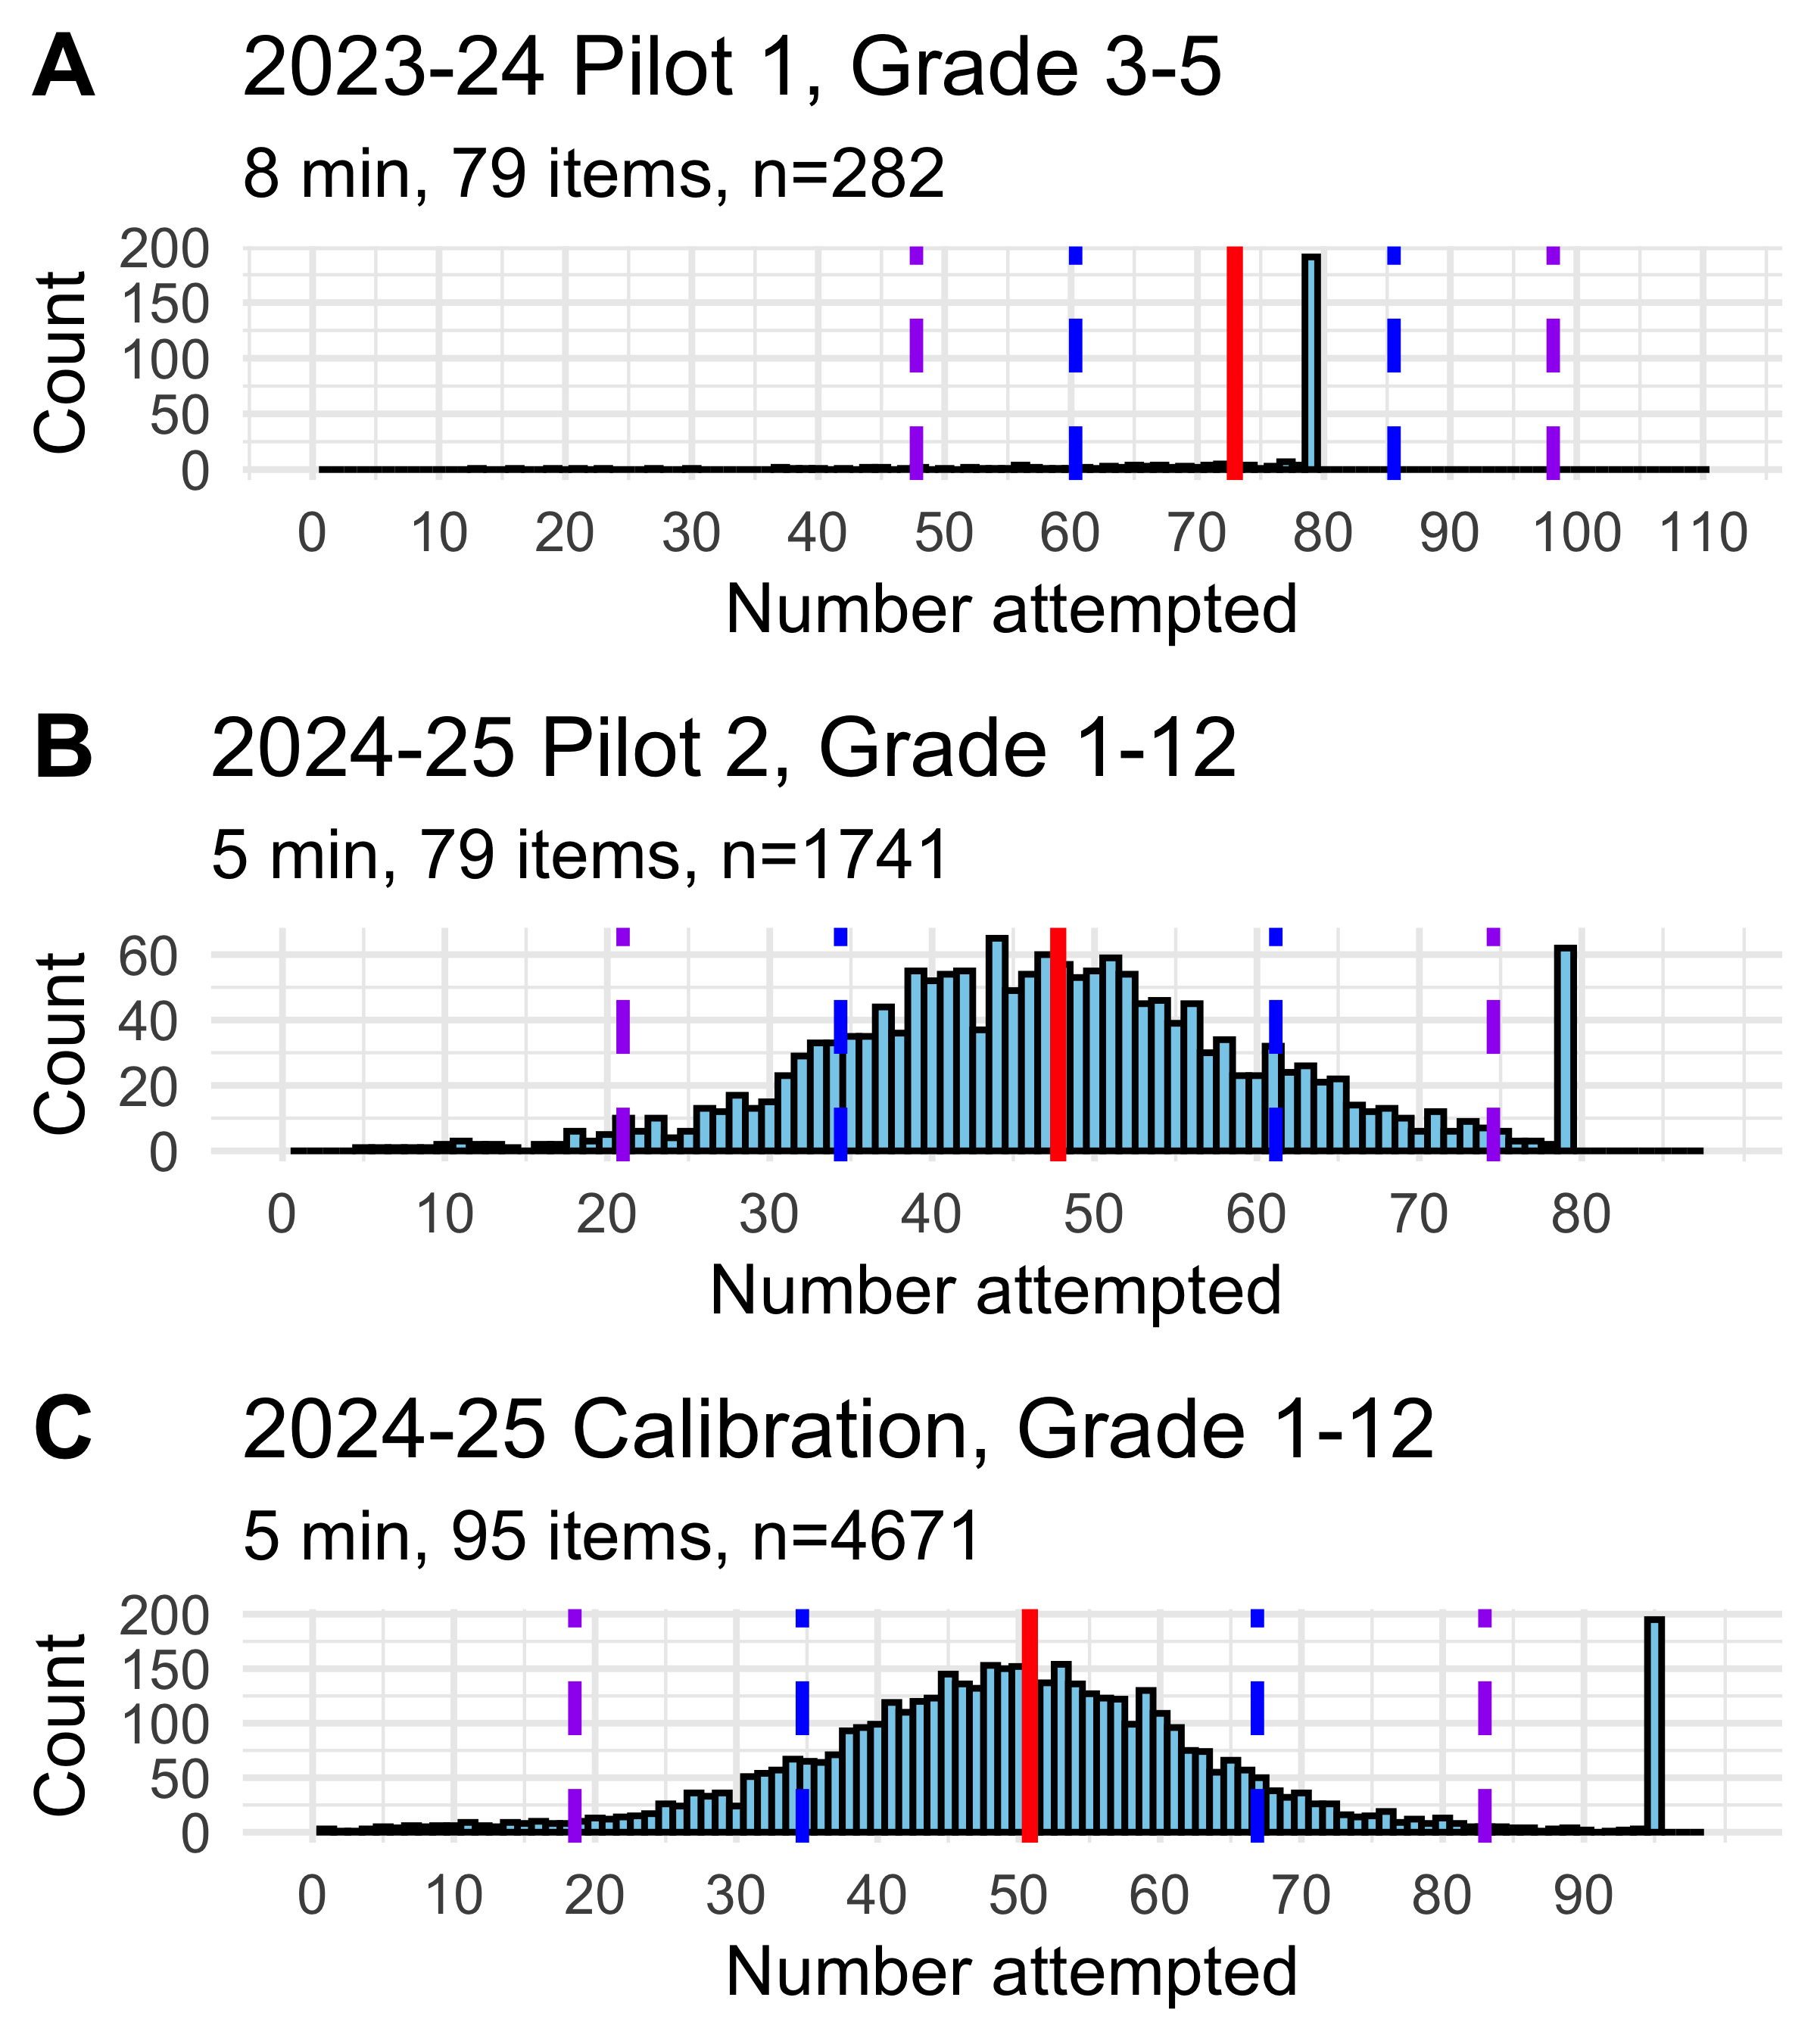
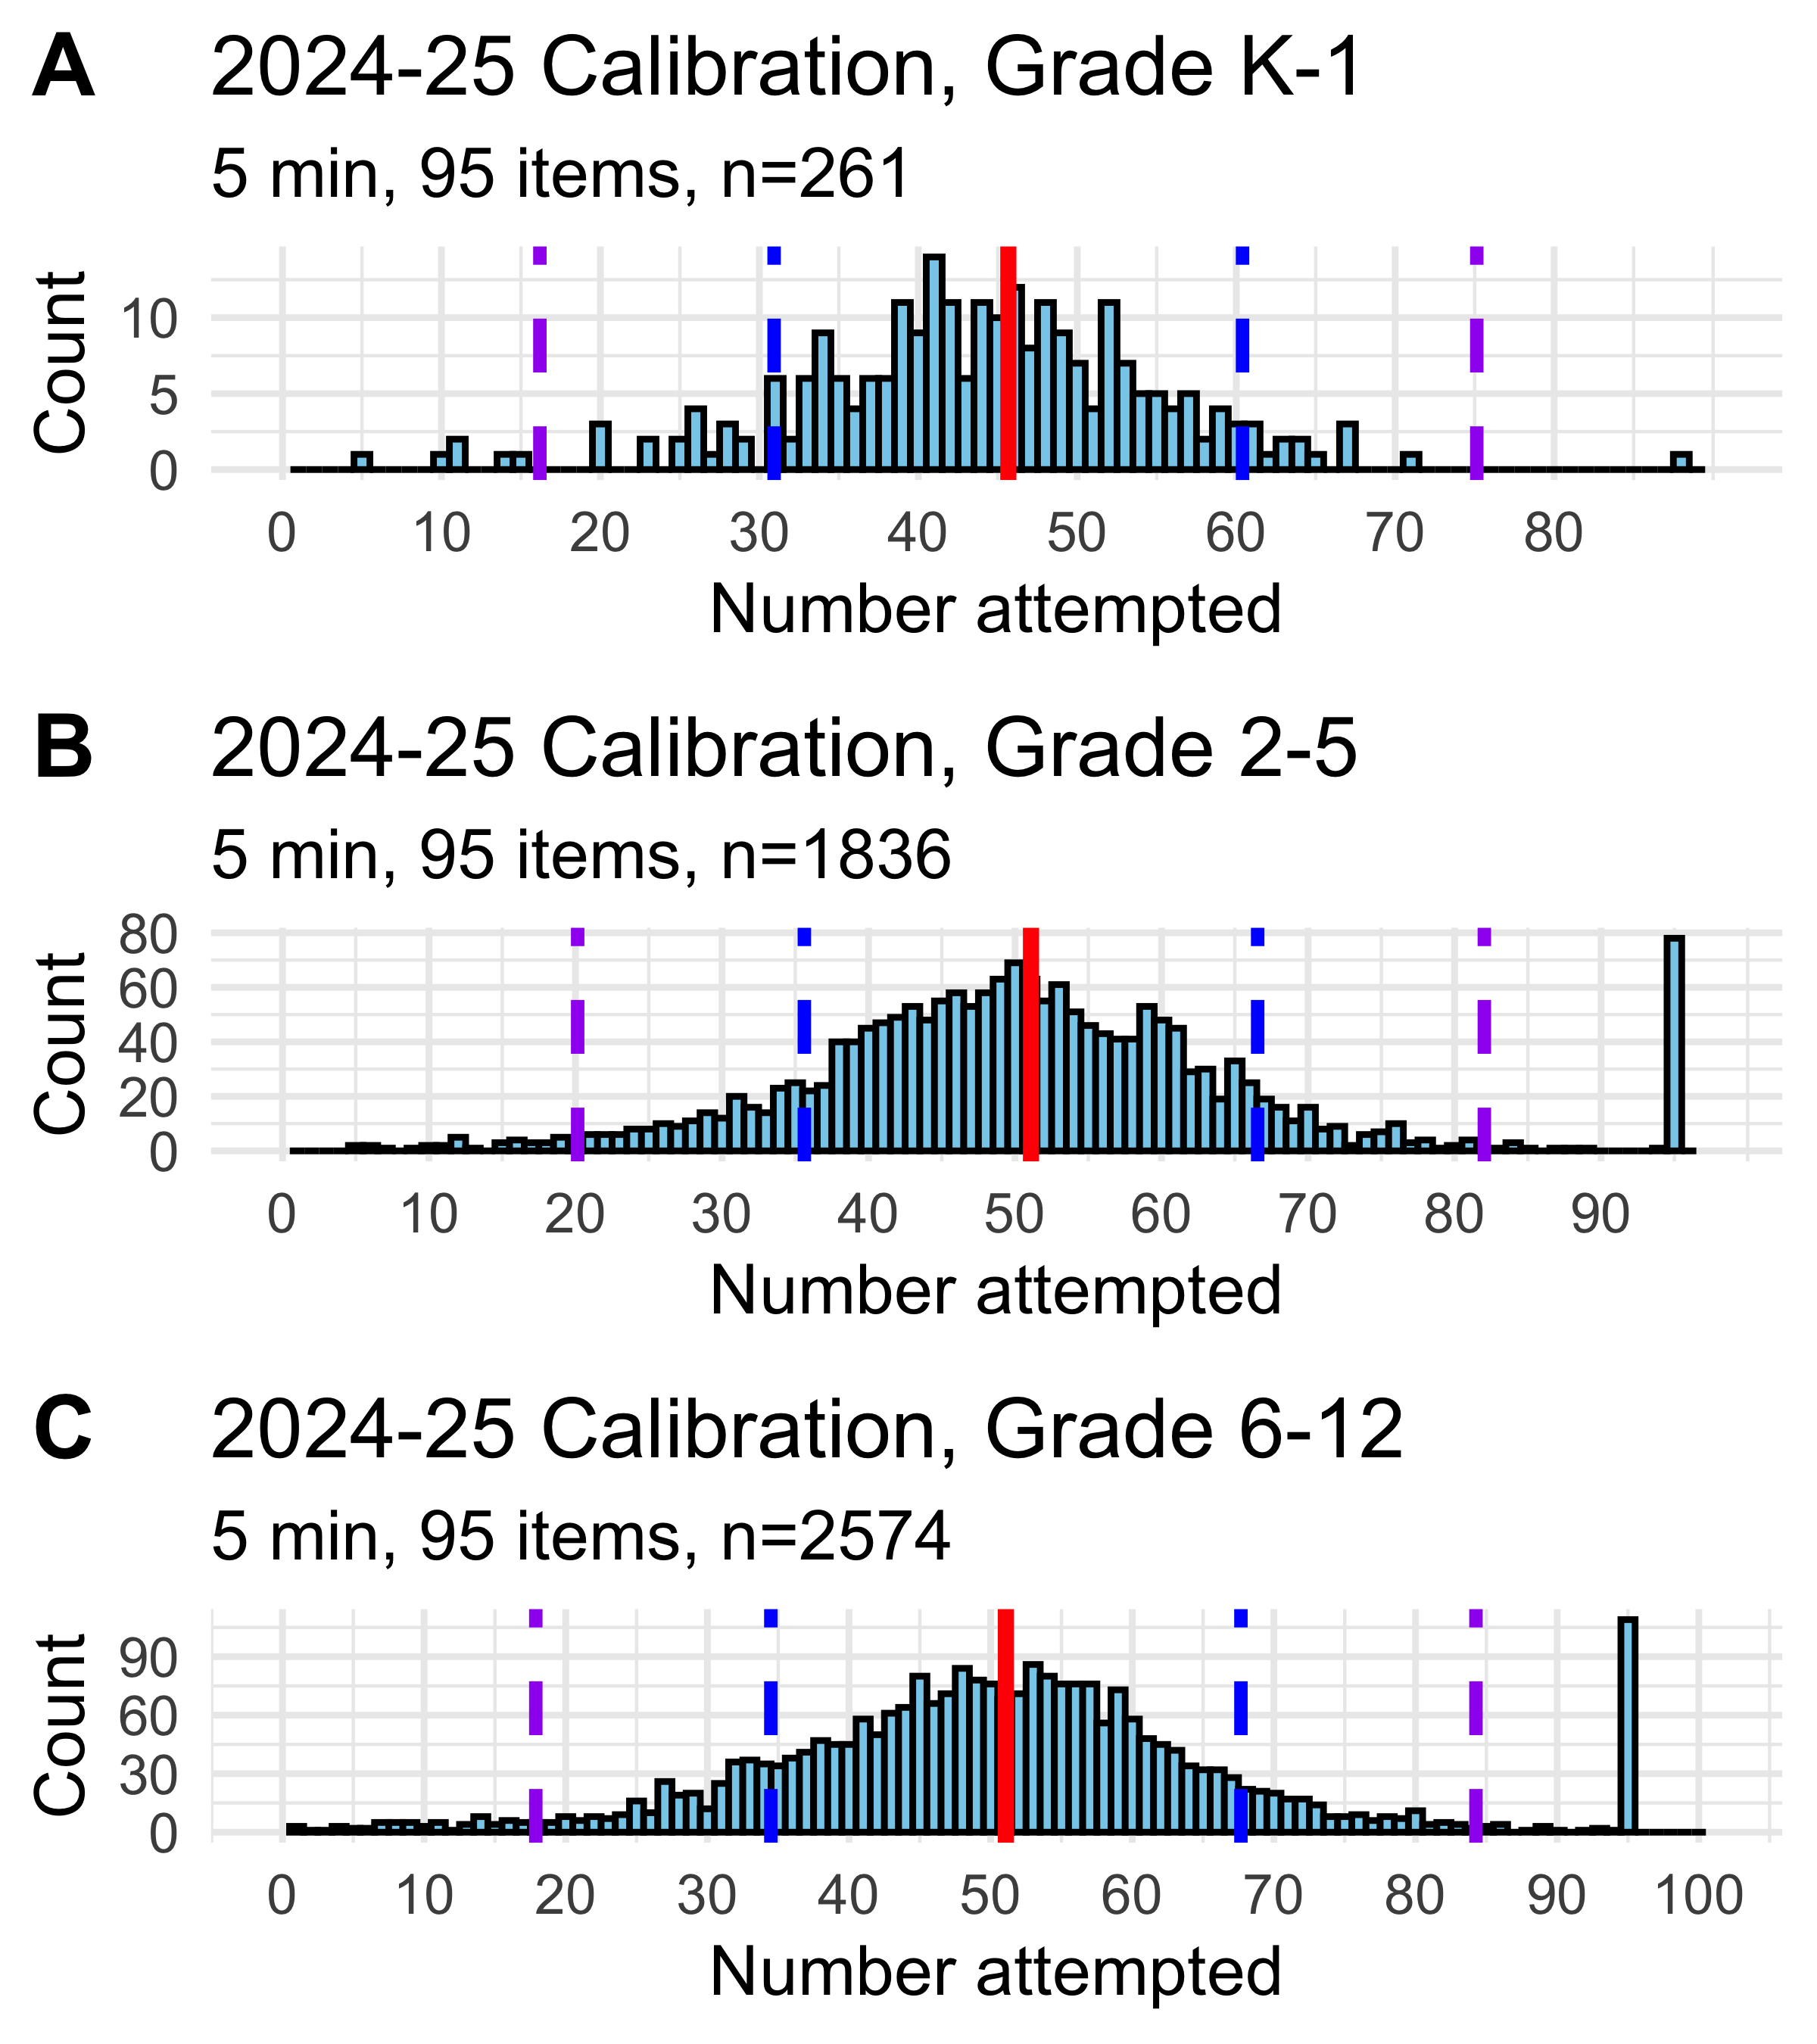
8.3.0.5 Items Attempted
Students completed the assessment under time constraints (8 minutes in pilot A, 5 minutes in pilots B and C), and with a maximum of 79 items in pilots A and B and 95 items in pilot C (Table 8.1). Figure 8.5 shows the distribution of the number of items that students attempted in each version of the task, while Figure 8.6 compares number attempted by grade range in pilot C. Data from all three pilots were combined for all other analyses. Across all data collected, the average number of items attempted was 51.96(s.d.=16.47).
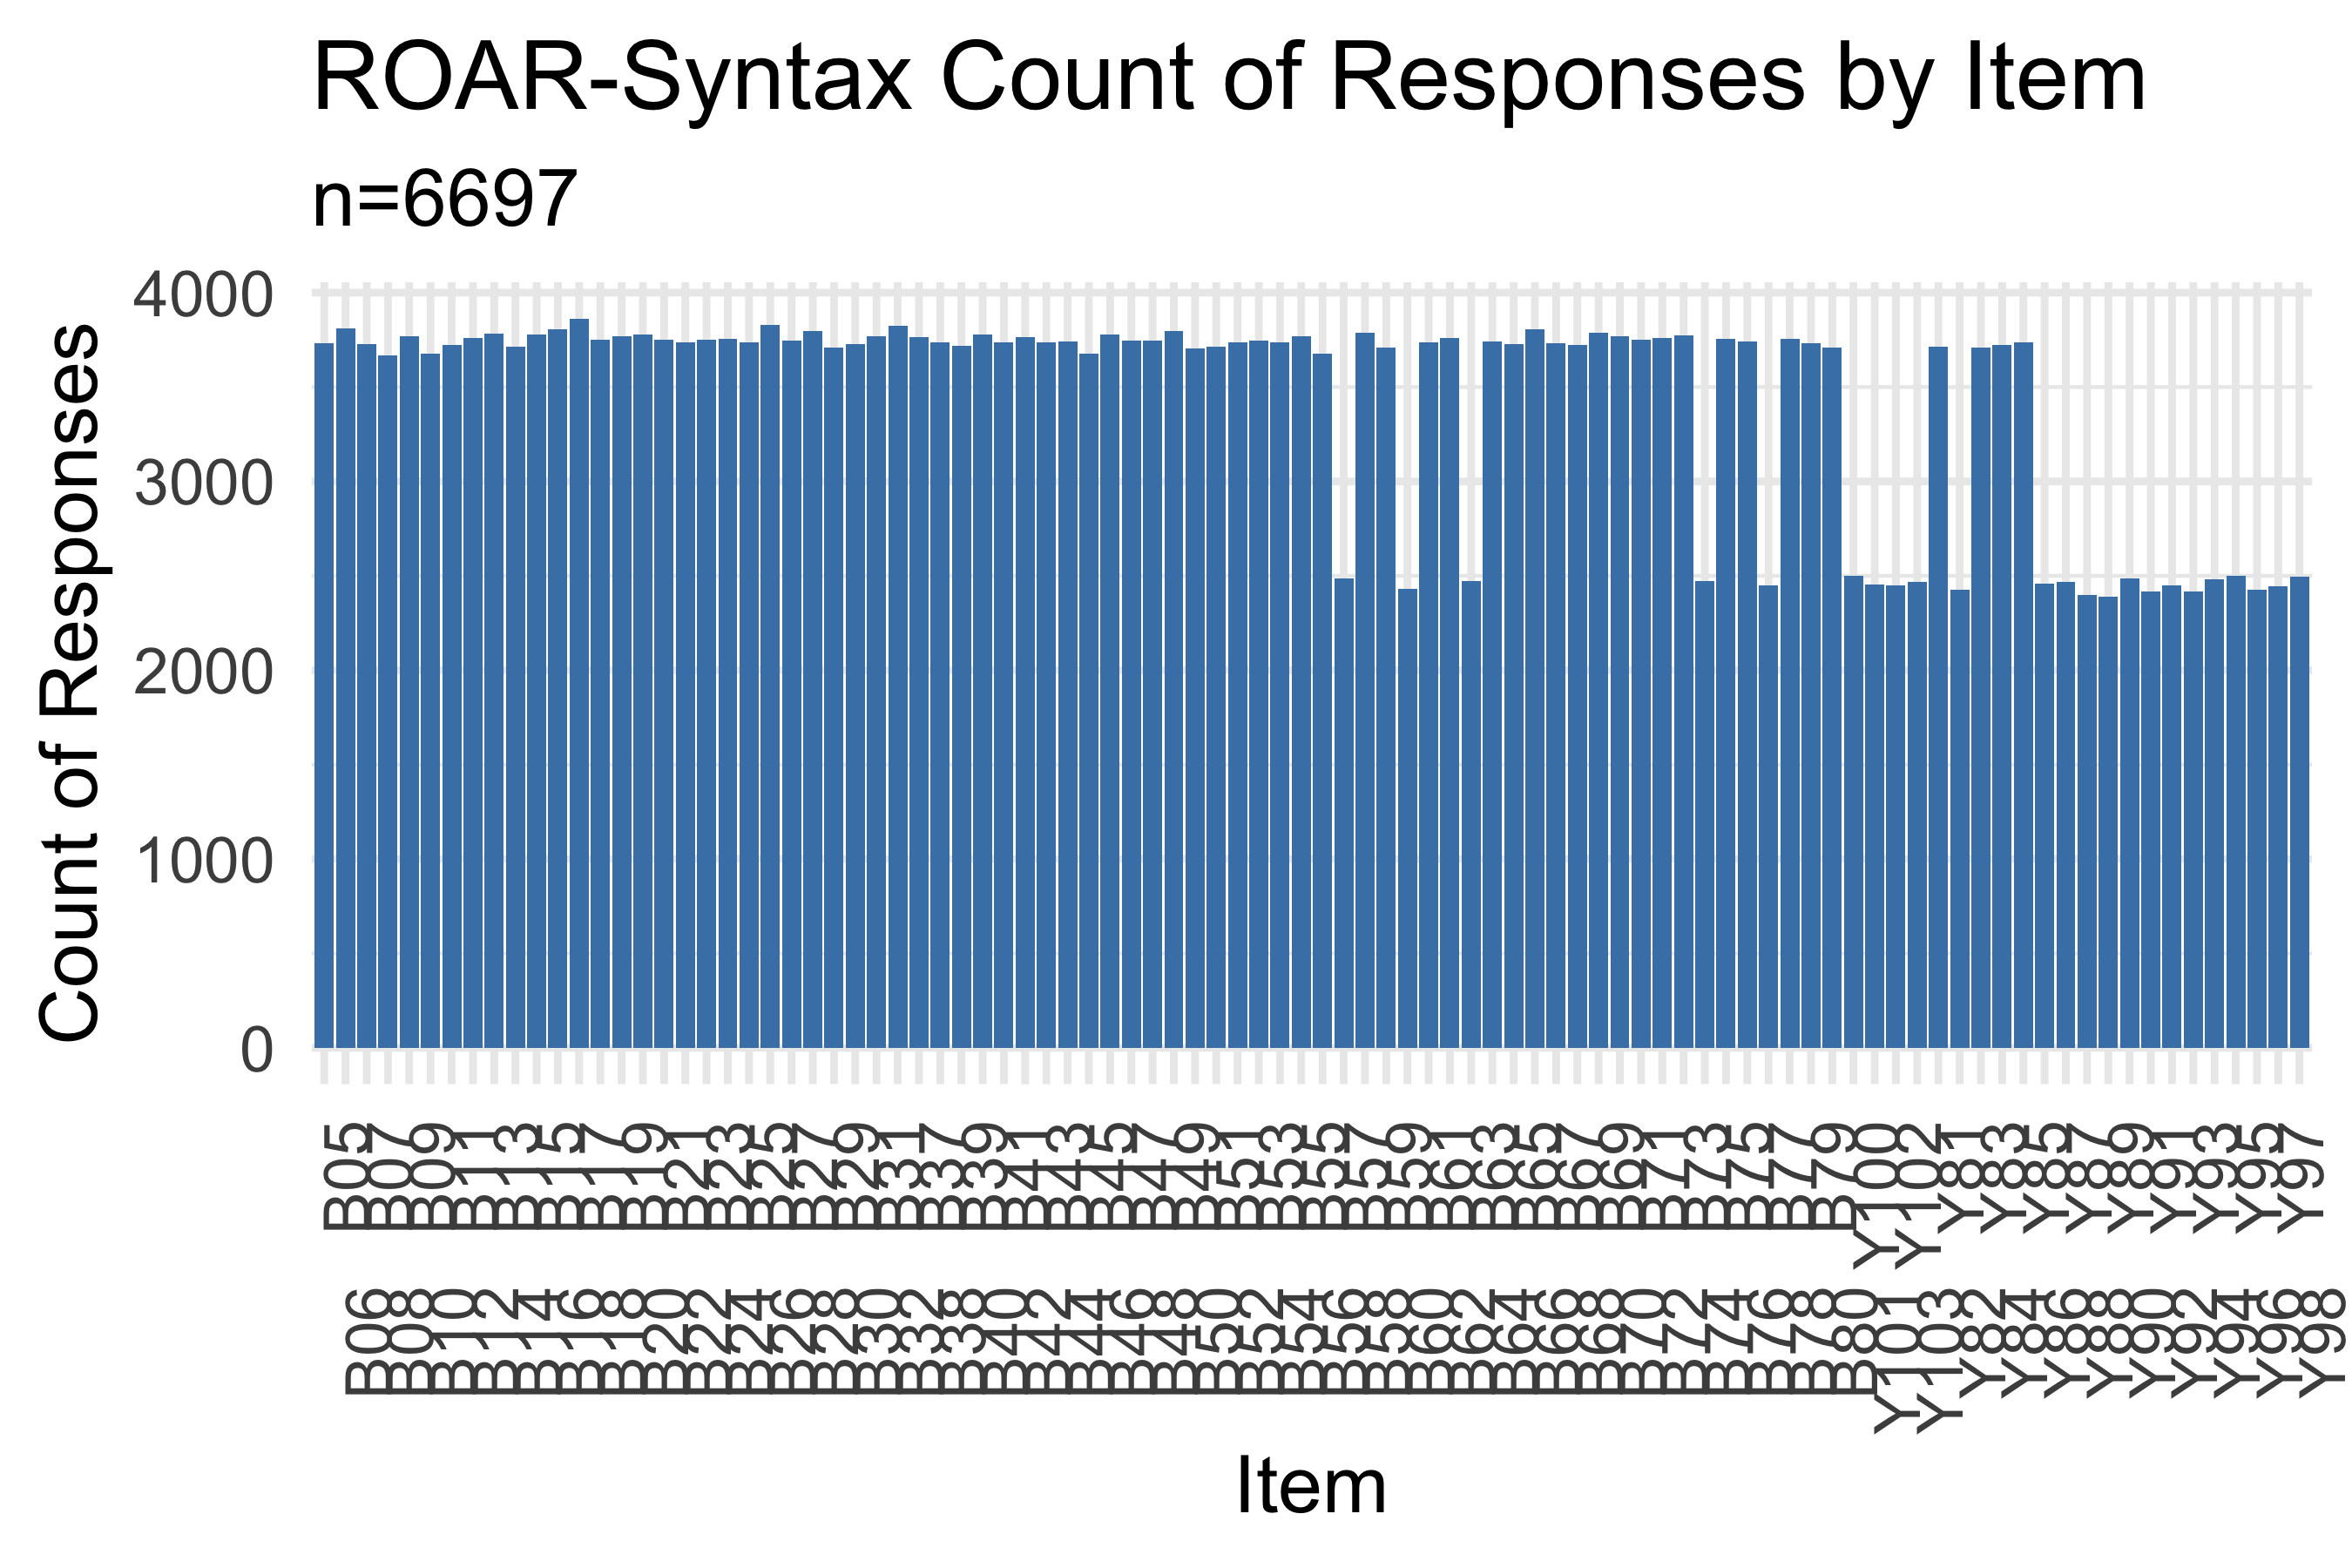
8.3.0.6 Trials Per Item
Figure 8.7 displays the number of trials collected for each item. Most items accumulated 2,000-2,500 responses. For five items, illustrations were revised during the calibration study to make them accessible to color-blind individuals. Trials with the old images were excluded from the analysis and trials with the new images were retained. Items Y91-Y103, added for the calibration study, show substantially fewer responses as expected, but sufficient data were collected to obtain difficulty estimates.
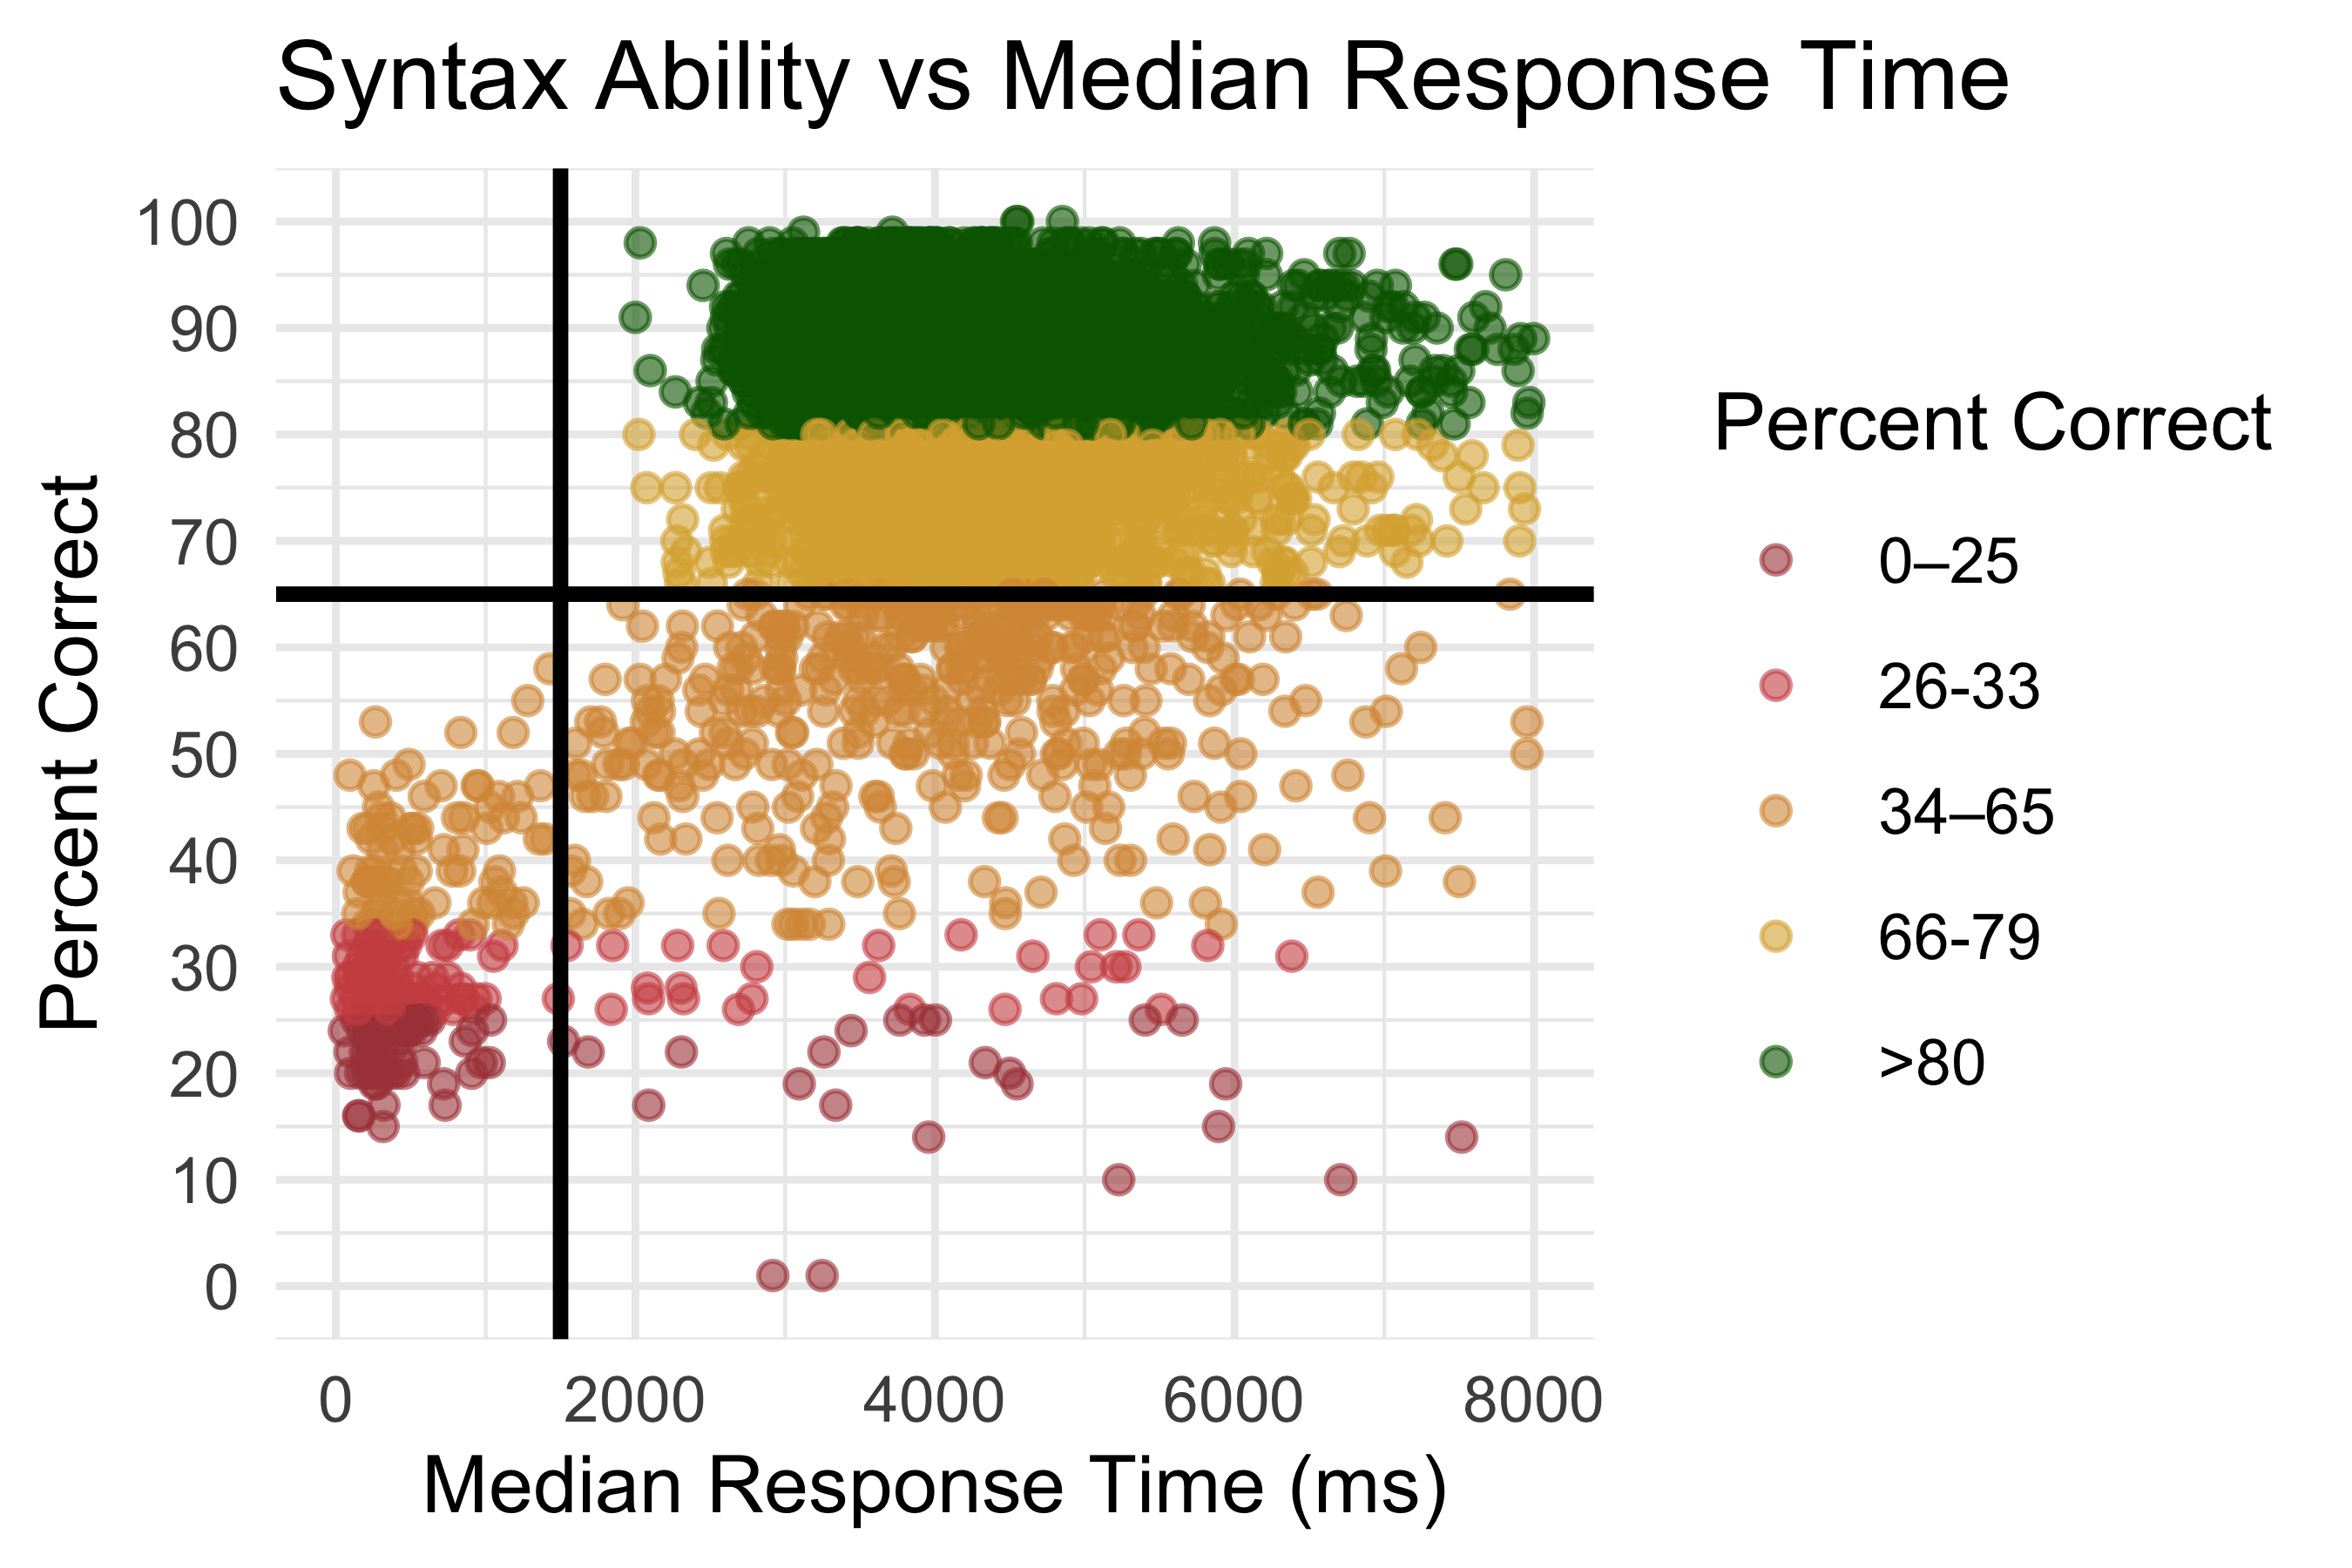
8.3.0.7 Disengaged Responding
Automated assessment systems require careful monitoring for disengaged responding, where students guess randomly or respond without genuine effort. We used two indicators to identify potentially disengaged students: median response time and accuracy. Figure 8.8 shows the relationship between median response time (in milliseconds) and percent correct for each student.
Students with very rapid response times (median <1,500 ms) showed no accuracy on the assessment, consistently performing at or below chance level. These students were flagged as potentially disengaged. In score reports provided to educators and researchers, students with both low accuracy (<65 percent correct on attempted items, consistent with flagging criteria for other ROAR measures) and rapid response times (<1,500 ms median) are flagged as possibly disengaged, indicating that educators should consider these results cautiously in relation to other data sources.
8.3.1 Reliability
8.3.1.1 Overall Reliability
Reliability (\(\rho_{xx^\prime}\)) is computed based on the estimated variance of student ability (\(\hat{\theta}\)) relative to the estimated standard error (\(\widehat{SE}(\hat{\theta})^2\)) using Equation 8.1
\[ \hat{\rho}_{xx^\prime} = \frac{\widehat{VAR}(\hat{\theta})}{\widehat{VAR}(\hat{\theta}) + \widehat{SE}(\hat{\theta})^2}, \tag{8.1}\]
Person separation reliability was 0.85 , while marginal reliability was 0.86. This reliability coefficient exceeds the 0.80 threshold commonly applied to educational assessments, demonstrating that ROAR-Syntax provides reliable differentiation among students’ syntactic knowledge.
8.3.1.2 Reliability by Number of Items Attempted
Because students completed varying numbers of items due to time constraints, we examined reliability as a function of test length. Table 8.3 shows empirical reliability estimates by the number of items students attempted, providing practical guidance on how many items are needed to achieve acceptable reliability.
| num_items | reliability | n | mean_SE2 | var_theta |
|---|---|---|---|---|
| <20 | NA | 134 | NA | NA |
| 20-29 | 0.65 | 293 | 0.59 | 1.68 |
| 30-39 | 0.67 | 930 | 0.45 | 1.35 |
| 40-49 | 0.72 | 1763 | 0.39 | 1.36 |
| 50-59 | 0.74 | 1793 | 0.35 | 1.32 |
| 60-69 | 0.77 | 932 | 0.30 | 1.32 |
| 70-79 | 0.92 | 343 | 0.24 | 3.20 |
| 80-89 | 0.94 | 304 | 0.26 | 4.11 |
| 90-99 | 0.77 | 205 | 0.22 | 0.96 |
As expected, reliability increases with the number of items attempted. Students who attempted 40-49 items achieved reliability of 0.72, students who attempted 50-59 items achieved reliability of 0.74, and those who attempted 60-69 items achieved reliability of 0.78. The highest reliabilities (0.92 - 0.94) were observed for students who attempted 70-89 items, indicating very precise ability estimates with this test length. The slightly lower reliability (0.77) for students attempting 90-95 items (n=205) may be caused by disengaged students who quickly answered items without consideration. Since most items are below the average ability of students, computer adaptive testing will dramatically increase the efficiency of the assessment.
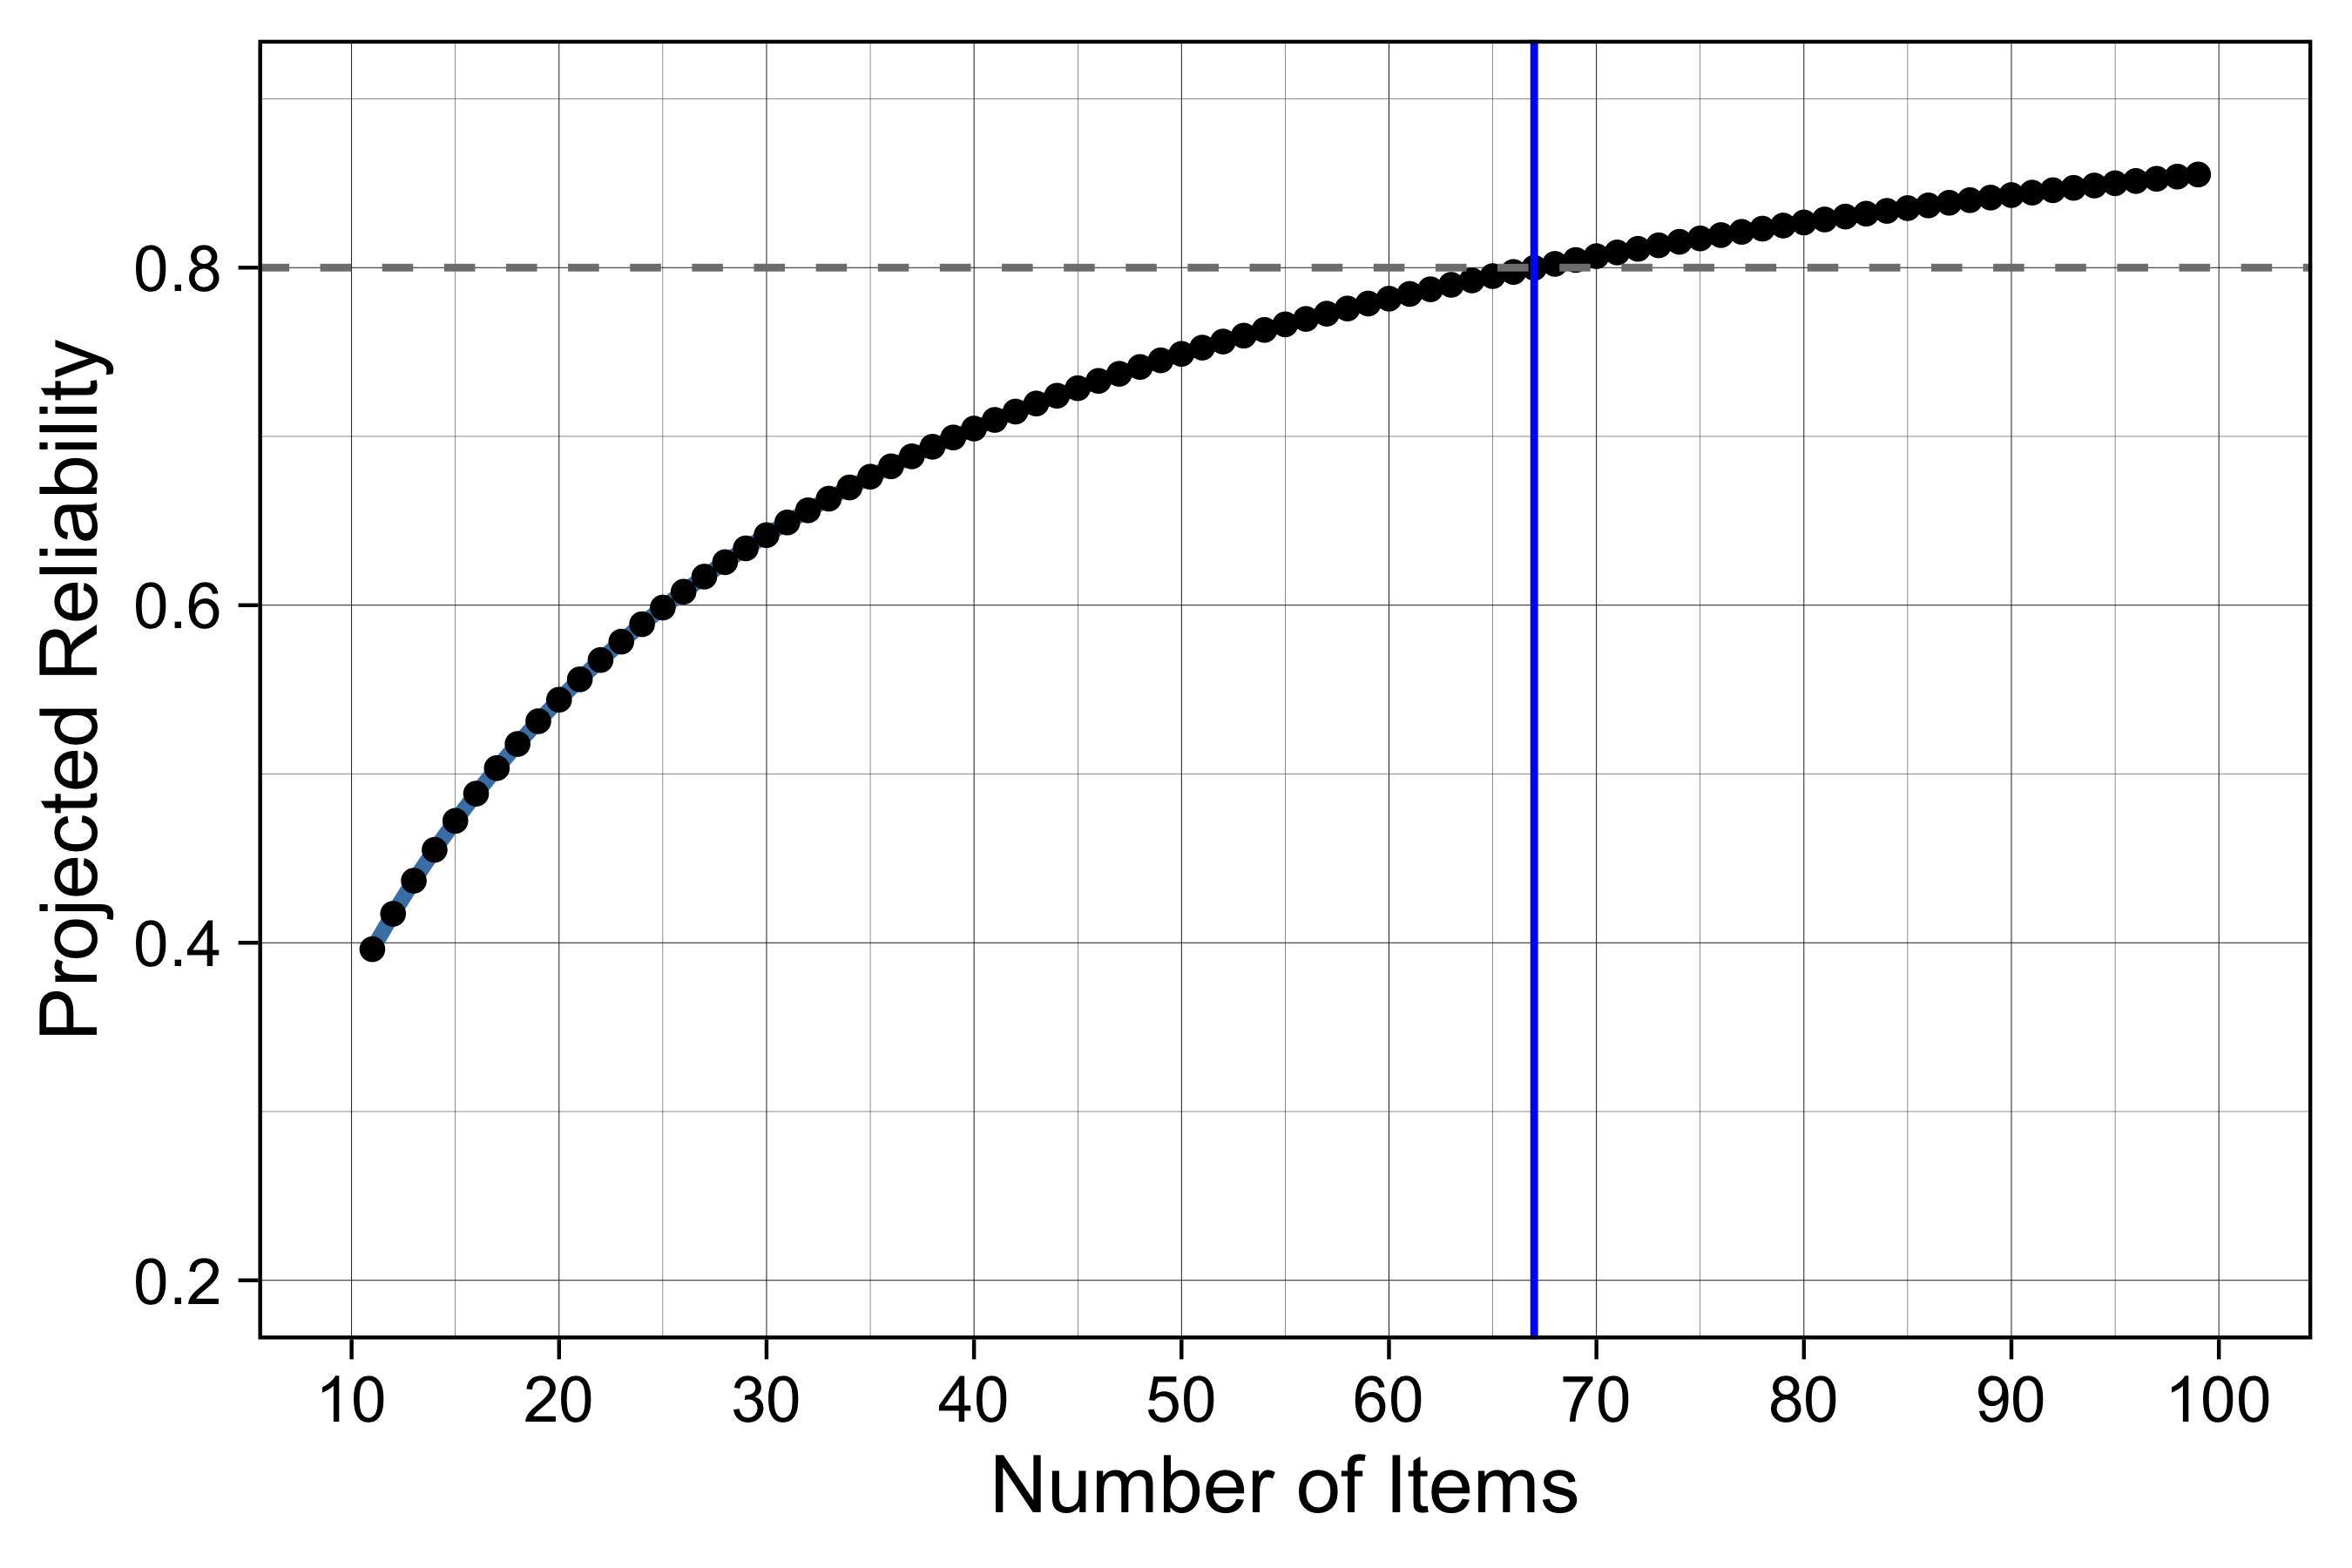
To guide future test design, we applied the Spearman-Brown formula to project the relationship between test length and reliability (Figure 13.1). Based on the current item parameters, a fixed-form assessment would require approximately 67 of 95 items to maintain a reliability of 0.80. However, because computer adaptive testing (CAT) strategically selects items that maximize information for each student’s specific ability level, we anticipate achieving this 0.80 reliability threshold with significantly fewer items than the fixed-form projection suggests.
8.3.2 Validity
8.3.2.1 Internal Validity
Internal validity refers to the degree to which evidence supports the coherence and structure of a measure as aligned with its underlying theoretical framework. For ROAR-Syntax, we examined the internal structure—whether items organize into patterns consistent with our theoretical model of the development of syntactical knowledge.
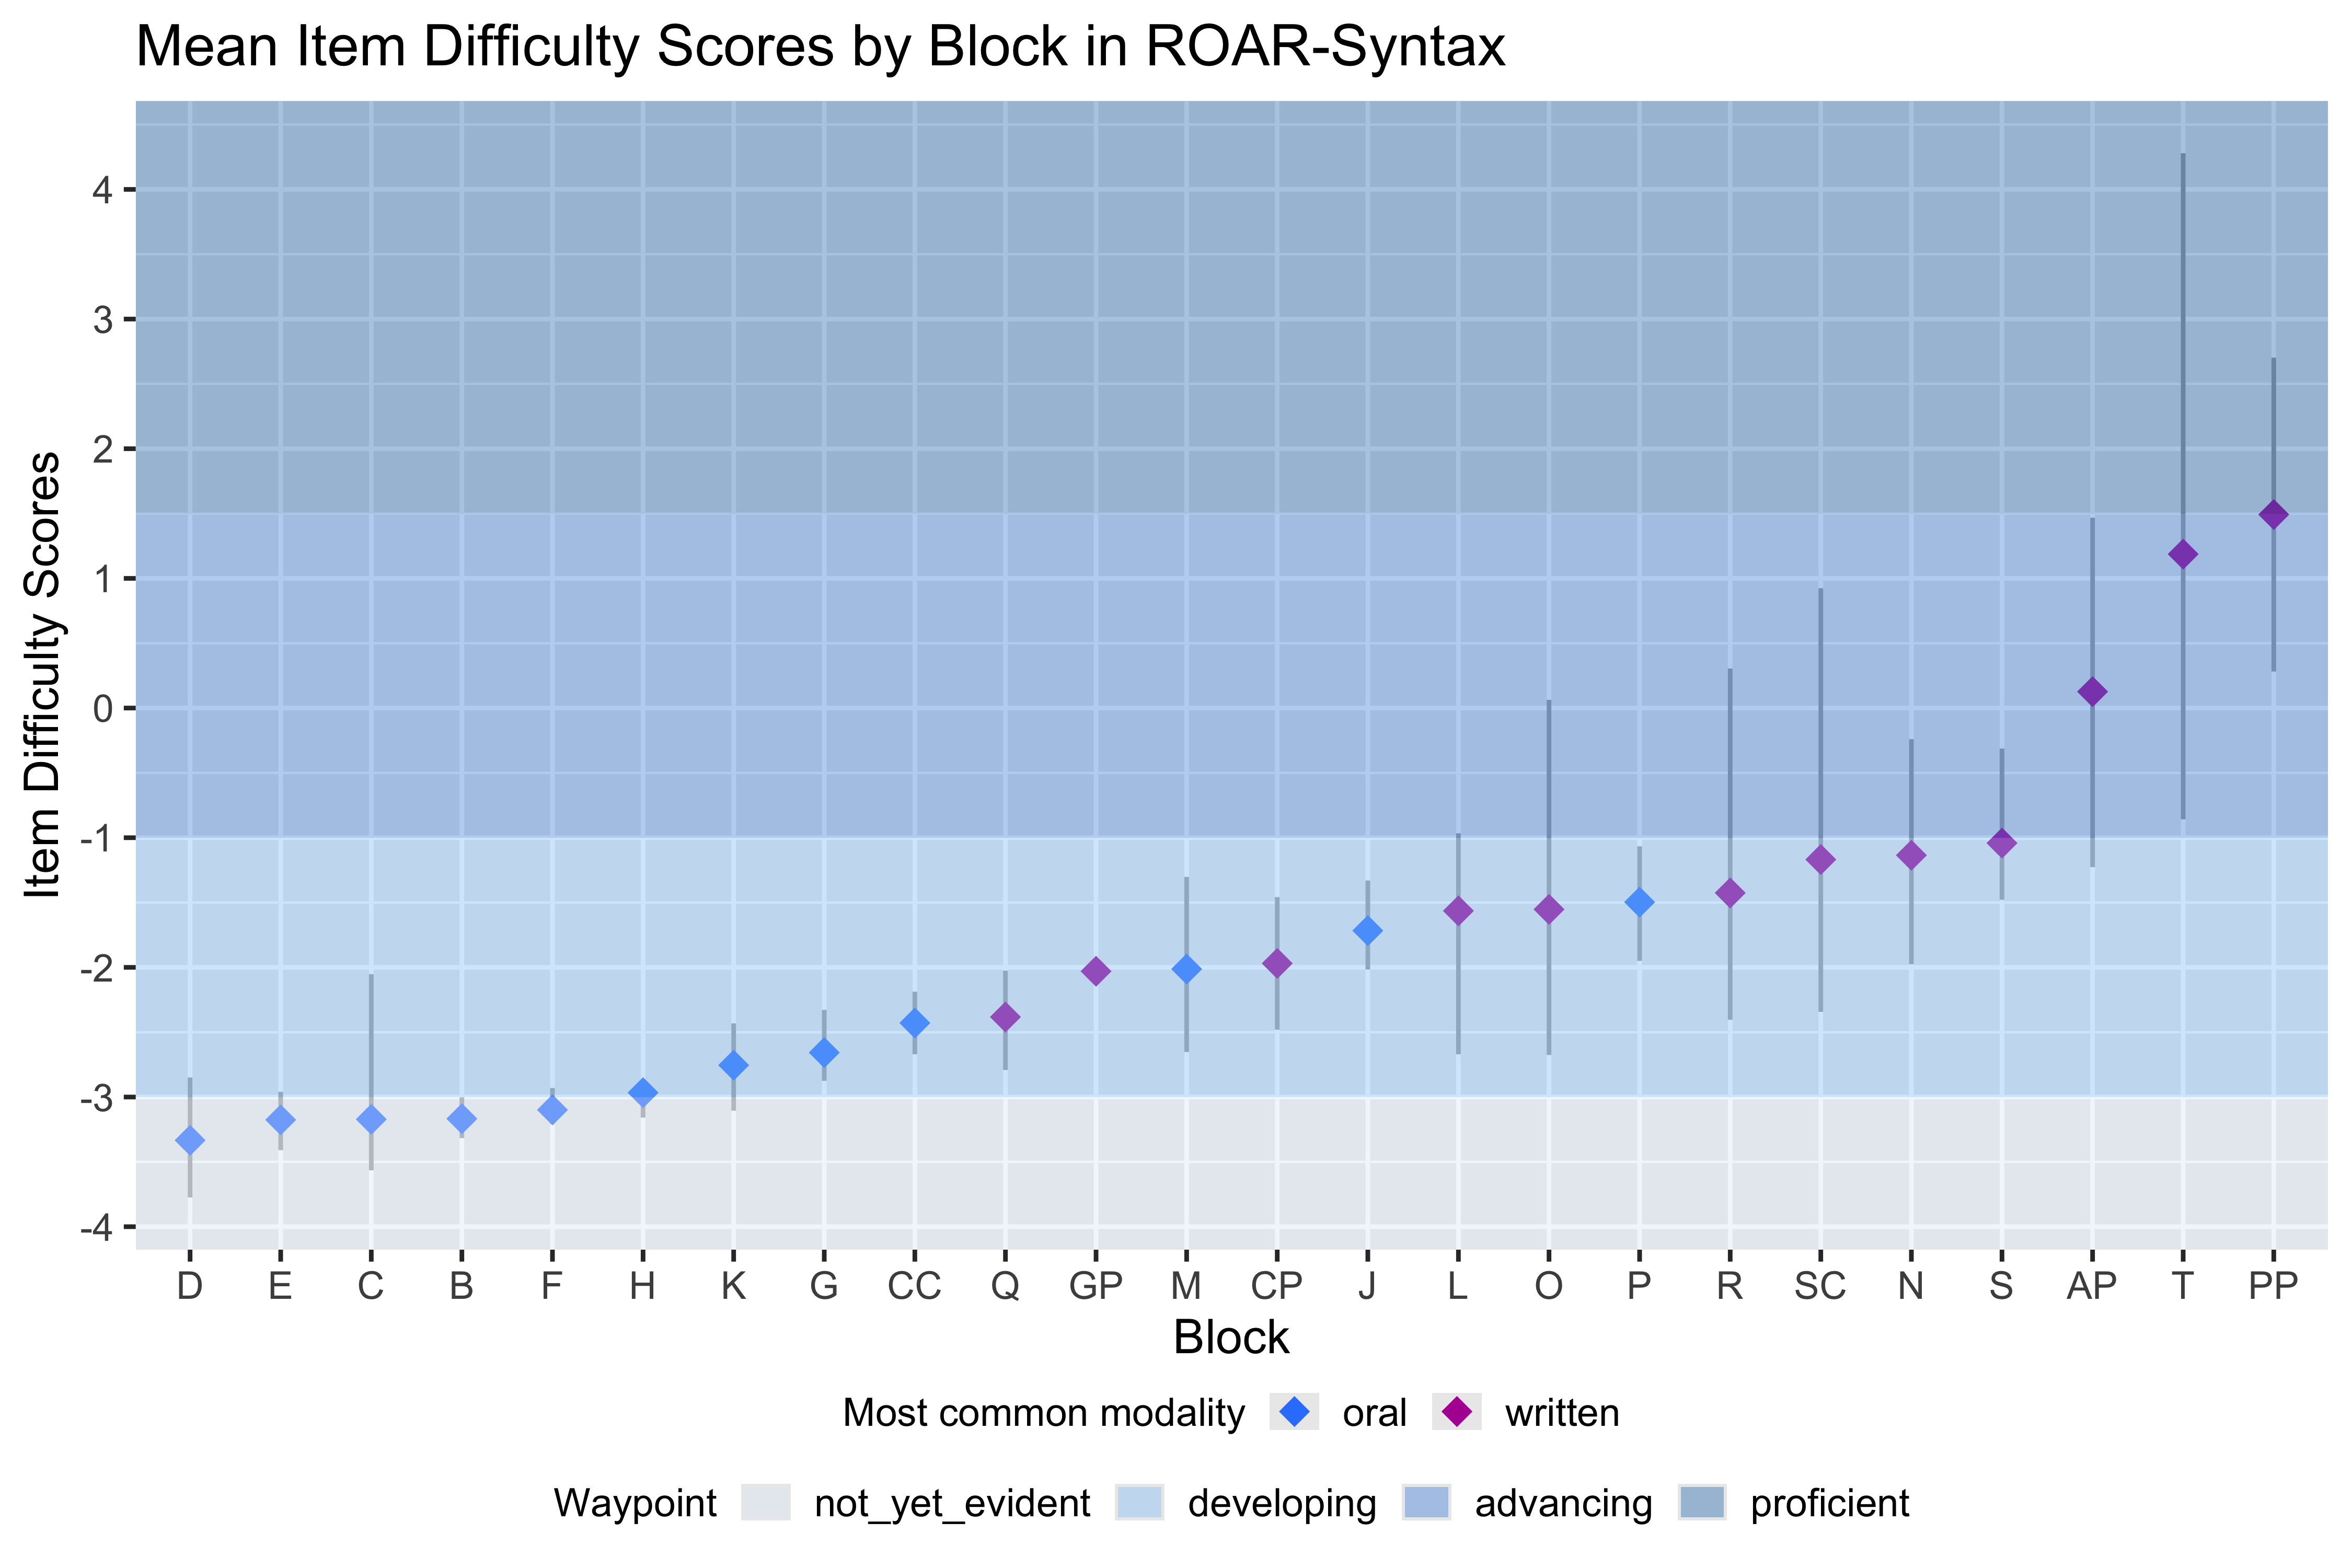
The progression of item difficulties across TROG blocks (Figure 8.10), demonstrates that the assessment captures meaningful developmental differences in syntactic knowledge. The theoretical construct map, which organizes syntactic structures by complexity and developmental sequence, is supported by the empirical difficulty ordering.
The item difficulties result in the following values for the waypoints:
Waypoint 0 (Not Yet Evident): Below -3.0 logits - The student does not yet demonstrate comprehension of syntactic structures in English.
Waypoint 1 (Developing): -3.0 to -1 logits - The student demonstrates understanding of some syntactic structures that are common in spoken English, and is beginning to understand structures found mainly in academic texts.
Waypoint 2 (Advancing): -1 to 1.5 logits - The student demonstrates understanding of most syntactic structures that are common in spoken English, and is developing understanding of structures found mainly in academic texts.
Waypoint 3 (Proficient): Above 1.5 logits - The student demonstrates understanding of most syntactic structures in this assessment, including those found mainly in academic texts.