| Characteristic | N = 8321 |
|---|---|
| grade | |
| 3 | 303 (36%) |
| 4 | 460 (55%) |
| 5 | 69 (8.3%) |
| gender | |
| Female | 343 (52%) |
| Male | 316 (48%) |
| Unknown | 173 |
| race.r | |
| Asian | 237 (38%) |
| Black/African American | 7 (1.1%) |
| Hispanic/Latinx | 82 (13%) |
| Other/Multiracial | 159 (25%) |
| White | 144 (23%) |
| Unknown | 203 |
| age | |
| Mean (SD) | 9.83 (1.10) |
| Min, Max | 7.96, 12.27 |
| 1 n (%) | |
9 ROAR-Syntax External Validity
9.1 External Validity
External validity refers to the degree to which an assessment’s results generalize to relevant external criteria or contexts beyond the measure itself. To establish external validity of ROAR-Syntax, researchers analyzed a subsample of 920 students to determine correlations between the IRT ability estimates and a statewide standardized assessment (SBAC-ELA). Researchers also examined whether adding syntax ability to an existing model of word reading and sentence efficiency improves the ability of the model to predict reading comprehension on the statewide test.
9.1.1 Concurrent Validity
Participants
One ROAR partner school district and three school districts from a concurrent intervention study in California shared state test data (CAASPP/SBAC_ELA) for 920 students in grades 3-5. (1st and 2nd grade students do not take the SBAC and so were not included in this analysis. State test data was not available for secondary students.) 62 students who were missing any of the four measures (i.e. ROAR-Syntax, ROAR-Word, ROAR-Sentence, and SBAC-ELA) were excluded from the analysis. 26 disengaged students were also excluded, reducing the final sample to 832. Demographics for these students are shown in Table 9.1.
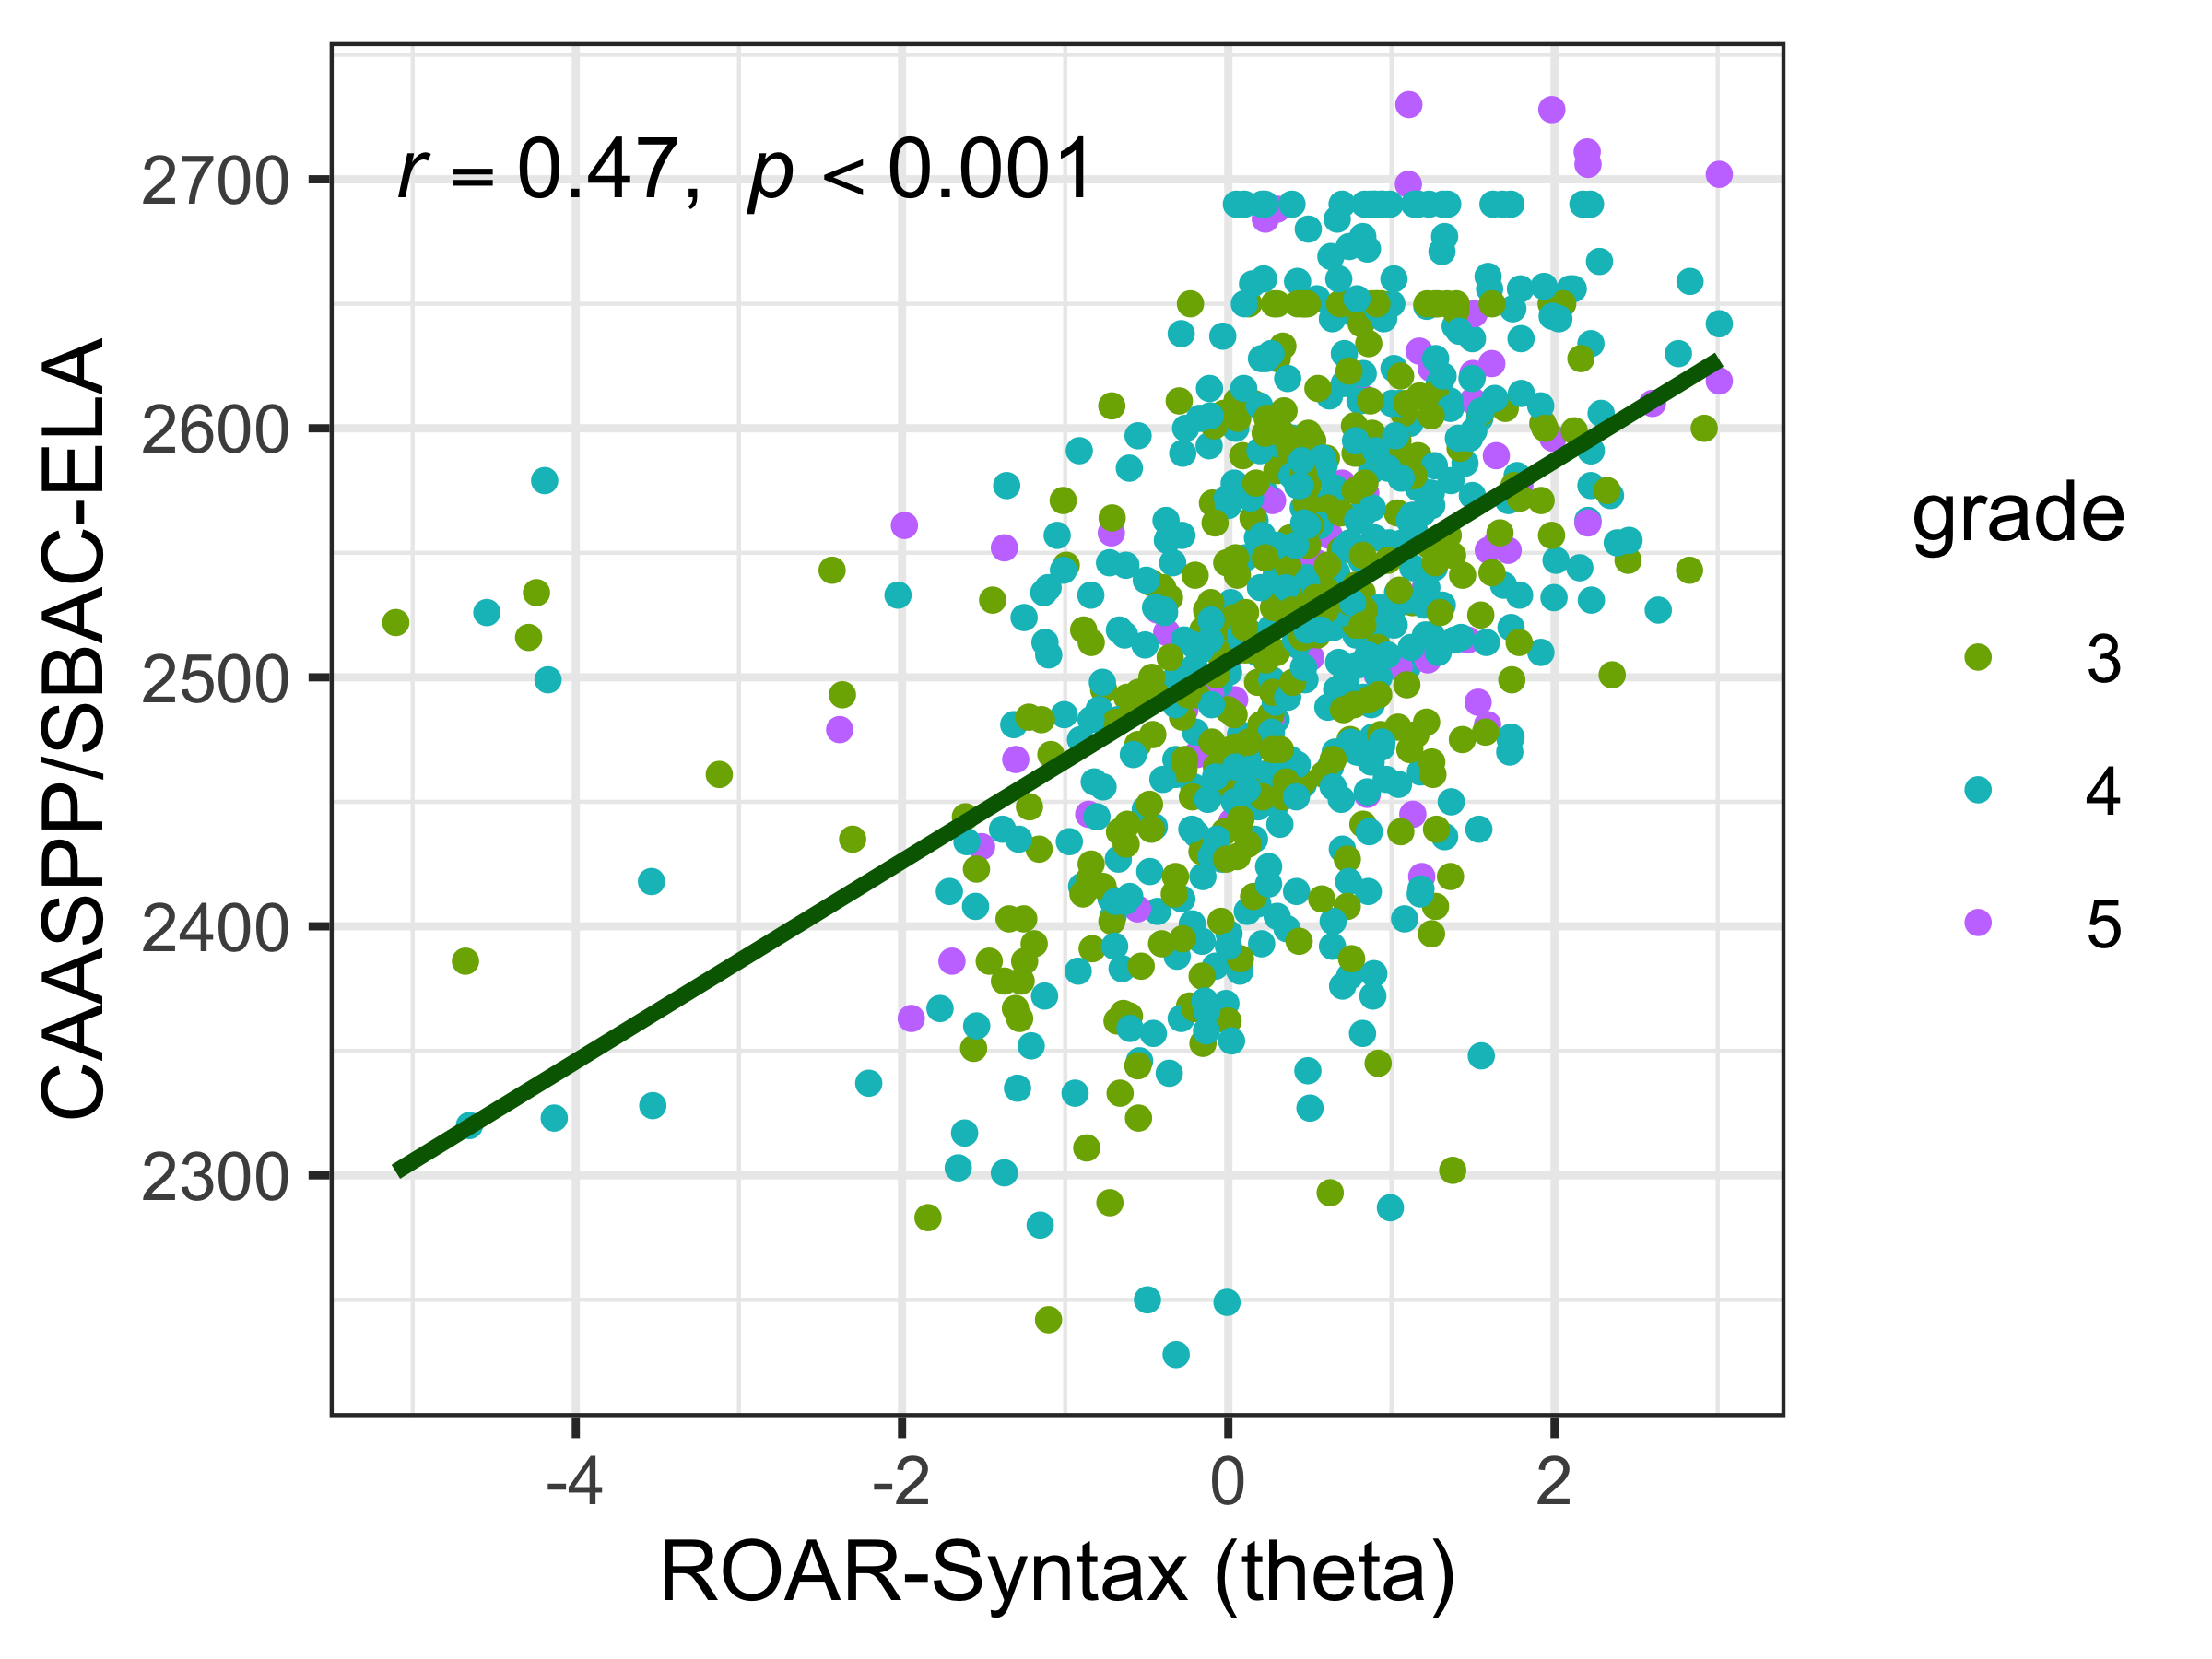
Figure 9.1 shows the relationship between ROAR-Syntax (in logits), on the x-axis, and state test scores (CAASPP/SBAC_ELA) on the y axis. The tests are moderately correlated (r = 0.47, p < .001). This finding provides evidence for concurrent validity, demonstrating that ROAR-Syntax measures skills that are meaningfully related to broader reading achievement as assessed by the state standardized test.
9.1.2 Predicting Reading Comprehension
Analysis Procedure
We examined whether including ROAR-Syntax improves the ability of the ROAR suite to predict state test scores by constructing three standard linear regression models (Cohen et al. 2013) and comparing the results. Components of reading ability were measured using three assessments, ROAR-Word, ROAR-Sentence, and ROAR-Syntax. These tasks measure single word recognition, sentence reading efficiency, and syntactic knowledge, respectively (Yeatman et al. 2021; Yeatman et al. 2024). The reading comprehension outcome was measured using state test scores (CAASPP/SBAC-ELA) provided by the school districts.
The models are:
- Word only:
\({comp}_i = β_0 + β_1 {word}_i + {grade}_i + {e}_i\) - Word and Sentence:
\({comp}_i = β_0 + β_1 {word}_i + β_2 {sent}_i + {grade}_i + {e}_i\) - Word, Sentence, and Syntax:\({comp}_i = β_0 + β_1{word}_i + β_2{sent}_i + β_3{syntax}_i + {grade}_i + {e}_i\)
Where \({comp}_i\) represents the CAASPP/SBAC_ELA score for an individual student, \({grade}_i\) is the student’s grade at the time of the assessment, \(\text{word}_i\) is the student’s ROAR-Word score, \(\text{sent}_i\) is the ROAR-Sentence score, and \(\text{syntax}_i\) is the ROAR-Syntax score. Parameter \(β_0\) is the expected reading comprehension score for a 3rd grade student who has the lowest possible score on all three ROAR assessments, \(β_1\) is the contribution of single word recognition to reading comprehension, \(β_2\) is the contribution of sentence reading efficiency, \(β_3\) is the contribution of syntactic knowledge, and \(\text{e}_i\) are residual unexplained differences that are assumed to be independent and normally distributed.
ROAR-Word and ROAR-Syntax scores are \(\theta\) values from their respective unidimensional Item Response Theory models (Rasch 1993), where \(\theta = 0\) represents the mean of the latent ability distribution. The ROAR-Sentence score represents the number of correct minus incorrect responses in a three minute time limit. Grade 3 was used as the reference category. Significance of parameters was evaluated at \(\alpha = .05\) The models were estimated in R using the lm function and were compared using the anova function from the stats package (R Core Team 2024).
Results
Table 9.2 shows the correlations between each of the ROAR measures and the state test. ROAR-Word is strongly correlated with the CAASPP/SBAC-ELA (r = 0.59, p < .001), as is ROAR-Sentence (r = 0.63, p < .001). ROAR-Syntax is moderately correlated with the CAASPP/SBAC-ELA (r = 0.47, p < .001), and with ROAR-Word (r = 0.4, p < .001) and ROAR-Sentence (r = 0.38, p < .001).
| word | sentence | syntax | |
|---|---|---|---|
| sentence | 0.63*** | ||
| syntax | 0.40*** | 0.38*** | |
| comp | 0.59*** | 0.63*** | 0.47*** |
| Note: | |||
| * p < .05, ** p < .01, *** p < .001 |
Correlation between ROAR measures and CAASPP/SBAC-ELA
Table 9.3 compares model fit statistics for the three models, which were all significant (p < .001). The scores from ROAR-Word alone predict 35% of the variance in scores on the CAASPP/SBAC-ELA (F(2,829) = 223,<0.001). Adding ROAR-Sentence scores to the model significantly improves the prediction to 46% of the variance (F(3,828) = 234,<0.001). Adding ROAR-Syntax to the model significantly improves the prediction by an additional 4%, bringing the total explained variance to 50% (F(4,827) = 205,<0.001).
The model with all three ROAR assessments exhibited lower AIC and BIC values and a higher log-likelihood than the models without ROAR-Syntax. This pattern of results indicates that adding ROAR-Syntax improved overall model fit. Together, the improvement in model fit statistics and predictive ability demonstrate that inclusion of ROAR-Syntax in the model enhances the ability of the ROAR suite to predict state test scores.
| Model | Adjusted R² | AIC | BIC | logLik | Residual SE | df | F-statistic | p |
|---|---|---|---|---|---|---|---|---|
| Word + Grade | 0.35 | 9527.22 | 9546.11 | -4759.61 | 73.96 | F(2,829) | 222.71 | <0.001 |
| Word + Sentence + Grade | 0.46 | 9375.95 | 9399.57 | -4682.97 | 67.49 | F(3,828) | 234.12 | <0.001 |
| Word + Sentence + Syntax + Grade | 0.50 | 9315.12 | 9343.46 | -4651.56 | 65.03 | F(4,827) | 205.35 | <0.001 |
Model fit statistics with ANOVA results for three models that use ROAR measures to predict CAASPP/SBAC_ELA test scores. All models were significant (p < .001). Comparisons of AIC, BIC, and log-likelihood indicate that the model including all three ROAR assessments provided the best fit.
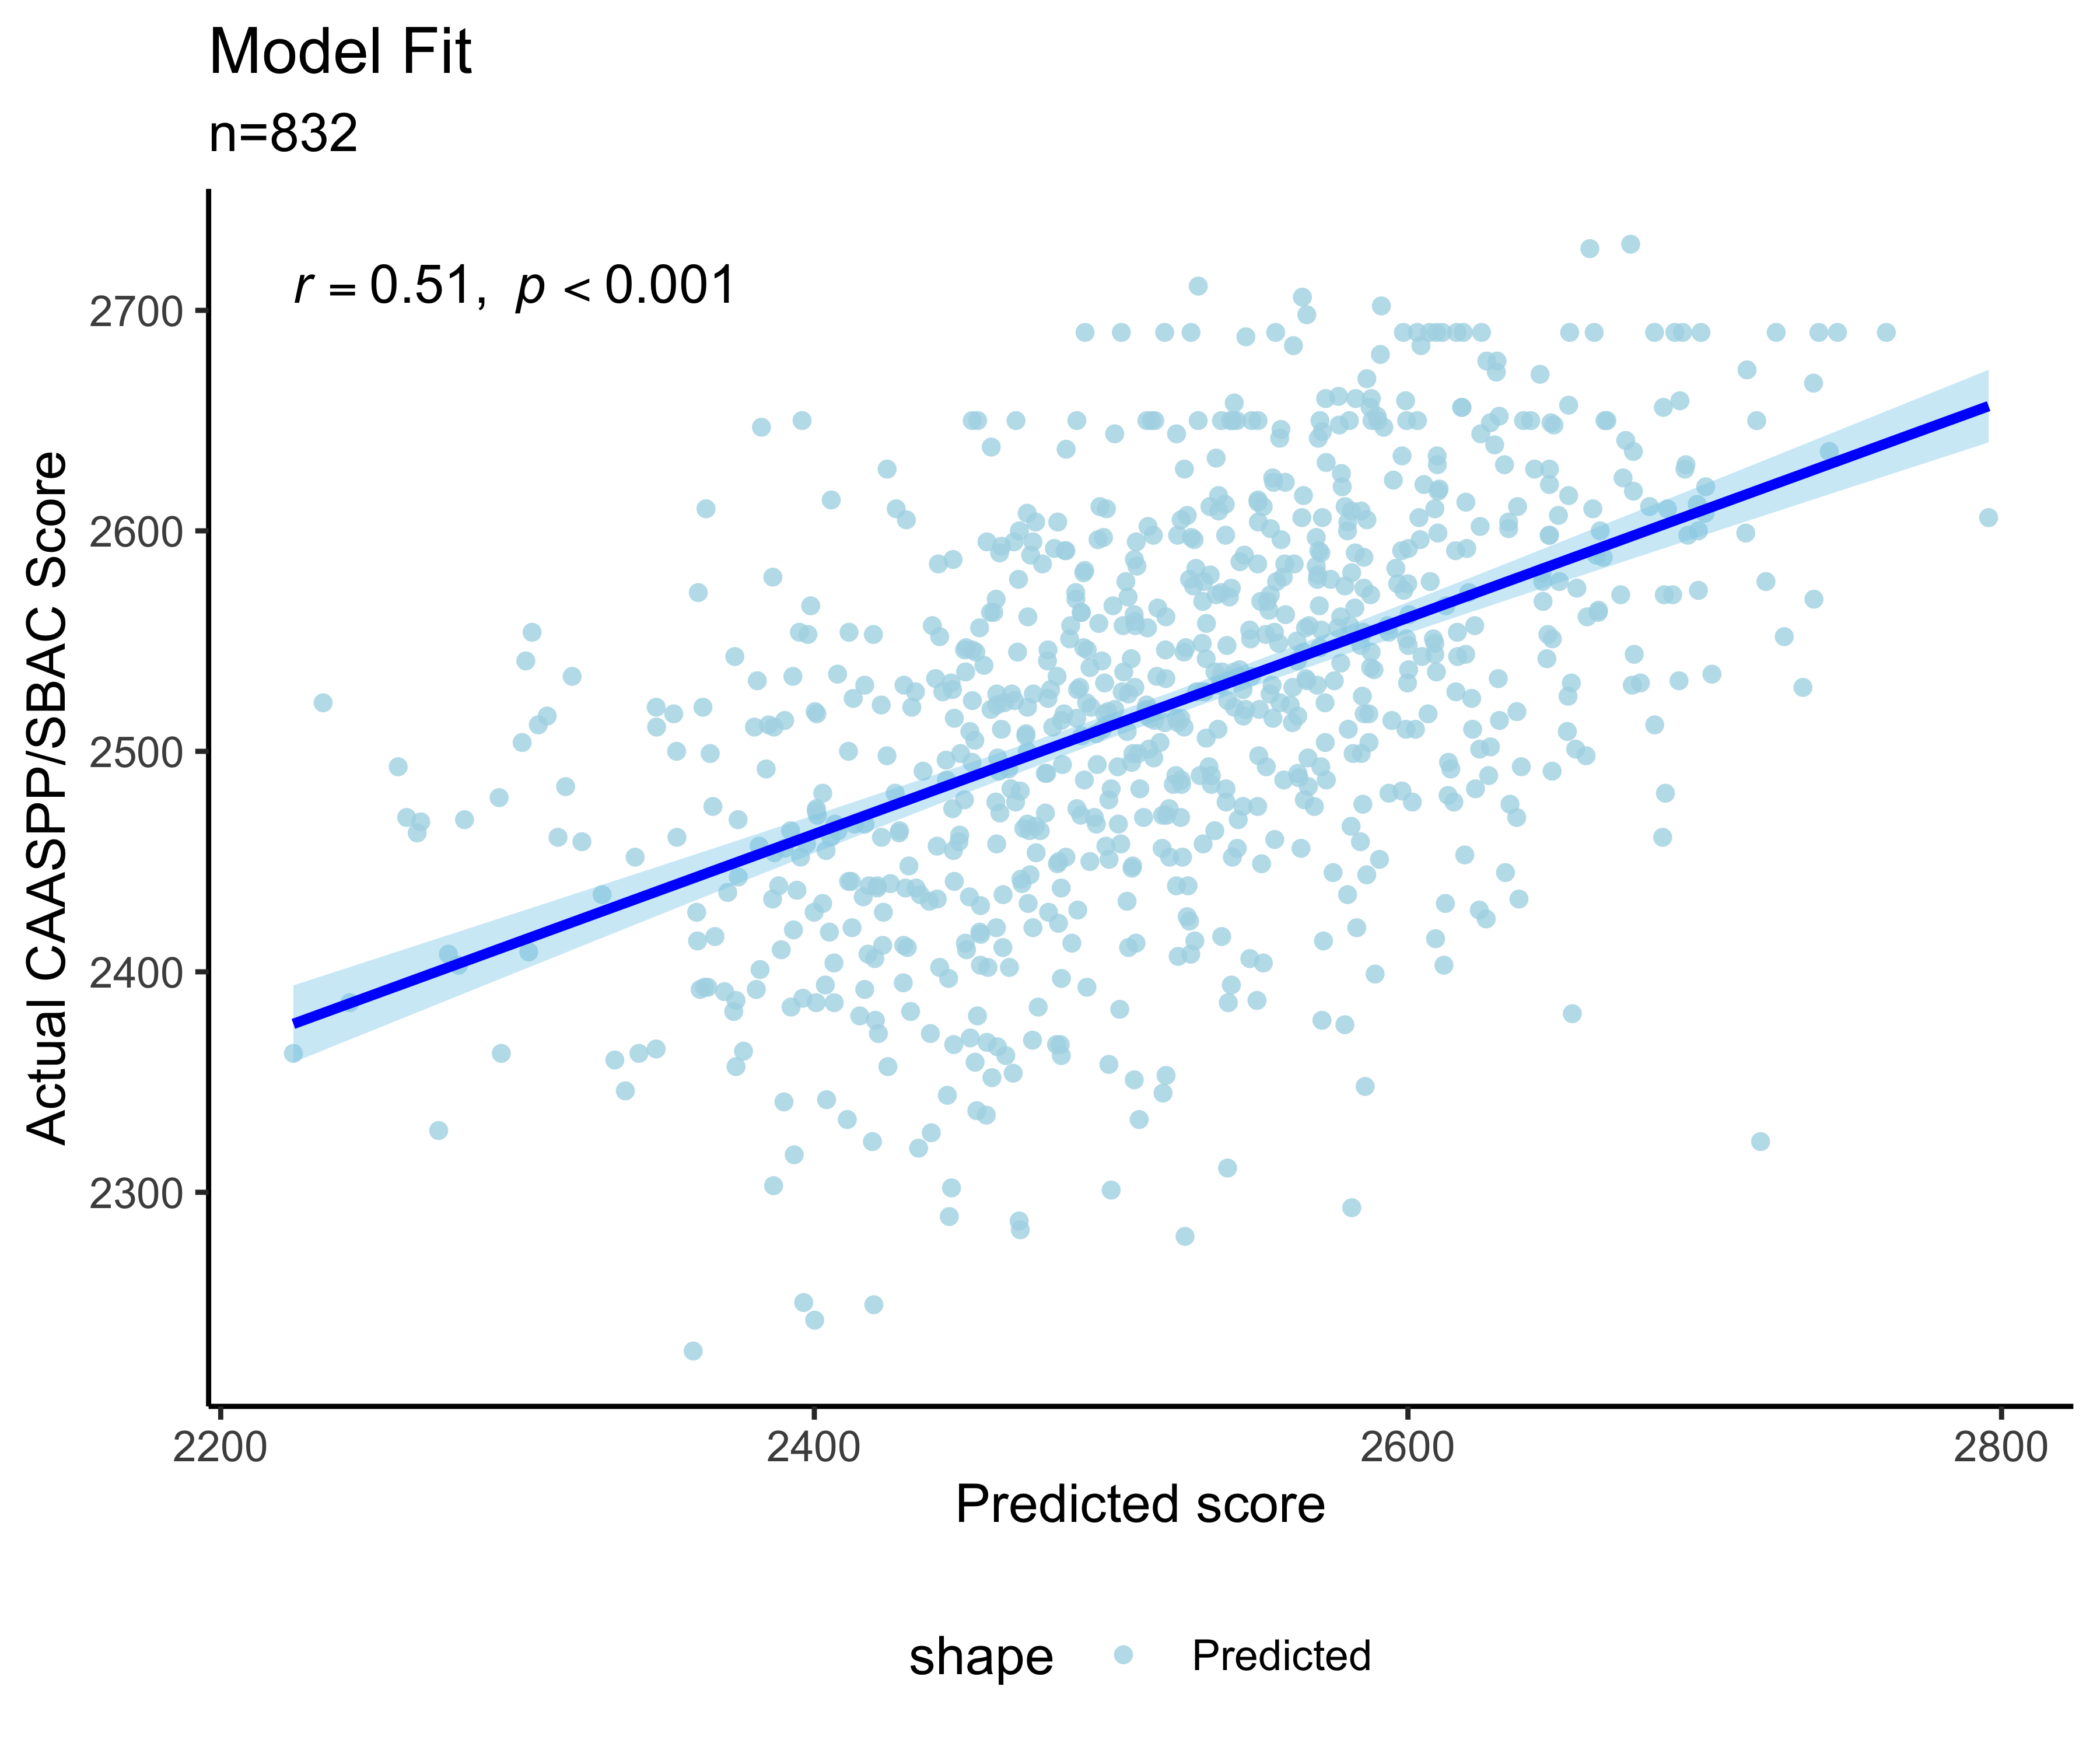
Table 9.4 shows parameter estimates for the model with the three ROAR measures. The intercept, \(β_0\) = 2400 represents the expected SBAC_ELA score for a third grade student who tests at the floor of the ROAR measures. The effect of grade was small and not significant (-2.9, p = .44). State test scores increased by \(β_1\) = 15.5 points (p < .001) for each logit increase in ROAR_Word score, by \(β_2\) = 1.9 points (p < .001) for each 1 point increase in ROAR_Sentence score, and by \(β_3\) = 18.9 (p < .001) for each logit increase in ROAR_Syntax score. The regression line in Figure 9.2 shows the correlation (r = 0.51, p < .001) between the model’s predictions and the actual CAASPP/SBAC_ELA scores.
| term | Estimate (SE) | p |
|---|---|---|
| (Intercept) | 2400 (7.6) | |
| word_reading | 15.5 (1.9) | <0.001 |
| sentence_efficiency | 1.9 (0.2) | <0.001 |
| syntax_ability | 18.9 (2.3) | <0.001 |
| grade | -2.9 (3.8) | 0.4404 |
Model parameters for the Word, Sentence, and Syntax model.
9.2 Fairness Analysis
To evaluate the fairness and measurement invariance of the ROAR-Syntax assessment, a Differential Item Functioning (DIF) analysis was conducted to identify items that may function differently for students of equal ability based on gender and race. Separate Rasch models were fitted for each group using the mirt (Chalmers 2025) and robustDIF (Halpin 2024) packages to extract group-specific item difficulty parameters (intercepts) while minimizing the influence of outlier items that might otherwise skew the overall scale.
Following standard psychometric practice, the observed logit differences between groups were then converted to the Educational Testing Service (ETS) Delta scale using a constant of 2.35. Items were then classified into three categories based on the magnitude of the effect: Category A (Negligible), Category B (Moderate), and Category C (Large) (Zwick, Thayer, and Lewis 1999). This categorization allows for a prioritized review of items where secondary dimensions—such as context-specific vocabulary or cultural associations—may interact with gender independently of the primary trait being measured.
9.3 Gender DIF
First, we conducted DIF analysis for gender. See Table 9.5 for the number of students who took ROAR-Syntax by gender. We used female as the reference group and male as the focal group. We used a subsample of 3,683 students in grades 1-12 whose gender identification was available from the administrative records. There were 1,849 females and 1,833 males in this subsample (50.2% female).
| gender | n | percentage |
|---|---|---|
| Female | 1849 | 50.22 |
| Male | 1833 | 49.78 |
Out of 94 items, 33 had negligible DIF, 24 had moderate DIF, and 37 had large DIF. Table 9.6 presents the items that showed large (Category C) DIF. All items flagged for large DIF were harder for males except for one item (The duck following the turtle is walking across the bridge.). These items were flagged for content review for potential revision to ensure continued test equity and validity. Future steps will be taken to look more closely at the items that demonstrated large DIF to identify potential sources of bias, such as context-specific vocabulary that may be more familiar to one gender over another.
| Item | ETS Cat | Logit Diff | Harder For | Female Difficulty | Male Difficulty | RobustDIF Weight |
|---|---|---|---|---|---|---|
| She is the gardener who wears the hat that has a flower. | C | 1.17 | male | 1.49 | 0.33 | 0.000 |
| the boy is not running | C | 1.14 | male | 3.57 | 2.43 | 0.000 |
| eating | C | 1.10 | male | 3.88 | 2.79 | 0.015 |
| the dog is not sitting | C | 1.04 | male | 3.67 | 2.63 | 0.101 |
| the man is eating the apple | C | 1.02 | male | 3.81 | 2.79 | 0.170 |
| the dog is not drinking | C | 0.99 | male | 4.03 | 3.04 | 0.317 |
| the boy stands on the chairs | C | 0.94 | male | 1.82 | 0.88 | 0.065 |
| the boy is sitting but not eating | C | 0.94 | male | 3.01 | 2.07 | 0.418 |
| sitting | C | 0.89 | male | 3.88 | 2.99 | 0.585 |
| the cow is pushing the lady | C | 0.88 | male | 3.49 | 2.61 | 0.557 |
| We will have a picnic in the park if it is sunny. | C | 0.87 | male | 2.69 | 1.82 | 0.434 |
| the girl is sitting on the table | C | 0.85 | male | 3.48 | 2.63 | 0.650 |
| the dog is sitting | C | 0.85 | male | 3.80 | 2.95 | 0.700 |
| running | C | 0.84 | male | 3.48 | 2.65 | 0.697 |
| The duck following the turtle is walking across the bridge. | C | 0.83 | female | -3.28 | -2.45 | 0.000 |
| the student opened the notebook and drew a tree | C | 0.82 | male | 1.84 | 1.02 | 0.623 |
| He wore the clown's hat despite its large size. | C | 0.81 | male | 1.62 | 0.82 | 0.678 |
| the boy is chasing the sheep | C | 0.81 | male | 3.37 | 2.55 | 0.739 |
| the man is chasing the dog | C | 0.81 | male | 3.31 | 2.50 | 0.751 |
| Instead of doing homework she did a puzzle in her room. | C | 0.80 | male | 1.04 | 0.24 | 0.665 |
| the cat is big but not black | C | 0.80 | male | 2.71 | 1.91 | 0.705 |
| not only the girl but also the cat is sitting | C | 0.78 | male | 2.39 | 1.62 | 0.771 |
| the girl has not only food but also a drink | C | 0.77 | male | 3.13 | 2.37 | 0.856 |
| Although it is hot outside, I am wearing a jacket with a hood. | C | 0.77 | male | 2.72 | 1.95 | 0.873 |
| neither the boy nor the horse is running | C | 0.76 | male | 1.80 | 1.04 | 0.791 |
| the box but not the chair is red | C | 0.75 | male | 1.72 | 0.96 | 0.853 |
| long | C | 0.75 | male | 3.87 | 3.12 | 0.910 |
| the big cup | C | 0.74 | male | 3.29 | 2.55 | 0.908 |
| the cat the cow chases is black | C | 0.73 | male | -1.24 | -1.97 | 0.910 |
| the girl is chased by the horse | C | 0.72 | male | 3.04 | 2.32 | 0.940 |
| the lady is carrying the bag | C | 0.72 | male | 3.22 | 2.49 | 0.940 |
| the red ball | C | 0.72 | male | 4.08 | 3.36 | 0.959 |
| the shoe is bigger than the bird | C | 0.70 | male | 2.81 | 2.11 | 0.962 |
| red | C | 0.70 | male | 3.94 | 3.24 | 0.979 |
| black | C | 0.68 | male | 3.87 | 3.20 | 0.993 |
| the horse drank water by the barn and the sheep ate grass by the fence | C | 0.66 | male | 2.59 | 1.93 | 0.998 |
| the pencil is on the book that is yellow | C | 0.64 | male | 1.55 | 0.91 | 1.000 |
9.4 Race DIF
Next, we conducted DIF analysis for race. Due to the breakdown of the race categories in our sample, we used Non-White students as the reference group and White students as the focal group to achieve balanced subsamples. See Table 9.7 for the number of students per race category. We used a subsample of 2,455 students in grades 1-12 whose race information was available from the administrative records. There were 1,250 white students and 1,205 non-white students in this subsample (49.08% non-white).
| race | n | percentage |
|---|---|---|
| White | 1250 | 50.92 |
| Asian | 546 | 22.24 |
| Multiracial | 340 | 13.85 |
| Black/African American | 289 | 11.77 |
| Hispanic/Latinx | 20 | 0.81 |
| American Indian/Alaska Native | 8 | 0.33 |
| Native Hawaiian/Other Pacific Islander | 2 | 0.08 |
Out of 94 items, 64 had negligible DIF, 16 had moderate DIF, and 14 had large DIF. Table 9.8 presents the items that showed large (Category C) DIF. All items flagged for large DIF were harder for non-white students. These items were flagged for content review for potential revision or removal to ensure continued test equity and validity. As mentioned above for the gender DIF results, future steps will be taken to investigate the items that demonstrated large DIF to identify potential sources of bias, such as certain vocabulary or cultural associations that may be more familiar to one racial group over another, and to determine appropriate revisions to mitigate these issues while maintaining the construct validity of the assessment.
| Item | ETS Cat | Logit Diff | Harder For | Non-White Difficulty | White Difficulty | RobustDIF Weight |
|---|---|---|---|---|---|---|
| The teacher will give the students cake if they stand in a line. | C | 1.08 | non-white | 1.55 | 2.63 | 0.000 |
| The monkey neither ate the spotted banana nor swung on the vine. | C | 0.93 | non-white | 0.47 | 1.40 | 0.000 |
| We will have a picnic in the park if it is sunny. | C | 0.81 | non-white | 1.69 | 2.50 | 0.000 |
| We will dance together if there is music playing. | C | 0.80 | non-white | 0.62 | 1.42 | 0.000 |
| neither the dog nor the ball is brown | C | 0.78 | non-white | 0.60 | 1.38 | 0.000 |
| He wore the clown's hat despite its large size. | C | 0.76 | non-white | 0.80 | 1.57 | 0.000 |
| The fish swim beneath a whale and a sea turtle. | C | 0.72 | non-white | -1.84 | -1.11 | 0.001 |
| the pencil is on the book that is yellow | C | 0.71 | non-white | 1.07 | 1.78 | 0.000 |
| the girl chases the dog that is big | C | 0.70 | non-white | 2.20 | 2.90 | 0.000 |
| The car that the truck followed is driving toward the tunnel. | C | 0.70 | non-white | 0.61 | 1.32 | 0.000 |
| the girl drops the cups | C | 0.69 | non-white | 1.53 | 2.23 | 0.000 |
| Instead of doing homework she did a puzzle in her room. | C | 0.69 | non-white | 0.12 | 0.81 | 0.000 |
| the boy the dog chases is big | C | 0.67 | non-white | -4.61 | -3.95 | 0.814 |
| neither the boy nor the horse is running | C | 0.65 | non-white | 1.14 | 1.79 | 0.000 |