25 ROAR-Inference Validation Study
Overview of the Validation Approach
This validation study employed a cross-sectional design with multiple integrated components. The main calibration analysis established fundamental measurement properties and validated the proposed waypoint structure.
25.1 Methods
25.1.1 Participants
We present the demographic characteristics of the student sample included in the calibration analysis (see Table 25.1). Students were from six school districts that administered ROAR-Inference between April, 2025 to October, 2025.
Grade-level composition reflected participation across grades 1-6, with the majority of students in grades 2-5 (the primary assessment focus) totaling 98% of the sample. Though the initial goal was to develop measures for grades 2-5, additional students in grades 1 and 6 also took ROAR-Inference (note that the results should be interpreted with caution for grades 1 and 6 as the main focus of this calibration study was on grades 2-5). The table below presents the complete grade-level distribution. Gender distribution was approximately equal among students with available data, with 51% female and 49% male students. However, gender information was not available for 53% of the total sample (2,260 students).
The sample reflected substantial racial and ethnic diversity among students with available demographic data. Approximately 42% of students identified as White, 33% as Asian, 22% as Multiracial, 1.4% as Black/African American, 1.2% as American Indian/Alaska Native, and 0.3% as Native Hawaiian/Other Pacific Islander. However, race/ethnicity data was not available for 2,456 students (57% of the total sample).
Unfortunately, data on students’ ELL status, free and reduced price lunch status, and IEP status were not available for our analysis sample limiting our ability to characterize students’ language backgrounds beyond grade, gender, and race.
| Demographic characteristic | N = 4,281 |
| Grade | |
| 1 | 109 (2.5%) |
| 2 | 932 (22%) |
| 3 | 1,016 (24%) |
| 4 | 1,180 (28%) |
| 5 | 1,025 (24%) |
| 6 | 19 (0.4%) |
| Gender | |
| Female | 1,028 (51%) |
| Male | 993 (49%) |
| Missing | 2,260 |
| Race/Ethnicity | |
| American Indian/Alaska Native | 22 (1.2%) |
| Asian | 601 (33%) |
| Black/African American | 25 (1.4%) |
| Multiracial | 405 (22%) |
| Native Hawaiian/Other Pacific Islander | 6 (0.3%) |
| White | 766 (42%) |
| Missing | 2,456 |
25.1.2 Item Sample
A total of 77 items were included in the calibration analysis (Table 25.2), representing systematic variation across the three types of meaning-making relations (logical, informational, evaluative) and varying cognitive demands (text-explicit, text-implicit, script-implicit). Items were administered in randomized order to control for position effects.
| Relation | Frequency |
| evaluative | 6 |
| informational | 41 |
| logical | 30 |
| Total | 77 |
25.1.3 Study Procedure
Students completed ROAR-Inference online in classroom settings with audio instructions provided through headphones. Items were presented in randomized order, and students worked at their own pace within approximately 10 minutes.
25.1.4 Model Selection and Analysis Approach
25.1.4.1 Partial Credit Model
The Partial Credit Model (Masters 2016; Wright and Masters 1982; Boeck and Wilson 2004; Adams, Wilson, and Wang 1997) a Rasch-family model (Rasch 1960; Wilson 1992) was used to calibrate ROAR-Inference response data. The PCM was selected because item responses fell into three ordered categories representing the three levels of explanatory coherence: 0 (minimal coherence), 1 (partial coherence), and 2 (full coherence). This model estimates the difficulty of each step toward higher coherence levels and places both items and students on a common logit scale.
The partial credit model formula allows for estimation of Thurstonian thresholds within each item (the point where students have a 50% probability of moving from one coherence level to the next in a cumulative fashion - Threshold 1 = Waypoint 0 vs 1 & 2 → Threshold 2 = Waypoint 0 & 1 vs 2) and person ability parameters. These estimates enable placement of both respondents and item difficulty thresholds on a single interval scale, facilitating interpretation of student performance relative to item difficulty on a Wright Map (generically known as an item-person map).
25.1.4.2 Rasch Model Calibration
All items were scored using the three-category system (0 = minimal coherence, 1 = partial coherence, 2 = full coherence). Model calibration was conducted using ACER Conquest 5.0 (Adams, Wu, and Wilson 2012). The mean of ability was fixed to 0 for model identification purposes.
25.2 Results
25.2.1 Item Model Fit
We examined how well the Partial Credit Model fits the response data for the 77 items. Infit values ranged from .85 to 1.33, for 76 of 77 items, falling within the acceptable range of 0.77-1.33 (Wu and Adams 2013). One item has a fit statistic of 1.38. If an item has a high fit statistic, for example 1.9, it suggests that respondents with high proficiencies are getting that item wrong, respondents with low proficiencies are getting that item correct, and there is some scramble in between. If all items had poor fit statistics, then we could not trust the item difficulty estimates, and thus could not interpret their locations on the an item-person map meaningfully (Boone, Staver, and Yale 2014; Embretson 1996) (known as a Wright Map, after being named after Benjamin Wright (Wilson 2017) – this is a visual representation that depicts item difficulty locations and person proficiency locations on the same scale (in this case a logarithmic scale with interval units called logits) where distance has probabilistic interpretability (Wilson 2005) (Wilson, 2005, p. 98).
Overall, the fit statistics indicate good overall model-data fit. Observed responses are neither overly predictive nor too random with respect to model predictions, suggesting the three-category coherence framework captures meaningful variation in student responding.
25.2.2 Reliability
Person-separation reliability was calculated using Expected a posteriori (EAP) reliability, which represents how precisely the assessment estimates ability across the full range of student proficiency — that is, how well the items distinguish between students at similar ability levels. ROAR-Inference achieved an EAP reliability of 0.83, indicating that the assessment effectively differentiates students along the coherence evaluation continuum, represented as the logit scale generated from the Partial Credit Model, and provides sufficient internal consistency for both screening and diagnostic purposes.
25.2.3 A Multivantage Point Perspective to the Internal-Structure Validity Overview
Construct validity related to its internal structure has been explored in terms of its dimensionality, examining the degree to which the relationship of items is coherent with the theoretical framework of the construct (Sun, Wang, and Kim 2022). A means perspective is also helpful (i.e., thinking in terms of averages) and Rasch family models help with that (Wright and Masters 1982; Rasch 1960). When fitting a Rasch family model, whether dichotomous or partial credit, what we generate are mean item difficulty locations and mean person proficiency locations on the same logit scale. This sets the stage for investigation and why sense-making tools are so valuable. (Wilson 2023) construct mapping waypoints are that very tool. By creating a construct map, a qualitative representation of what low, medium, high looks like in a latent variable, we have a guiding compass to interpret threshold locations on a Wright Map; that is, how much banding is taking place across thresholds and items (Blum et al. 2020; Brondfield et al. 2021; Jolin and Wilson 2022; Morell et al. 2025; Stachl and Baranger 2020). Otherwise you are left with only rank ordered items and respondents without a way to interpret what those scale regions represent.
These waypoints then translate to interpreting mean-location increase across levels within items; that is, if we see consistent mean location groups of respondents proficiency score increase across item waypoints (e.,g levels), then we can be more confident about the stability of those waypoints (Blum et al. 2020, 2026). This can be done in a way on the item side as well; are there groupings or orderings of item locations that make theoretical sense (Yin, Ji, and Blum 2023).
However, many studies often take a relatively less comprehensive vantage point to validity evidence based on internal structure. We hope this multivantage point perspective to internal structure validity is helpful. Empirics coupled with interpretability tools like waypoints and construct mapping, gives us understanding how to interpret regions meaningfully, how to think about what drives difficulty of items and proficiency of respondents, and how to think about the stability of those waypoints, and perhaps even profiles of learners.
25.2.4 Construct Validity: Evidence from Internal Structure
Wright Map Analysis. The Wright Map (Figure 25.1) provides the empirical representation of the theoretical construct map by showing the distribution of person abilities and item difficulty thresholds on a common scale. For ROAR-Inference’s three-category scoring, the Partial Credit Model estimates two cumulative Thurstonian thresholds per item: Threshold 1 (the difficulty of achieving minimal coherence versus partial & full coherence) and Threshold 2 (the difficulty of achieving full coherence versus anything lower).
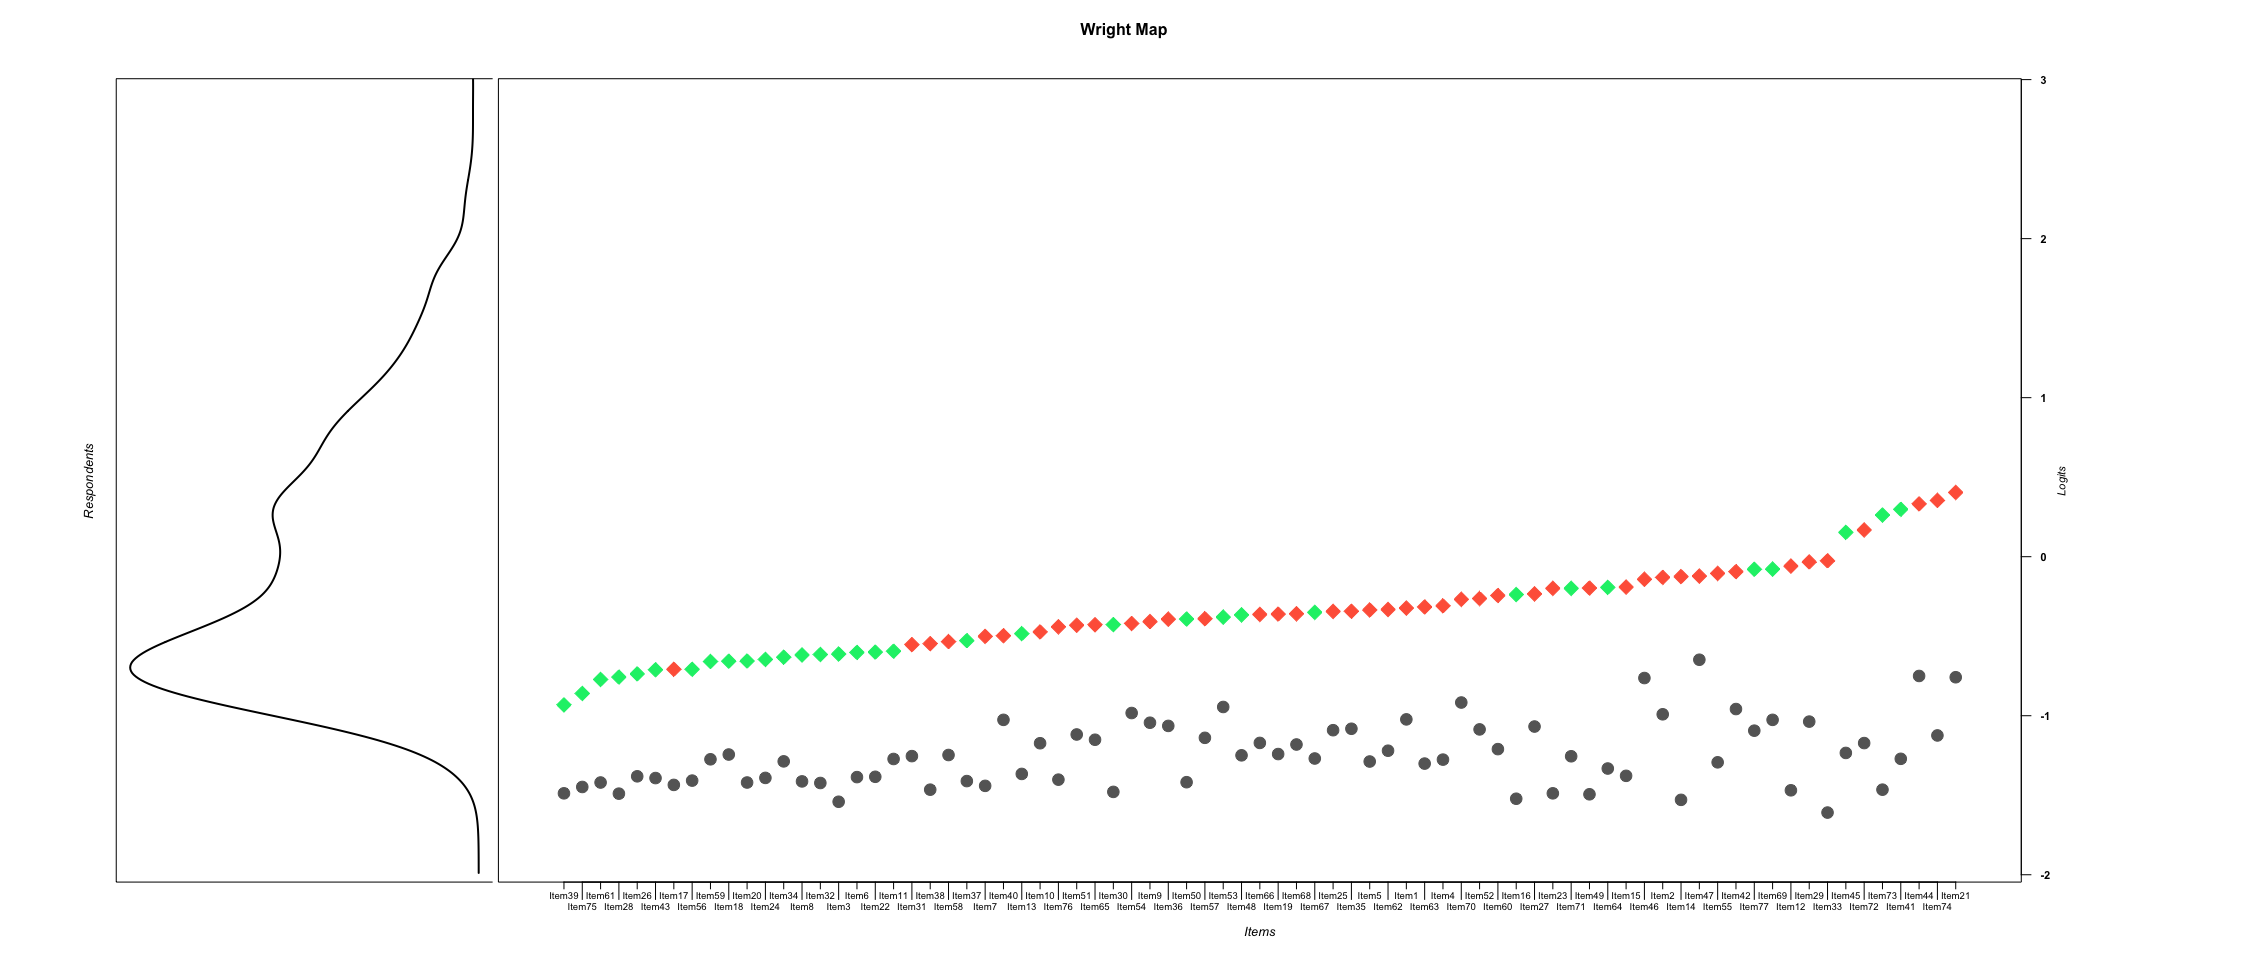
The Wright Map for ROAR-Inference demonstrates clear banding patterns, with most second thresholds positioned above most first thresholds across the item set. This systematic progression provides evidence for the stability of the three-waypoint construct map. While some items show first thresholds at relatively high logit locations—meaning these items require higher ability to distinguish between minimal and upper coherence levels—the majority of first thresholds cluster within a similar range on the scale, suggesting consistent measurement of the initial coherence threshold across most items.
Similarly, some second thresholds appear at relatively low logit locations—indicating that achieving the target response on these items is comparable in difficulty to selecting the partially-coherent distractor on most other items.
Because we used a Partial Credit Model, threshold 2 will always be above threshold 1 within each item, but that does not mean that pattern will hold across the whole item set. When this happens, a phenomenon called banding, we have strong evidence for the internal-structure validity of our construct.
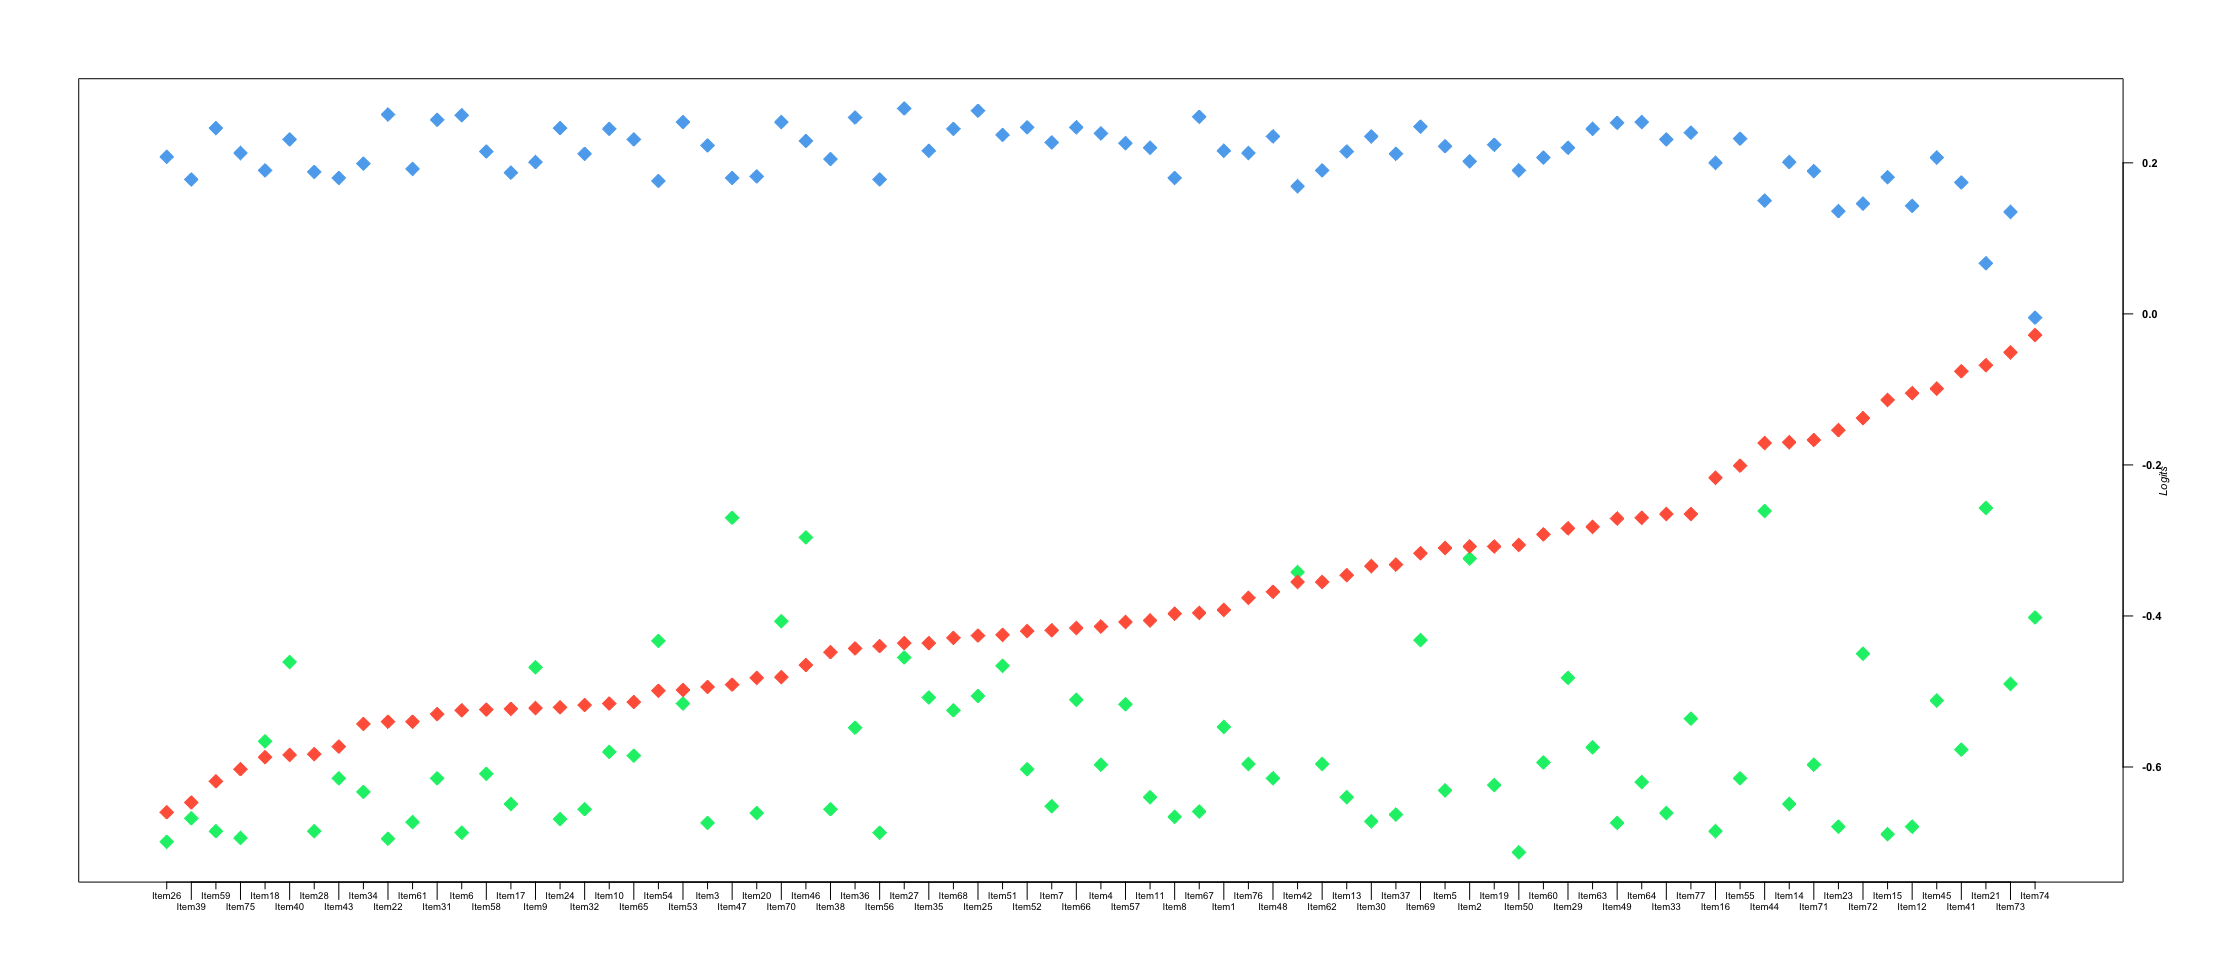
Within-Item Mean Location Increases. Another way to investigate evidence based on internal structure is to examine the group-mean locations of respondents who scored into each waypoint (i.e., response option). Generally, we would expect respondents who score into the target waypoint to have a higher group-mean location (i.e., higher proficiency) than those who scored into the middle waypoint, who in turn would score higher than those who scored into the most distal waypoint. Such ordering would support our hypothesis about how the structure of the variable (i.e., reading comprehension) behaves along the continuum.
As shown in Figure 25.2 this expected ordering was largely confirmed. The target waypoint (blue diamonds) falls at the highest end of the logit scale, the most distal waypoint (green diamonds) falls at the lowest end, and the middle waypoint (red diamonds) falls in between — reflecting the hypothesized ascending order of proficiency across waypoints. This figure is purely descriptive, not explanatory, as it shows where groups of respondents fall on the scale. However, for 7 out of 77 items, this ordering was disrupted: the most distal waypoint (green diamonds) appeared more appealing to higher-performing respondents than the middle waypoint (red diamonds), resulting in disordering on the scale. These items warrant further investigation to understand why the relatively more distal response option appealed to higher-performing students. Across the vast majority of items, however, the expected ordering held.
Dimensionality Analysis: A Correlational lens. The between-items multidimensional Partial Credit Model analyses (Adams, Wilson, and Wang 1997; Briggs and Wilson 2003) provides strong evidence for the stability of waypoints across item types and a unidimensional interpretation of inferential ability, while acknowledging meaningful distinctions between processing types. Latent correlations between text-base and inferential items reached 0.94 with a reliability of 0.81 for the literal dimension and 0.81 for the inferential dimension, indicating that these item types tap highly related abilities despite their theoretical distinctions (e.g., respondents who score high on literal items also score high on inferential items). Similarly, correlations between logical, informational, and evaluative inference items reached 0.79 or higher with a reliability of 0.81 for the logical relations dimension, 0.85 for the informational relation dimension, and 0.65 for the evaluative relation dimension (which had the fewest items, N=6).
As for the type of question-answer relation represented, latent correlations reached 0.85 or higher with a reliability coefficient of 0.80 for the text-explicit QAR dimension, 0.78 for the text-implicit QAR dimension, and 0.73 for the script-implicit QAR dimension. These latent correlations, taken together, support the interpretation that while the relation types from Warren, Nicholas, and Trabasso (1979) and other frameworks represent different manifestations of inferential processing, they draw upon a common underlying capacity.
| Dimension | Literal |
| Inferential | 0.94 |
| Dimension | Logical Relations | Informational Relations |
| Informational Relations | 0.93 | |
| Evaluative Relations | 0.79 | 0.79 |
| Dimension | Text-Explicit QAR | Text-Implicit QAR (Local) |
| Text-Implicit QAR (Local) | 0.92 | |
| Script-Implicit QAR (Global) | 0.91 | .90 |
25.3 Discussion
25.3.1 Brief Score Interpretation: What the Data Tell Us
The validation evidence supports the coherence framework underlying ROAR-Inference and confirms that the three-waypoint structure (Emerging/Waypoint 0, Developing/Waypoint 1, Strategic/Waypoint 2) represents a meaningful developmental progression in how students construct and evaluate meaning from text.
25.3.2 Understanding Response Patterns
The validation analyses confirm the coherence evaluation framework described in the Construct section. Students’ performance patterns align with the three waypoints: those selecting target responses demonstrate textual grounding and evidence integration, those selecting Distractor 1 show partial engagement with evidence, and those selecting Distractor 2 rely on background knowledge without adequate textual verification. Dimensionality analyses revealed that while logical, informational, and evaluative relations draw on a common underlying capacity, students’ performance patterns across these relation types provide valuable information for targeted instruction.
External validity analyses examining relationships with standardized achievement measures and other ROAR assessments and fairness analyses investigating differential item functioning across demographic groups are under progress and will be added to the technical manual in the near future.