| Grade | Correlation between ROAR-Phoneme and ROAR-Word | N |
|---|---|---|
| Kindergarten | 0.57 | 1249 |
| 1 | 0.57 | 2961 |
| 2 | 0.61 | 3539 |
| 3 | 0.58 | 2400 |
| 4 | 0.50 | 2573 |
| 5 | 0.47 | 2070 |
| 6 | 0.43 | 3126 |
| 7 | 0.43 | 3293 |
| 8 | 0.50 | 2180 |
| 9 | 0.42 | 6903 |
| 10 | 0.45 | 2952 |
| 11 | 0.51 | 2264 |
| 12 | 0.48 | 1461 |
26 Phonological Awareness (ROAR-Phoneme) Concurrent Validity
26.1 Background: Published studies
26.1.1 Evolution of the Design of ROAR-Phoneme items and subtests
The original ROAR-Phoneme subtests were selected based on well-known standardized in-person PA tasks (e.g., Wagner, Torgesen, and Rashotte (1999)):
- First Sound Matching (FSM) the participant has to find a word with the same first sound as the target word
- Last Sound Matching (LSM) the participant has to find a word with the same last sound as the target word
- Rhyming (RHY) the participant has to find the word that rhymes with the target word
- Blending (BLE) the participant has to merge parts of a word together and select the appropriate target word
- Deletion (DEL) the participant has to determine what is left after a section of the word is omitted.
Items for ROAR-Phoneme were designed such that selecting the correct answer would require the same cognitive operation as a traditional PA assessment with verbal responses. To achieve this, each item requires the participant to perform the same operation in their mind (e.g., determining if the first/last sound of two words matches; removing phonemes from a word), but the answer is selected from a set of alternatives rather than verbalized.
In the original design, FSM, LSM and RHY each consisted of 25 trials, divided into 2 blocks (16 and 9 items). The difference between blocks of these 3 subtests was finding the first sound (FSM), last sound (LSM), or word that rhymed (RHY) of a CVC word (difficulty level 1, 16 items) or a (C)CVC(C) word (difficulty level 2, 9 items). Thus, for the easier items (i.e., difficulty level 1) children had to identify a single phoneme (e.g., of FSM: Q: “Which picture starts with the same sound as pin?” A: “pup”), whereas for the more difficult items (i.e., difficulty level 2), children had to identify a consonant sound within a phoneme cluster (e.g., of FSM: Q: “Which picture starts with the same sound as clown?” A: “crab”). For FSM the three answer options were either the target (i.e., same first sound), a foil that started with the last sound of the provided word (Foil 1), or a foil with the same vowel (Foil 2). For LSM the same reasoning was made, but for the last sound of the word. For RHY the target word would rhyme, whereas Foil 1 would have the same vowel but would not rhyme and Foil 2 would have the same first sound. BLE and DEL each consisted of 24 items, divided into 3 difficulty levels (i.e., syllable level, onset or rime level, phoneme level) with each 8 items. These difficulty levels were based on a suggested hierarchy within PA skills (Stanovich 2017; Treiman and Zukowski 1991; Anthony and Lonigan 2004) . For example, for the subtest DEL an item of difficulty level 1 could be: Q: “What is lipstick without stick?” A: “lip”, for difficulty level 2: Q: “What is farm without ‘f’?” A: “arm”, and for difficulty level 3: Q: “What is snail without ‘n’?” A: “sail”. For both the BLE and DEL subtests, all additions and omissions led to lexical changes rather than morphological changes of the word structure. An item was either scored as correct (i.e., target selected) or as incorrect (i.e., foil selected). No distinction was made in the scores based on which foil was selected.
26.1.2 Proof-of-concept: Validation of items and composite scores
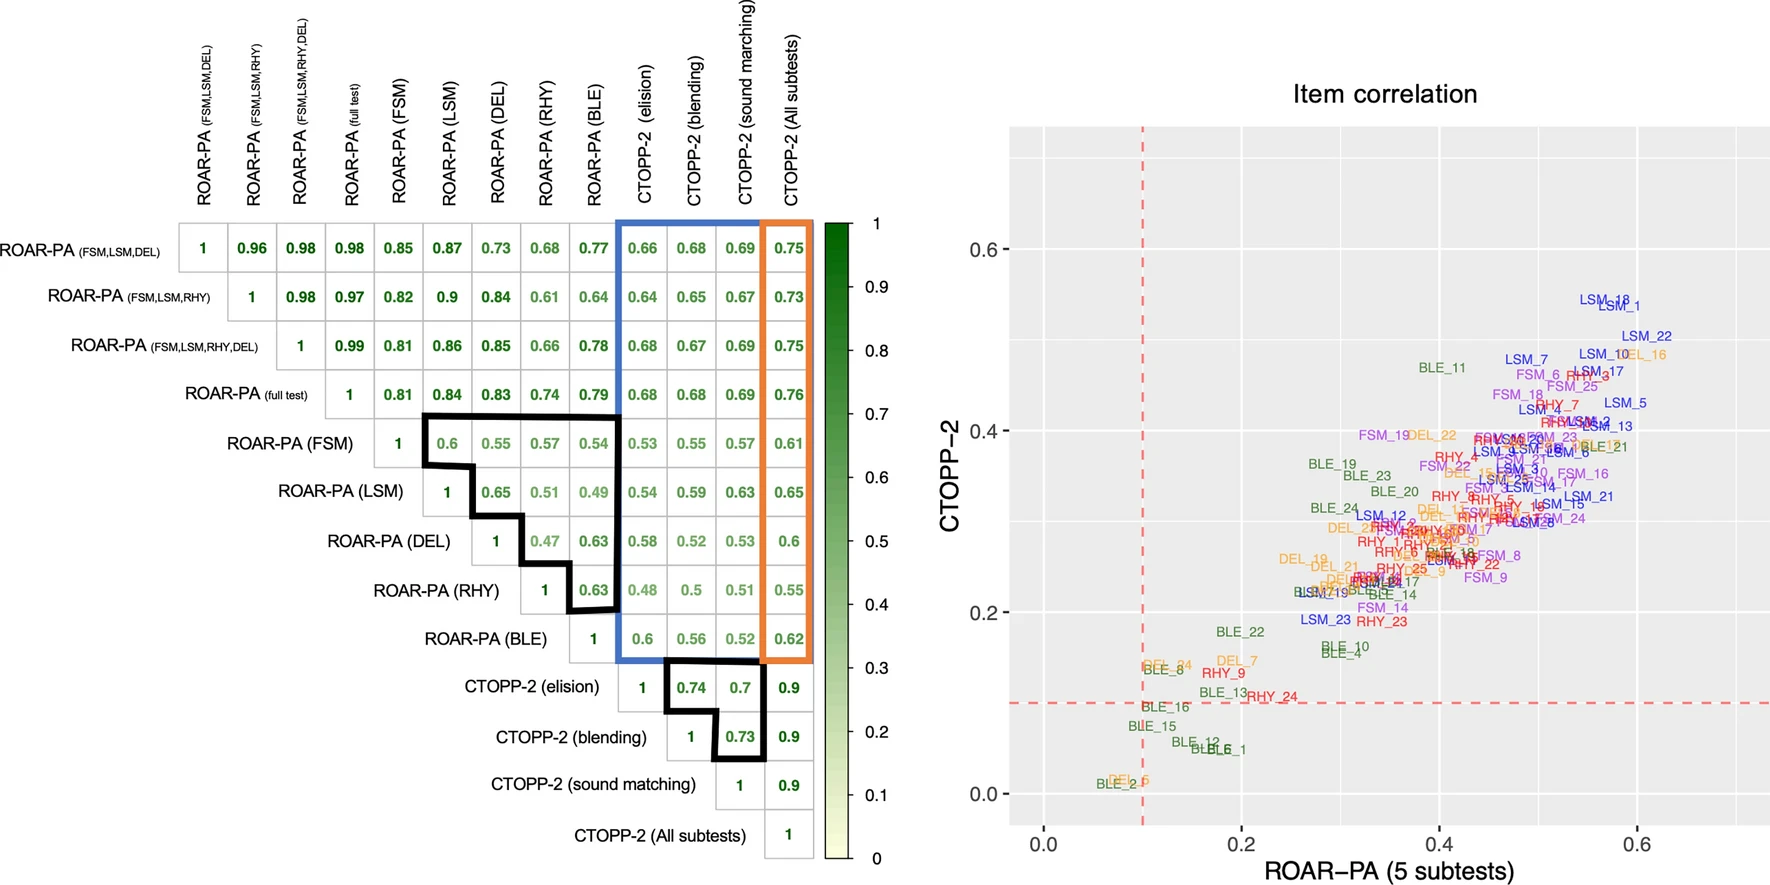
To validate the feasibility of a web-browser based PA task (containing 5 subtests: FSM, LSM, RHY, BLE, and DEL) that only required clicks/touchscreen responses, we tested 143 participants (Age: 3.87–13.00, \(\mu\)=7.13, \(\sigma\)=1.89; Sex: 67 F, 76 M) and performed a correlation analysis between each ROAR-PA subtest and the well-established standardized CTOPP-2. The results (Fig. 1, left panel) revealed strong correlations between the CTOPP-2 and all ROAR-Phoneme subtests: LSM (\(r\)=0.65), DEL (\(r\)=0.62), FSM (\(r\)=0.61), RHY (\(r\)=0.60), and BLE (\(r\)=0.55). Each subtest, except for BLE, showed high internal consistency based on Cronbach’s \(\alpha\) (LSM: \(\alpha\)=0.92, CI95=[0.89; 0.93], FSM: \(\alpha\)=0.90, CI95=[0.87; 0.93], RHY: \(\alpha\)=0.86, CI95=[0.81; 0.89], DEL: \(\alpha\)=0.84, CI95=[0.77; 0.88], BLE: \(\alpha\)=0.70, CI95=[0.57; 0.78]) and the composite scores of both CTOPP-2 (\(\alpha\)=0.88, CI95=[0.85 ; 0.91]) and ROAR-PA (\(\alpha\)=0.85, CI95=[0.80; 0.89]) had good (0.8\(\leq\alpha\)<0.9) internal consistency.
26.1.3 Optimization of ROAR-PA as a screening tool
To optimize ROAR-PA as a valid screening tool we sought to create a composite score that best approximated the CTOPP-2 composite index. To do so, we created a linear model with the CTOPP-2 scores as the dependent variable and the scores of each individual subtest as predictor variables. This model (CTOPP-2~FSM+LSM+RHY+BLE+DEL) showed that the subtests FSM (\(\beta\) = 0.79; t=2.33; p=0.02), LSM (\(\beta\) = 1.07; t=3.92; p<0.001), and DEL (\(\beta\) = 1.27; t=3.13; p=0.002) were significant predictors of the CTOPP-2 scores, but the subtests RHY (\(\beta\) = 0.44; t=1.13; p>0.10), and BLE (\(\beta\) = 0.55; t=0.90; p>0.10, were not. We then used a Likelihood Ratio test to determine the influence of these non-significant subtests in our CTOPP-2 prediction, by comparing the full model, as described above, to a model without BLE (4 ROAR-PA subtests: FSM, LSM, RHY, DEL); and a model with only the 3 significant subtests (FSM, LSM, DEL). We found no significant differences in model predictions between the full model and the 4 subtest model (\(\chi^2\)=0.85; p>0.10), nor the full model and the 3 subtest model (\(\chi^2\)=2.05; p>0.10), suggesting that the three subtests (FSM, LSM, DEL) are sufficient to obtain an accurate PA composite that approximates the CTOPP (\(R^2\)=0.57).
These findings are corroborated by interpreting the Pearson correlation coefficients between ROAR-PA and CTOPP-2. Although the highest correlation was reported by summing the scores on all 5 ROAR-PA subtests (\(r\)=0.76), a composite score based on 4 (FSM, LSM, DEL,RHY) or 3 ROAR-PA subtests (FSM, LSM, DEL) was equally correlated with CTOPP-2 (\(r\)=0.75). The 3-subtest composite and 4-subtest composite both achieved good reliability as well: Cronbach’s alpha of \(\alpha_{4subtests}\)=0.84, CI95=[0.77; 0.88] and \(\alpha_{3subtests}\)=0.78, CI95=[0.67; 0.84] respectively. As convergent validity greater than \(r\)=0.70 is recommended to reflect whether two measures capture a common construct, it can be concluded that all possible composite scores (5, 4, and even 3 subtests) suffice to capture PA skills.
Furthermore, an item analysis comparing the correlations between the item responses of ROAR-PA for each of the 123 test items and CTOPP-2 scores showed that performance on items from the subtest LSM were especially highly correlated with overall ROAR-PA performance and CTOPP-2 performance (Figure 26.1). This suggests LSM items are most informative about overall PA abilities. Items from the BLE subtest were least informative: the correlation between most blending items and ROAR-PA total score and CTOPP-2 total score was close to zero.
26.1.4 Ideal age range for ROAR-Phoneme
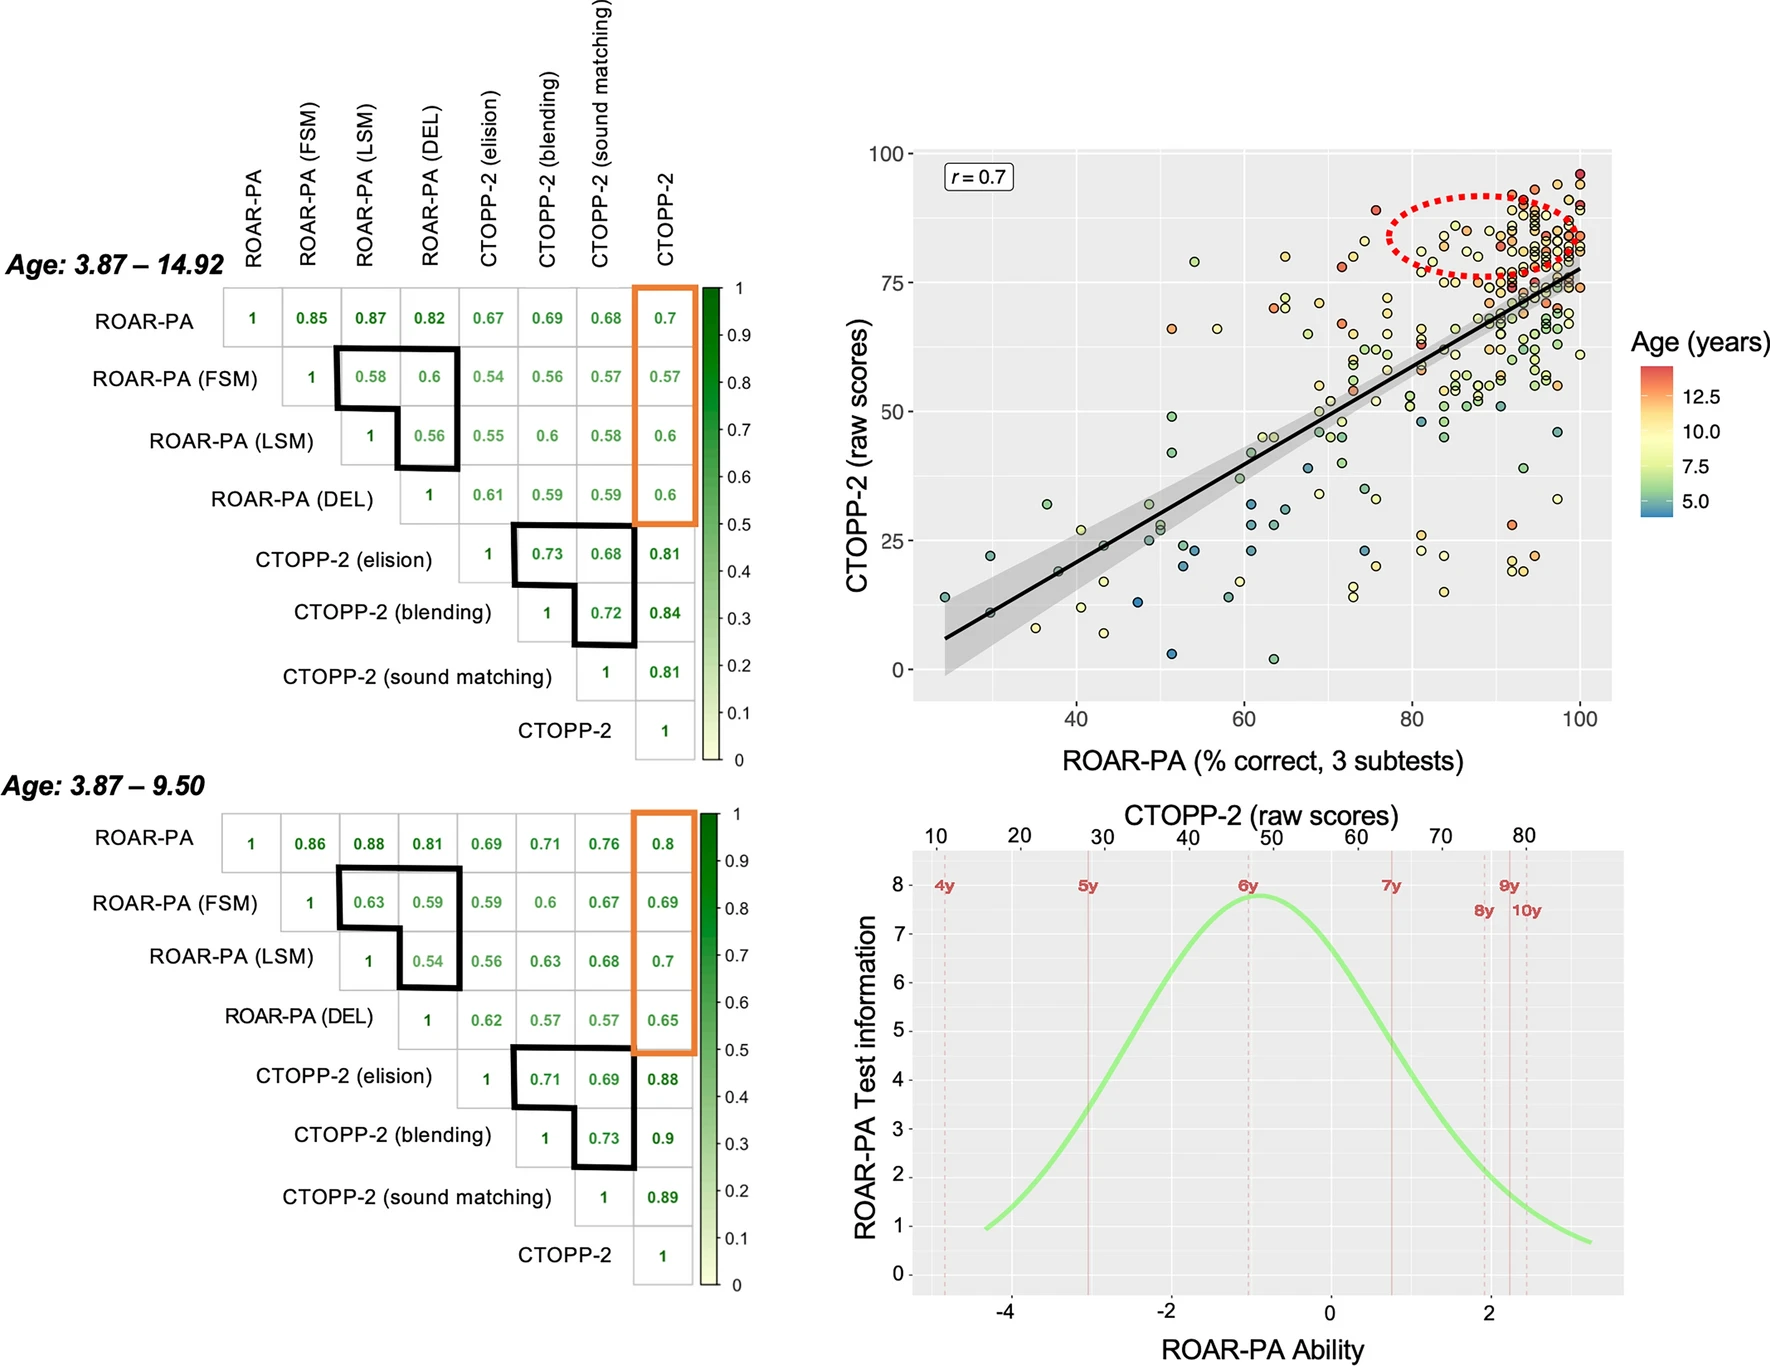
After selecting 3 subtests that make an efficient and reliable ROAR-PA composite score, we collected ROAR-PA data for an additional group of 127 participants, including mostly older children, resulting in a total of 270 participants (Age: 3.87–14.92, \(\mu\)=9.12, \(\sigma\)=2.71; Sex: 125 F, 145 M) who completed ROAR-PA FSM, LSM, and DEL subtests. Of these participants, 266 were also administered the CTOPP-2 PA assessment. The Pearson correlation analysis with the CTOPP-2 for this extended group of participants resulted in an overall correlation between CTOPP-2 and ROAR-PA composite (3 subtests) of \(r\)=0.70 (as opposed to \(r\)=0.75 in the initial sample of participants). The correlation between the CTOPP-2 and the individual subtests also went down for FSM and LSM (Fig. 2. Left top). The decrease in correlation likely reflected ceiling effects in older participants (Figure 26.2).
To examine the effect of age on the correlation between ROAR-PA and CTOPP-2, we split our sample into 3 different age bins (3.87–6.99 years old (N=71), 7.00–9.99 years old (N=91), 10.00–14.92 years old (N=104)). We found a correlation coefficient between the composite scores of ROAR-PA and CTOPP-2 of \(r\)=0.79 (CI95=[0.68; 0.86], Cronbach’s \(\alpha\)=0.88) for the youngest group, \(r\)=0.69 (CI95=[0.56; 0.78], Cronbach’s \(\alpha\)=0.79) for the middle group, and \(r\)=0.31 (CI95=[0.13; 0.48], Cronbach’s \(\alpha\)=0.65) for the oldest group of children. Further correlation and Rasch analyses provided an ideal age range of up to 9.50 years old for the ROAR-PA (Figure 26.2), leading to a Pearson correlation coefficient of \(r\)=0.80 (CI95=[0.73; 0.85], Cronbach’s \(\alpha\) of 0.80) between the ROAR-PA composite and CTOPP-2, and an increase of the correlations for individual subtests (FSM, LSM, DEL) to the CTOPP-2. This indicates that the ROAR-PA in its current form is predictive of PA skills for children in pre-kindergarten through fourth grade (Figure 26.2) but has ceiling effects above fourth grade. Interestingly, the correlation analysis in our sample shows a similar effect for the CTOPP-2 scores, indicating that both PA tasks (ROAR-PA and CTOPP-2) are most suited for younger children.
26.1.5 Factor structure of Phonological Awareness
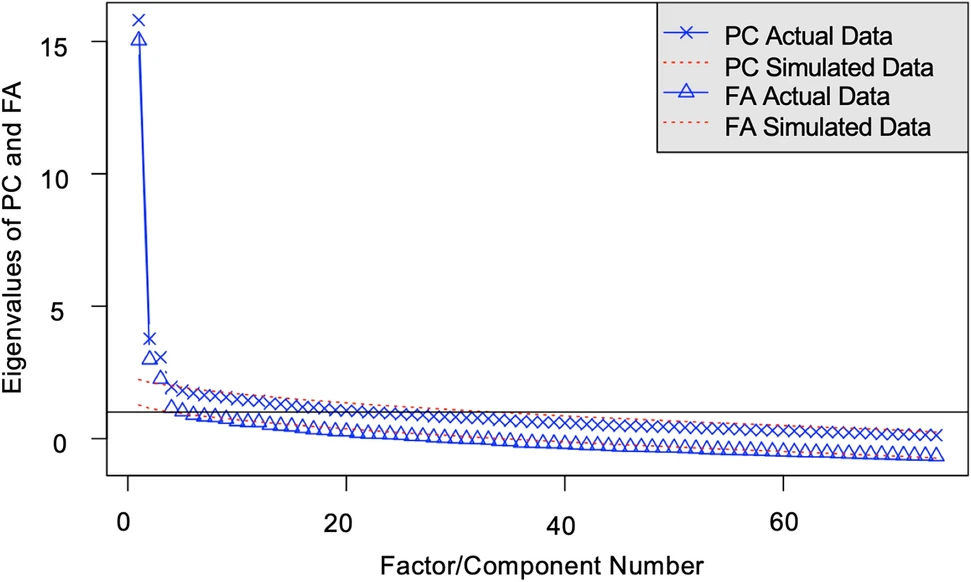
To evaluate the dimensionality of the ROAR-PA assessment we used exploratory FA with oblique rotation. FA poses the question of whether there is evidence that all of these items are measuring the same underlying phonological processing ability, or whether the items of these subtests better represent separable (but correlated) dimensions of PA.
Our results suggest a multi-dimensional framework. First, the scree plot (Figure 26.3) of the different items (N=74) on these three subtests (FSM, LSM, DEL) indicate three factors before the rate of decrease flattens. Second, the magnitudes of the loadings for the three-factor model are larger than the one-factor model. Finally, examining the factor loadings, the items from each of the three subtests cleanly separate into separate factors, with the exception of a single item: FSM_13.
26.1.6 Item Response Theory analysis: Rasch model
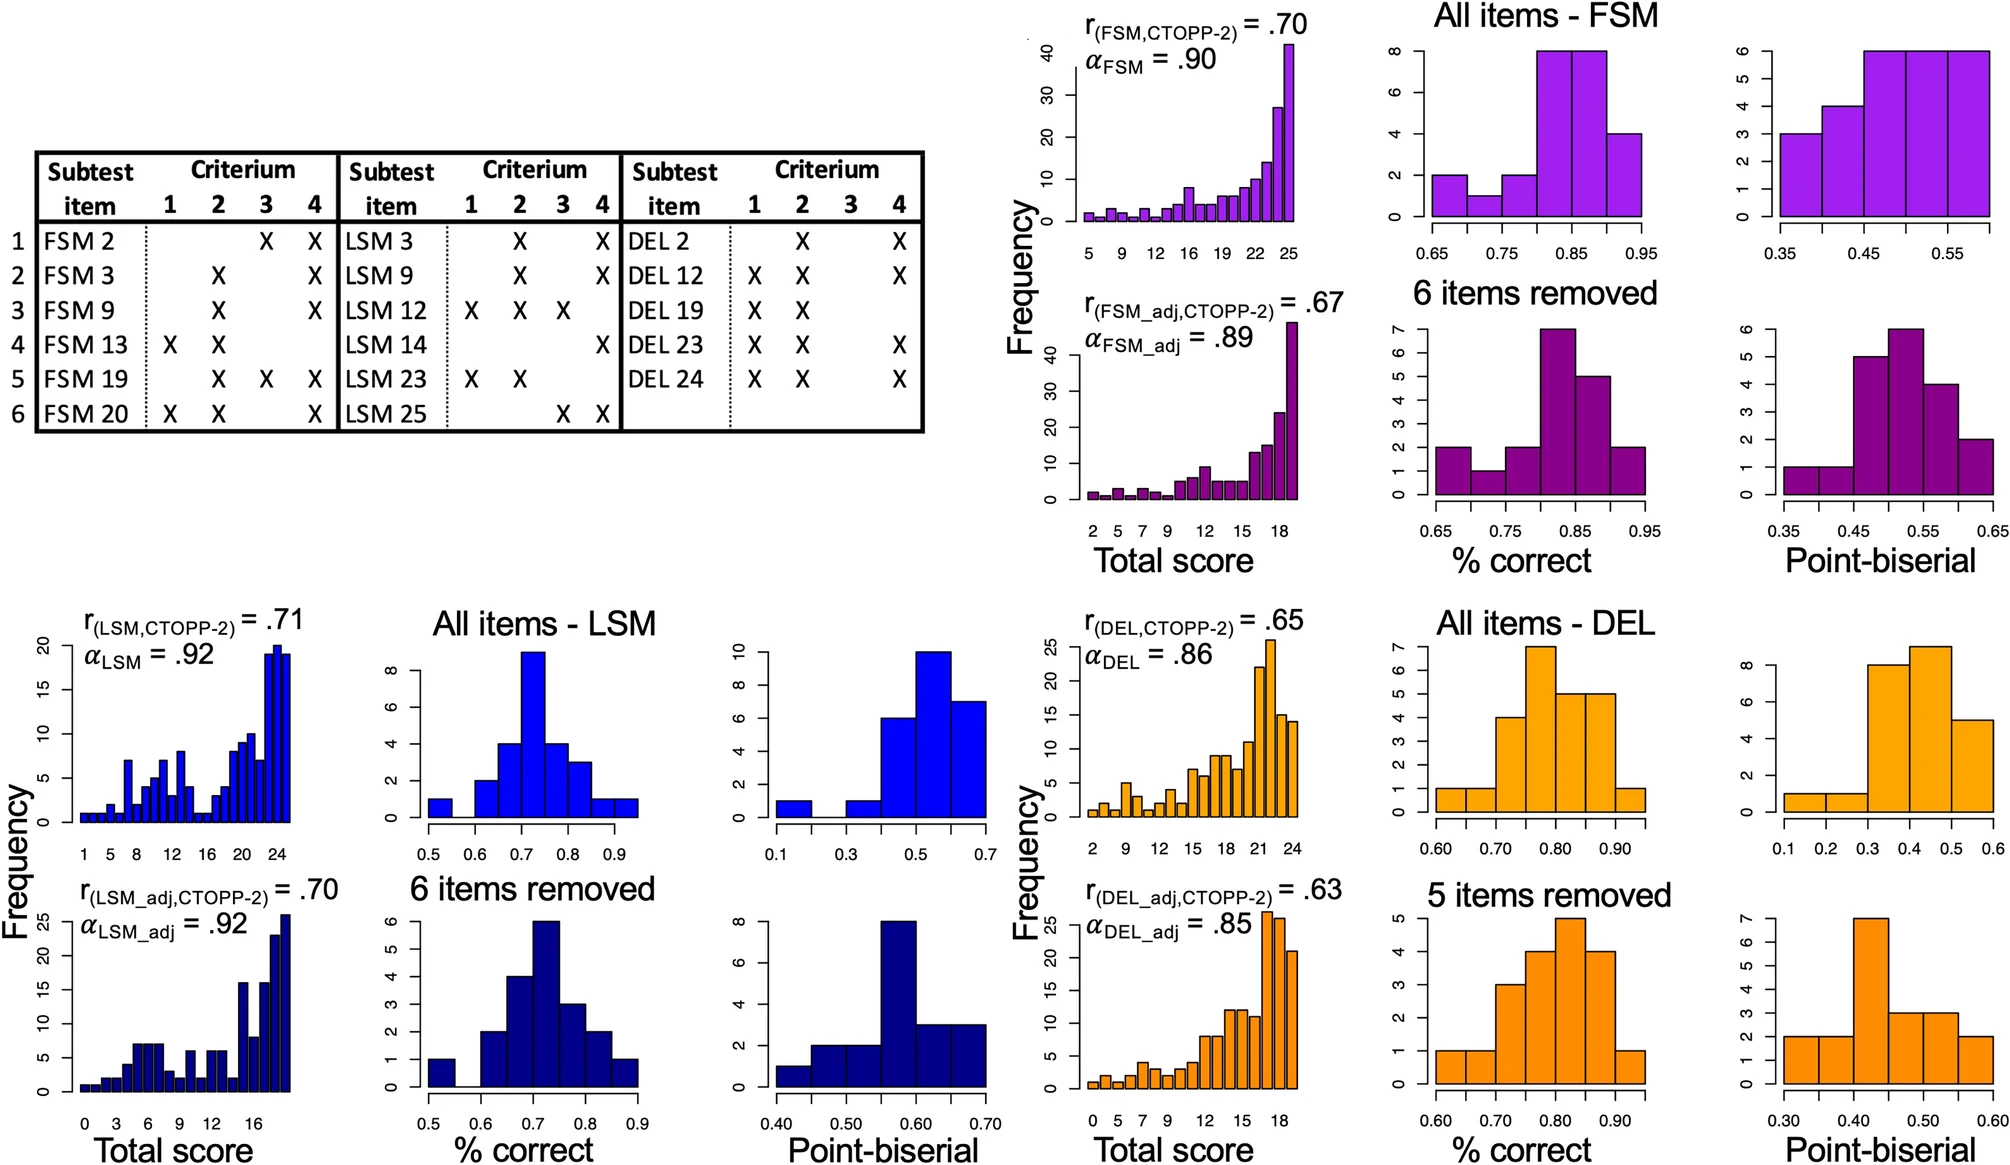
In a second step we identified a subset of items from ROAR-PA to remove in order to both improve model fit and reduce the length of the assessment. Given the evidence for a multi-dimensional framework, we proceeded by calibrating a Rasch Model separately for each of the subtests (FSM, LSM and DEL). In this IRT analysis we included data for all participants between 3.87 and 9.50 years old. For each subtest we reviewed four criteria, compiled from both the factor analysis and Rasch Model item fit statistics, to determine the best subset of items: (1) Does the item load on the subtest factor with a relationship > .30? (Tabachnick et al. 2012) (2) Does the item resemble a functional form when looking at empirical plots? ((Allen and Yen 2001) (3) Is the item flagged based on Rasch model fit statistics (Wright 1994)? (4) Finally, as we want items to be informative and not redundant, is the item located near two or more items based on difficulty distribution, to create a test length that seems appropriate for children’s attention spans (Figure 26.5)?
Analysis of the FSM subtest (Figure 26.5) suggested removing 6 of the 25 items. After removing these items, no major degradation or change in the key item statistics for this assessment was observed. Cronbach’s \(\alpha\) remained high (\(\alpha_{FSMallitems}\) = .90, CI95 = [.87 ; .93] & \(\alpha_{FSMadjusted}\) = .89, CI95 = [.85 ; .92]), and the distributions of the proportion-correct values and the point-biserial correlations for all items remained similar. The correlation (Fig. 2, left bottom) between FSM total scores and CTOPP-2 stayed about the same (\(r_{FSMallitems}\) = .69, \(r_{FSMadjusted}\) = .67). Analysis of the LSM subtest (Fig 4., left bottom) also suggested removing 6 out of 25 items. Similar to FSM, Cronbach’s \(\alpha\) of LSM remained high (\(\alpha_{LSMallitems}\) = .92, CI95 = [.90 ; .94] & \(\alpha_{LSMadjusted}\) = .92, CI95 = [.90 ; .93]), the distributions of the proportion-correct values, the point-biserial correlations, and the correlation between the total scores and the CTOPP-2 remained similar (\(r_{LSMallitems}\) = .70, \(r_{LSMadjusted}\) = .70). Analysis of the DEL subtest (Figure 26.5) indicates removal of 5/24 items. Again, Cronbach’s \(\alpha\) remained high (\(\alpha_{DELallitems}\) = .86, CI95 = [.79 ; .89] & \(\alpha_{DELadjusted}\) = .85, CI95 = [.78 ; .89]), the distributions of the proportion-correct values, the point-biserial correlations, and the correlation between the total scores and the CTOPP-2 remained similar (\(r_{DELallitems}\) = .65, \(r_{DELadjusted}\) = .63).
This Rasch item analysis suggests that every subtest of this ROAR-PA task has a good (DEL) to excellent (FSM, LSM) internal consistency, based on Cronbach’s \(\alpha\), with a strong correlation of every subtest (r > .65) to the overall CTOPP-2 scores. Item analysis based on meeting at least 2/4 suggested criteria, results in 19 items per subtest, and an overall task of 57 items + 2 practice items per subtest.
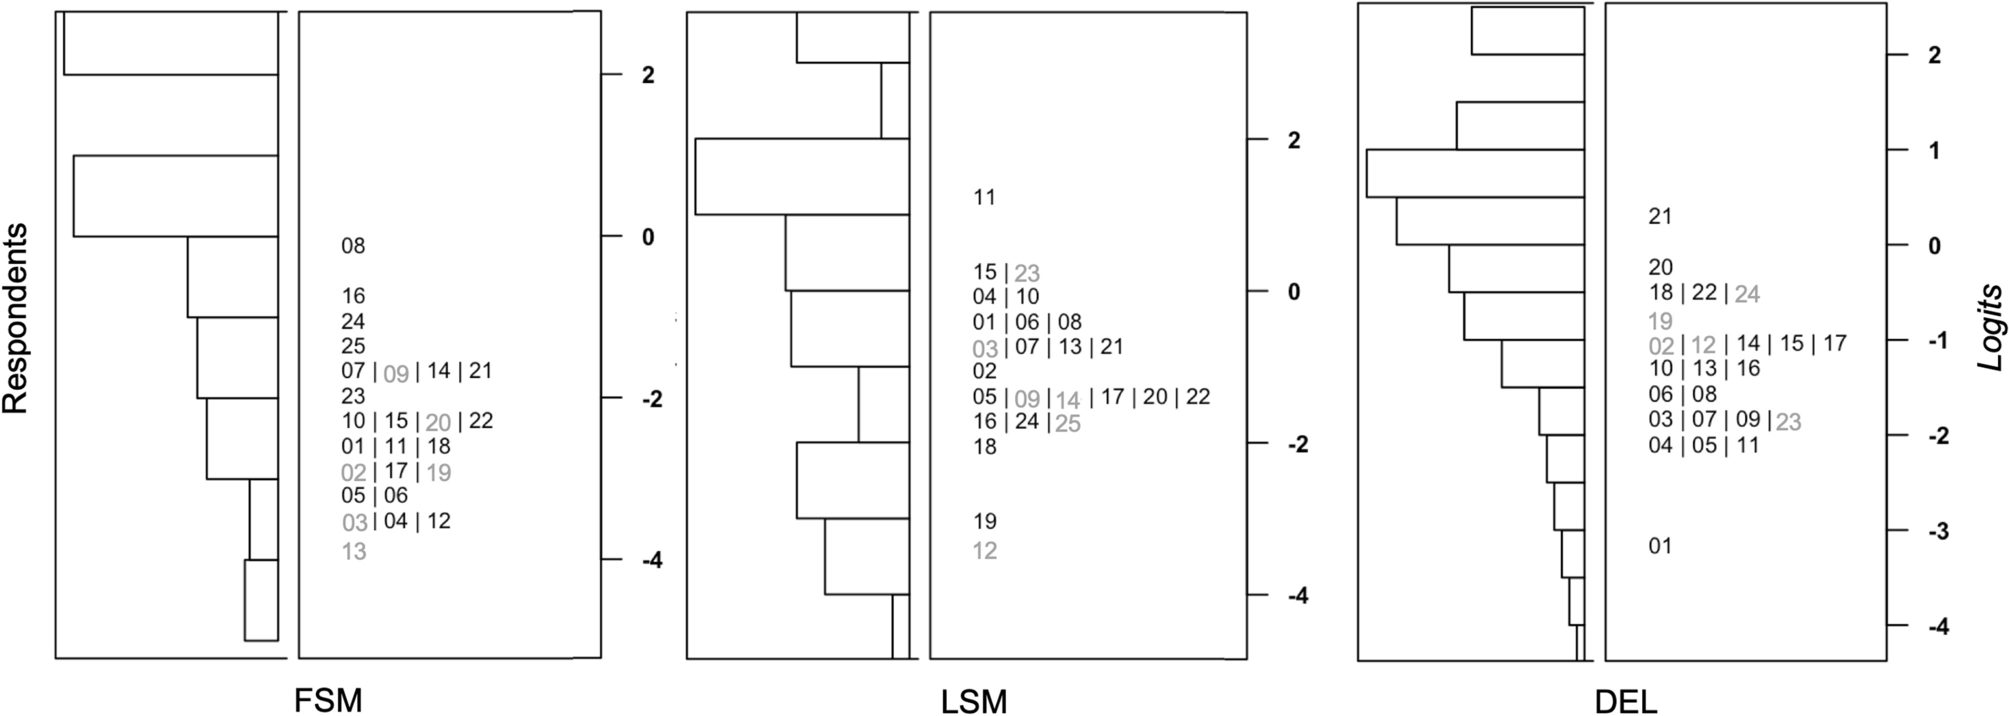
ROAR-Phoneme items were designed to span different theoretical levels of difficulty (e.g., Stanovich 2017; Treiman and Zukowski 1991). For the DEL subtest, difficulty levels were based on manipulation of (1) words and syllables (item 1-8), (2) onset and rimes (item 9-16), or (3) phonemes in the middle of the word (item 17-24). For FSM and LSM we can not follow these levels, as the task itself focuses on the first or last phoneme(s) of the word. We tried to create difficulty levels by manipulating single phonemes (level 1: item 1-16) or a single phoneme in a phoneme cluster (level 2: item 17-25). Surprisingly, based on the Rasch Model item-person maps for the three subtests (Fig. 5), we only found that the subtest DEL approximately follows the expected difficulty pattern. This analysis also showed that for FSM most items are closer to the lower-range of ability. For LSM and DEL, most items are close to the mid-range of ability.
26.2 Correlations between ROAR-Phoneme and ROAR-Word
PA is assessed at the beginning of reading instruction because of the relationship between PA and decoding skills. Students who struggle with PA tend to also struggle to learn decoding skills. There have been hundreds of studies documenting the relationship between PA and reading skills early in elementary school and the expected correlation ranges from r=0.3 to r=0.5 depending on the details of the measure and the sample (Scarborough 1998; Swanson et al. 2003). Table 26.1 shows the correlation between ROAR-Phoneme and ROAR-Word for kindergarten through 12th grade. The correlation is right in the expected range providing additional evidence for the validity of ROAR-Phoneme as a measure of PA skills.
