18 Reliability of ROAR-Sentence
ROAR-Sentence is a timed measure and the score is computed as the number of correct trials minus the number of incorrect trials in the alloted period time window. Originally, ROAR-Sentence was 3 minutes long but (Yeatman et al. 2024) demonstrated the cutting the time in half to 90 seconds had very little impact on reliability and validity of the measure. ROAR-Sentence consists of a collection of equated test forms where sentences are presented in a fixed order. We first report our methodology for equating test forms (Section 18.1) and then report alternate form reliability (Section 18.3).
18.1 Equating ROAR-Sentence test forms
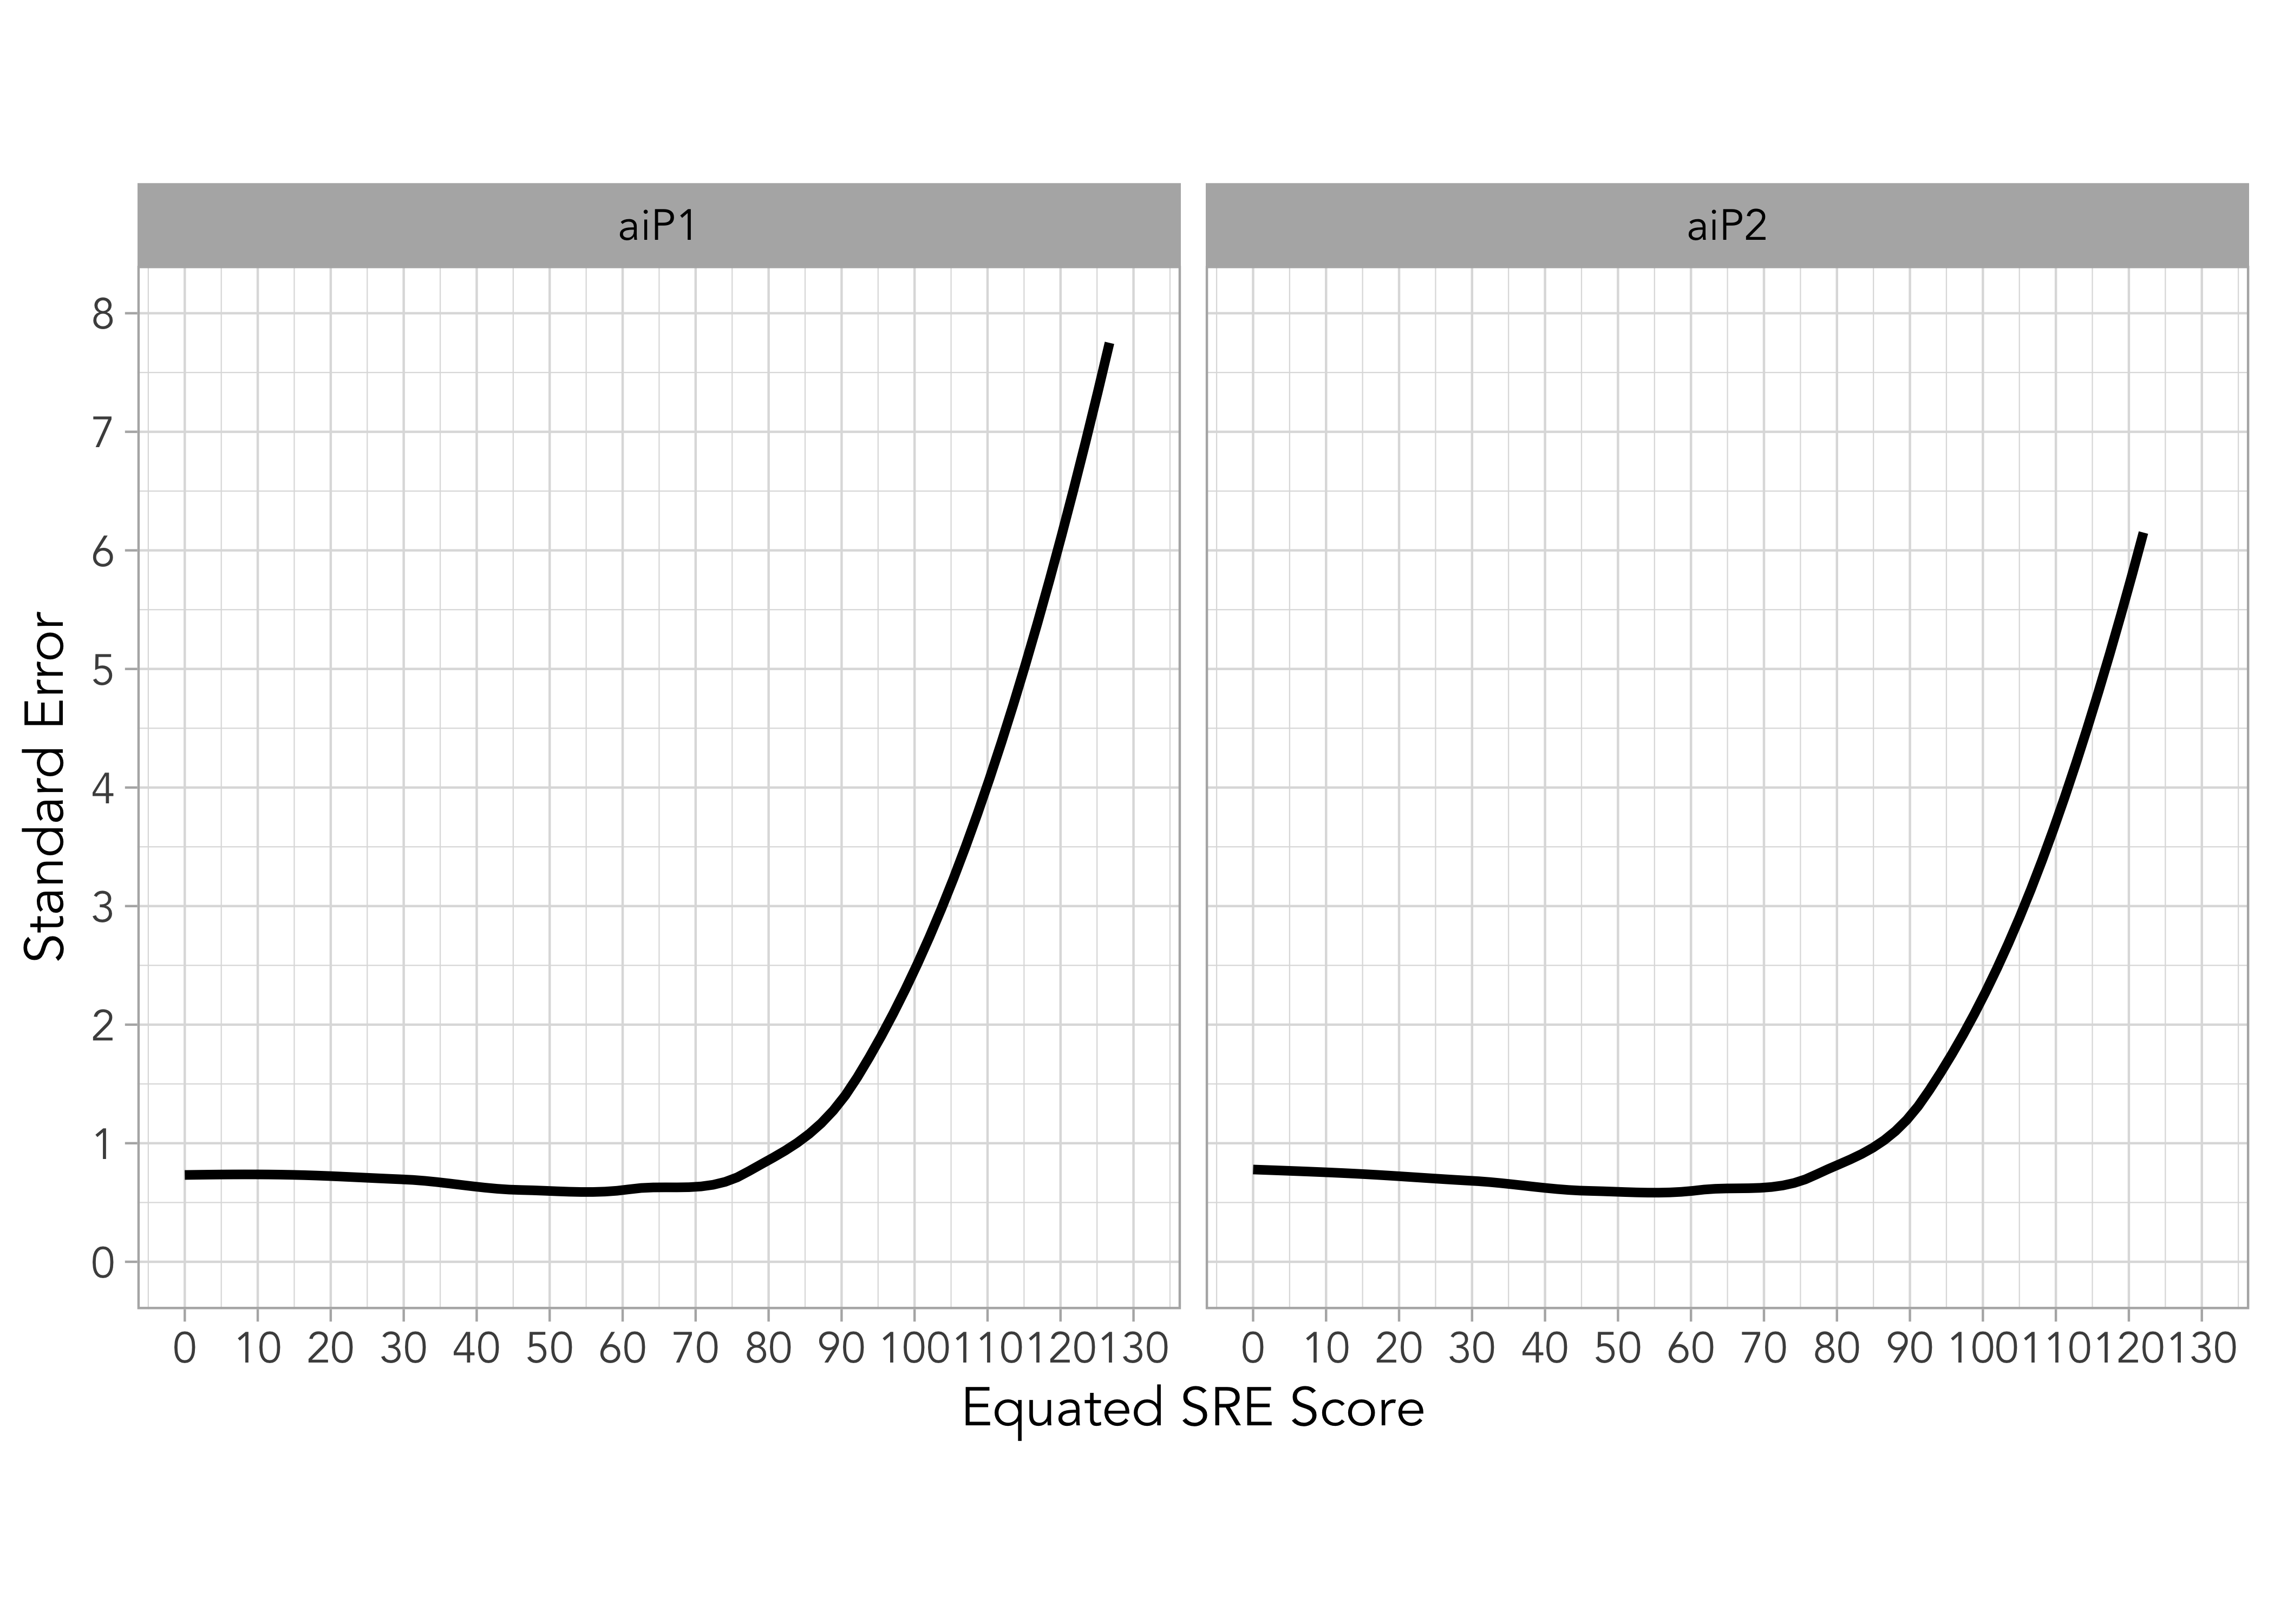
ROAR-Sentence consists of multiple parallel forms co-developed by human researchers and generative AI. Generative AI greatly reduces the time and resources required to create multiple tests forms, and (Zelikman 2023) has shown that the quality of AI-generated forms is highly comparable to those created by humans. These test forms were equated using equipercentile equating through the equate package.
Figure 18.1 a) shows the equated scores across the test forms. Equating enables ROAR-Sentence to randomly select from multiple available test forms, thereby minimizing the potential for practice effects when students encounter the same test form across different testing windows. Figure 18.2 b) provides a separate plot showing the standard error of the equipercentile equating.

18.2 Criteria for identifying disengaged participants and flagging unreliable scores
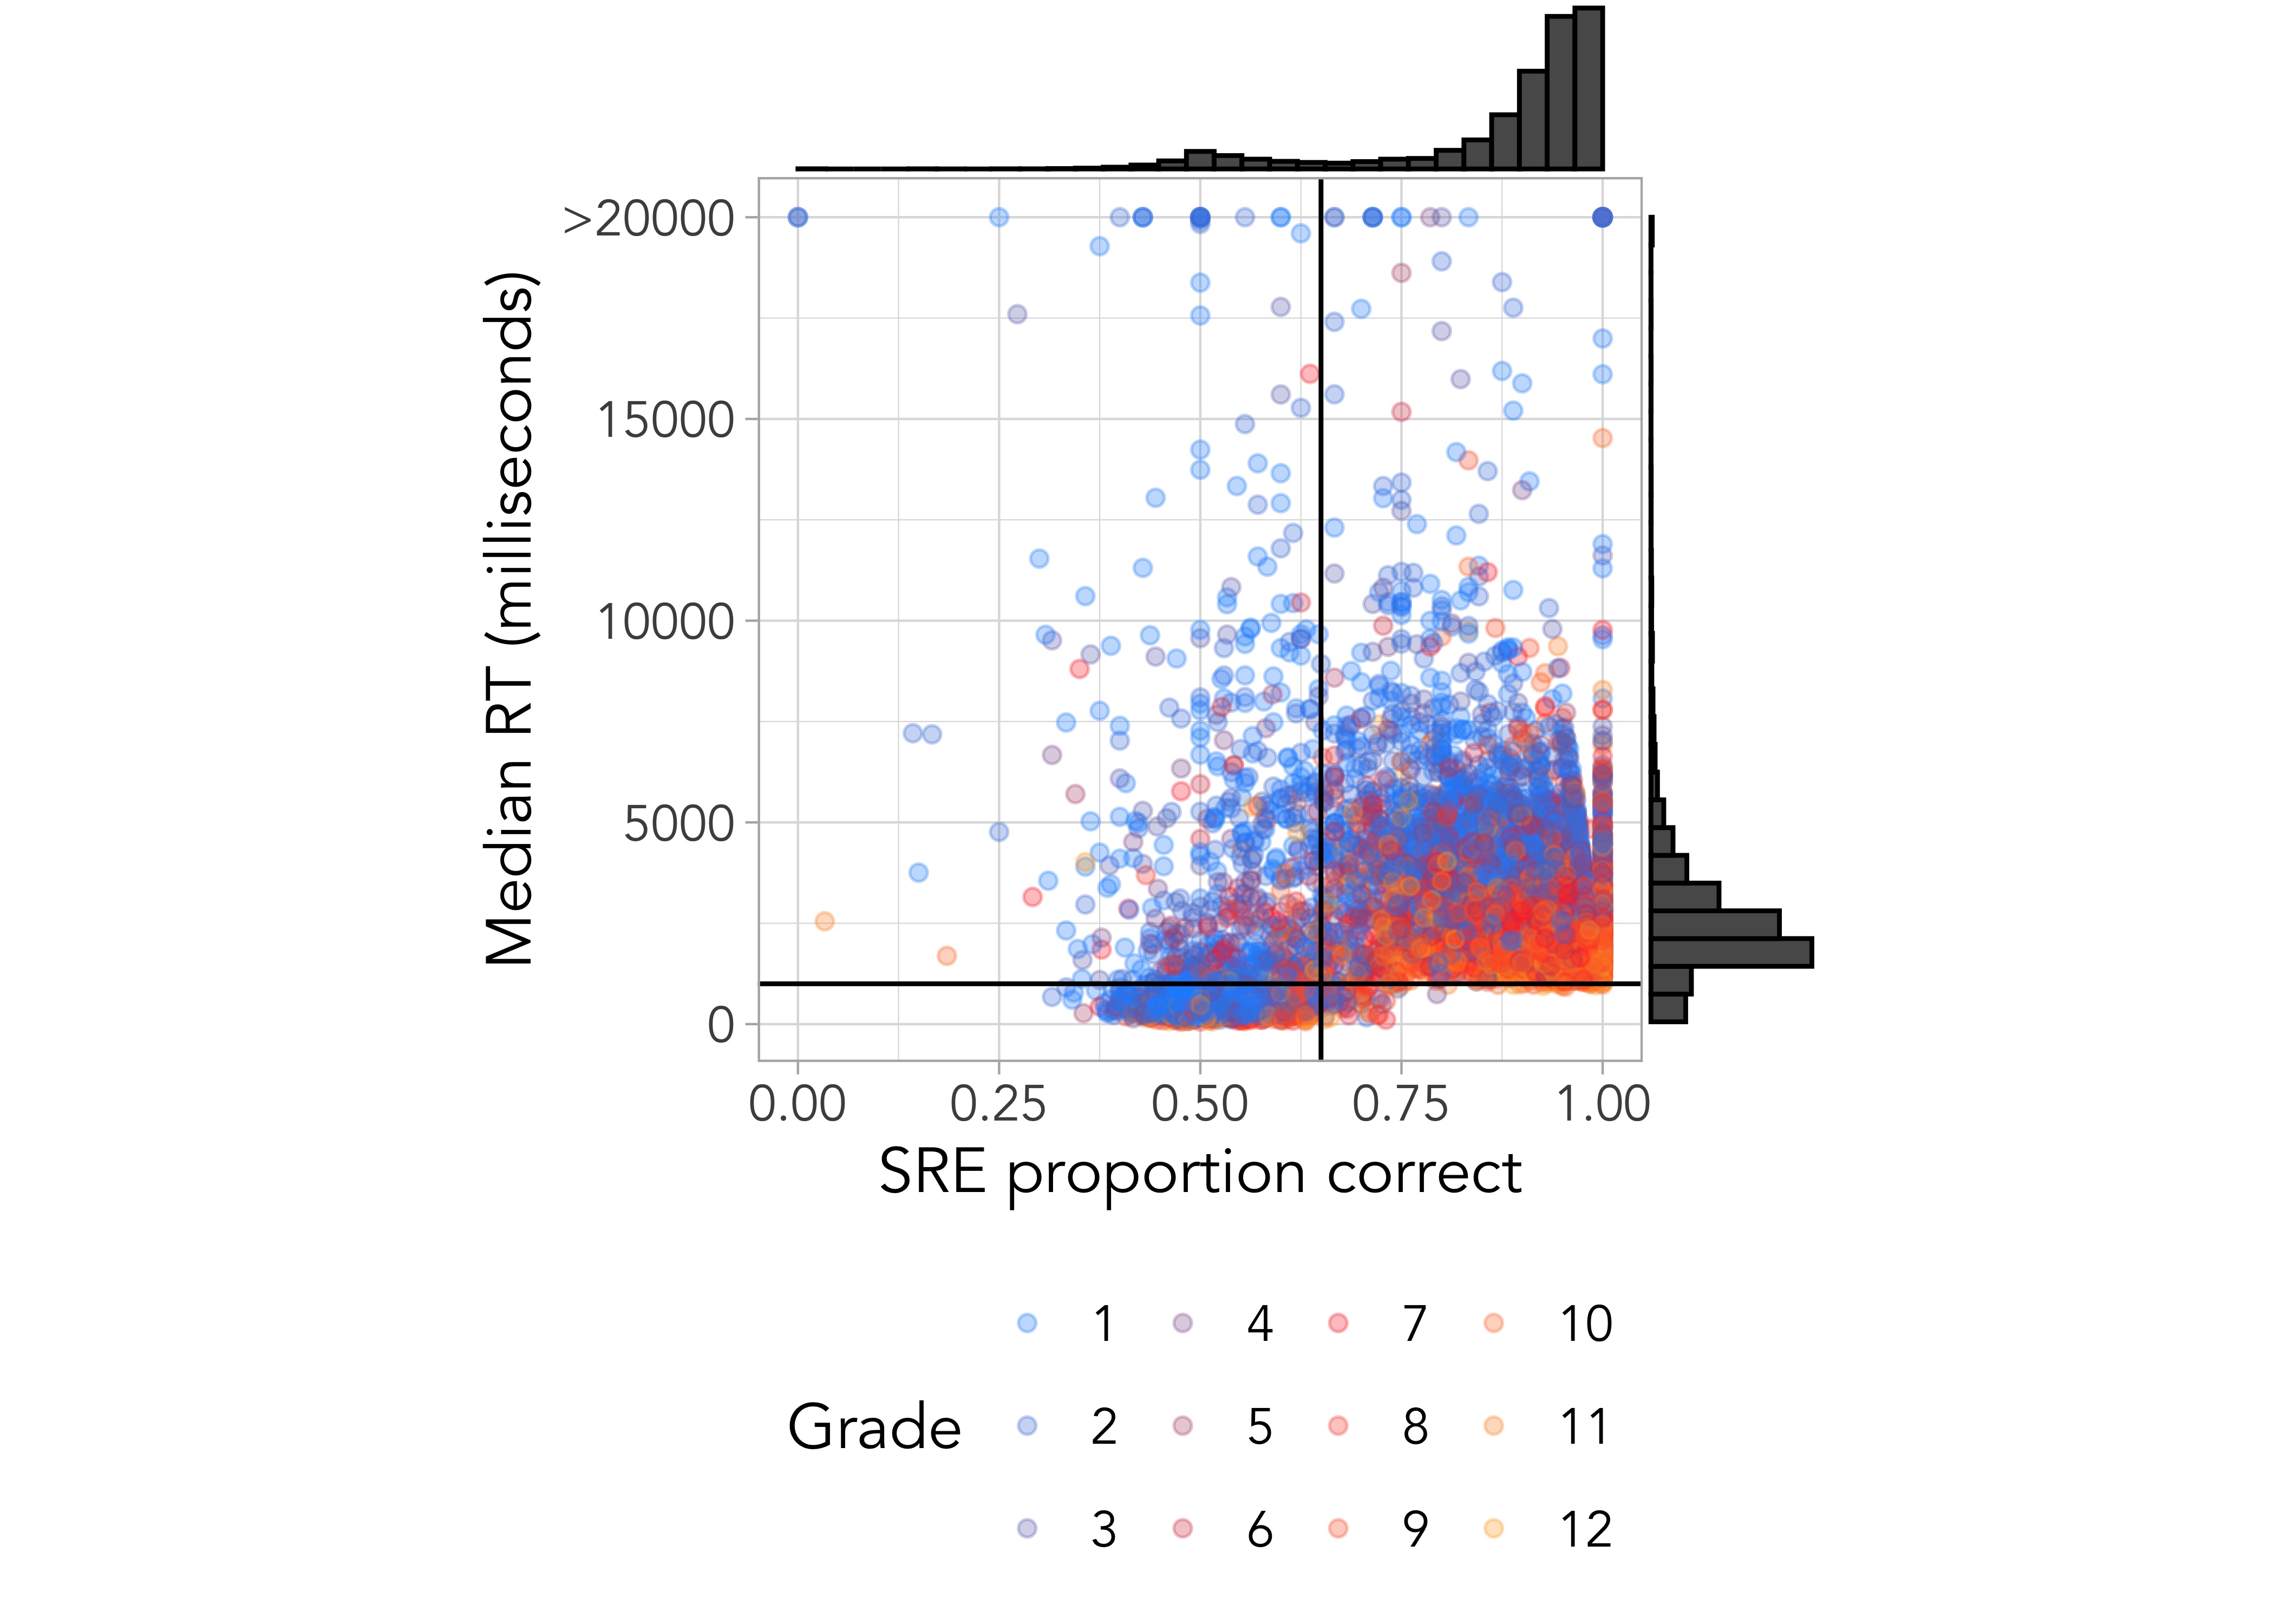
ROAR-Sentence is designed to be totally automated: reading is done silently, responses are non-verbal, instructions and practice trials are narrated by characters, and scoring is done automatically in real time. This makes it possible to efficiently assess a whole district simultaneously. A concern about automated assessments is that without a teacher to individually administer items, monitor, and score responses, some students might disengage and provide data that is not representative of their true ability. For a measure like ROAR-Sentence where items are designed and validated to have an unambiguous and clear answer, disengaged participants can be detected based on fast and innacurate responses. Our approach to identifying and flagging disegnaged participants with unreliable scores was published in (Yeatman et al. 2024). Figure 18.3 shows a plot of median response time (RT) versus proportion correct for each participant. Most participants were very accurate (>90% correct responses). However there was a bimodal distribution indicating a small group of participants who were performing around chance. These participants also had extremely fast response times.
Criteria for flagging unreliable scores
Participants with a median response time <1,000ms AND low accuracy (<65% correct) are flagged as unreliable scores in ROAR score reports and are excluded from analyses since scores do not accurately represent the participant’s ability. Teachers can choose whether to re-administer ROAR or interpret data cautiously in relation to other data sources and contextual factors.
18.3 Alternate form reliability
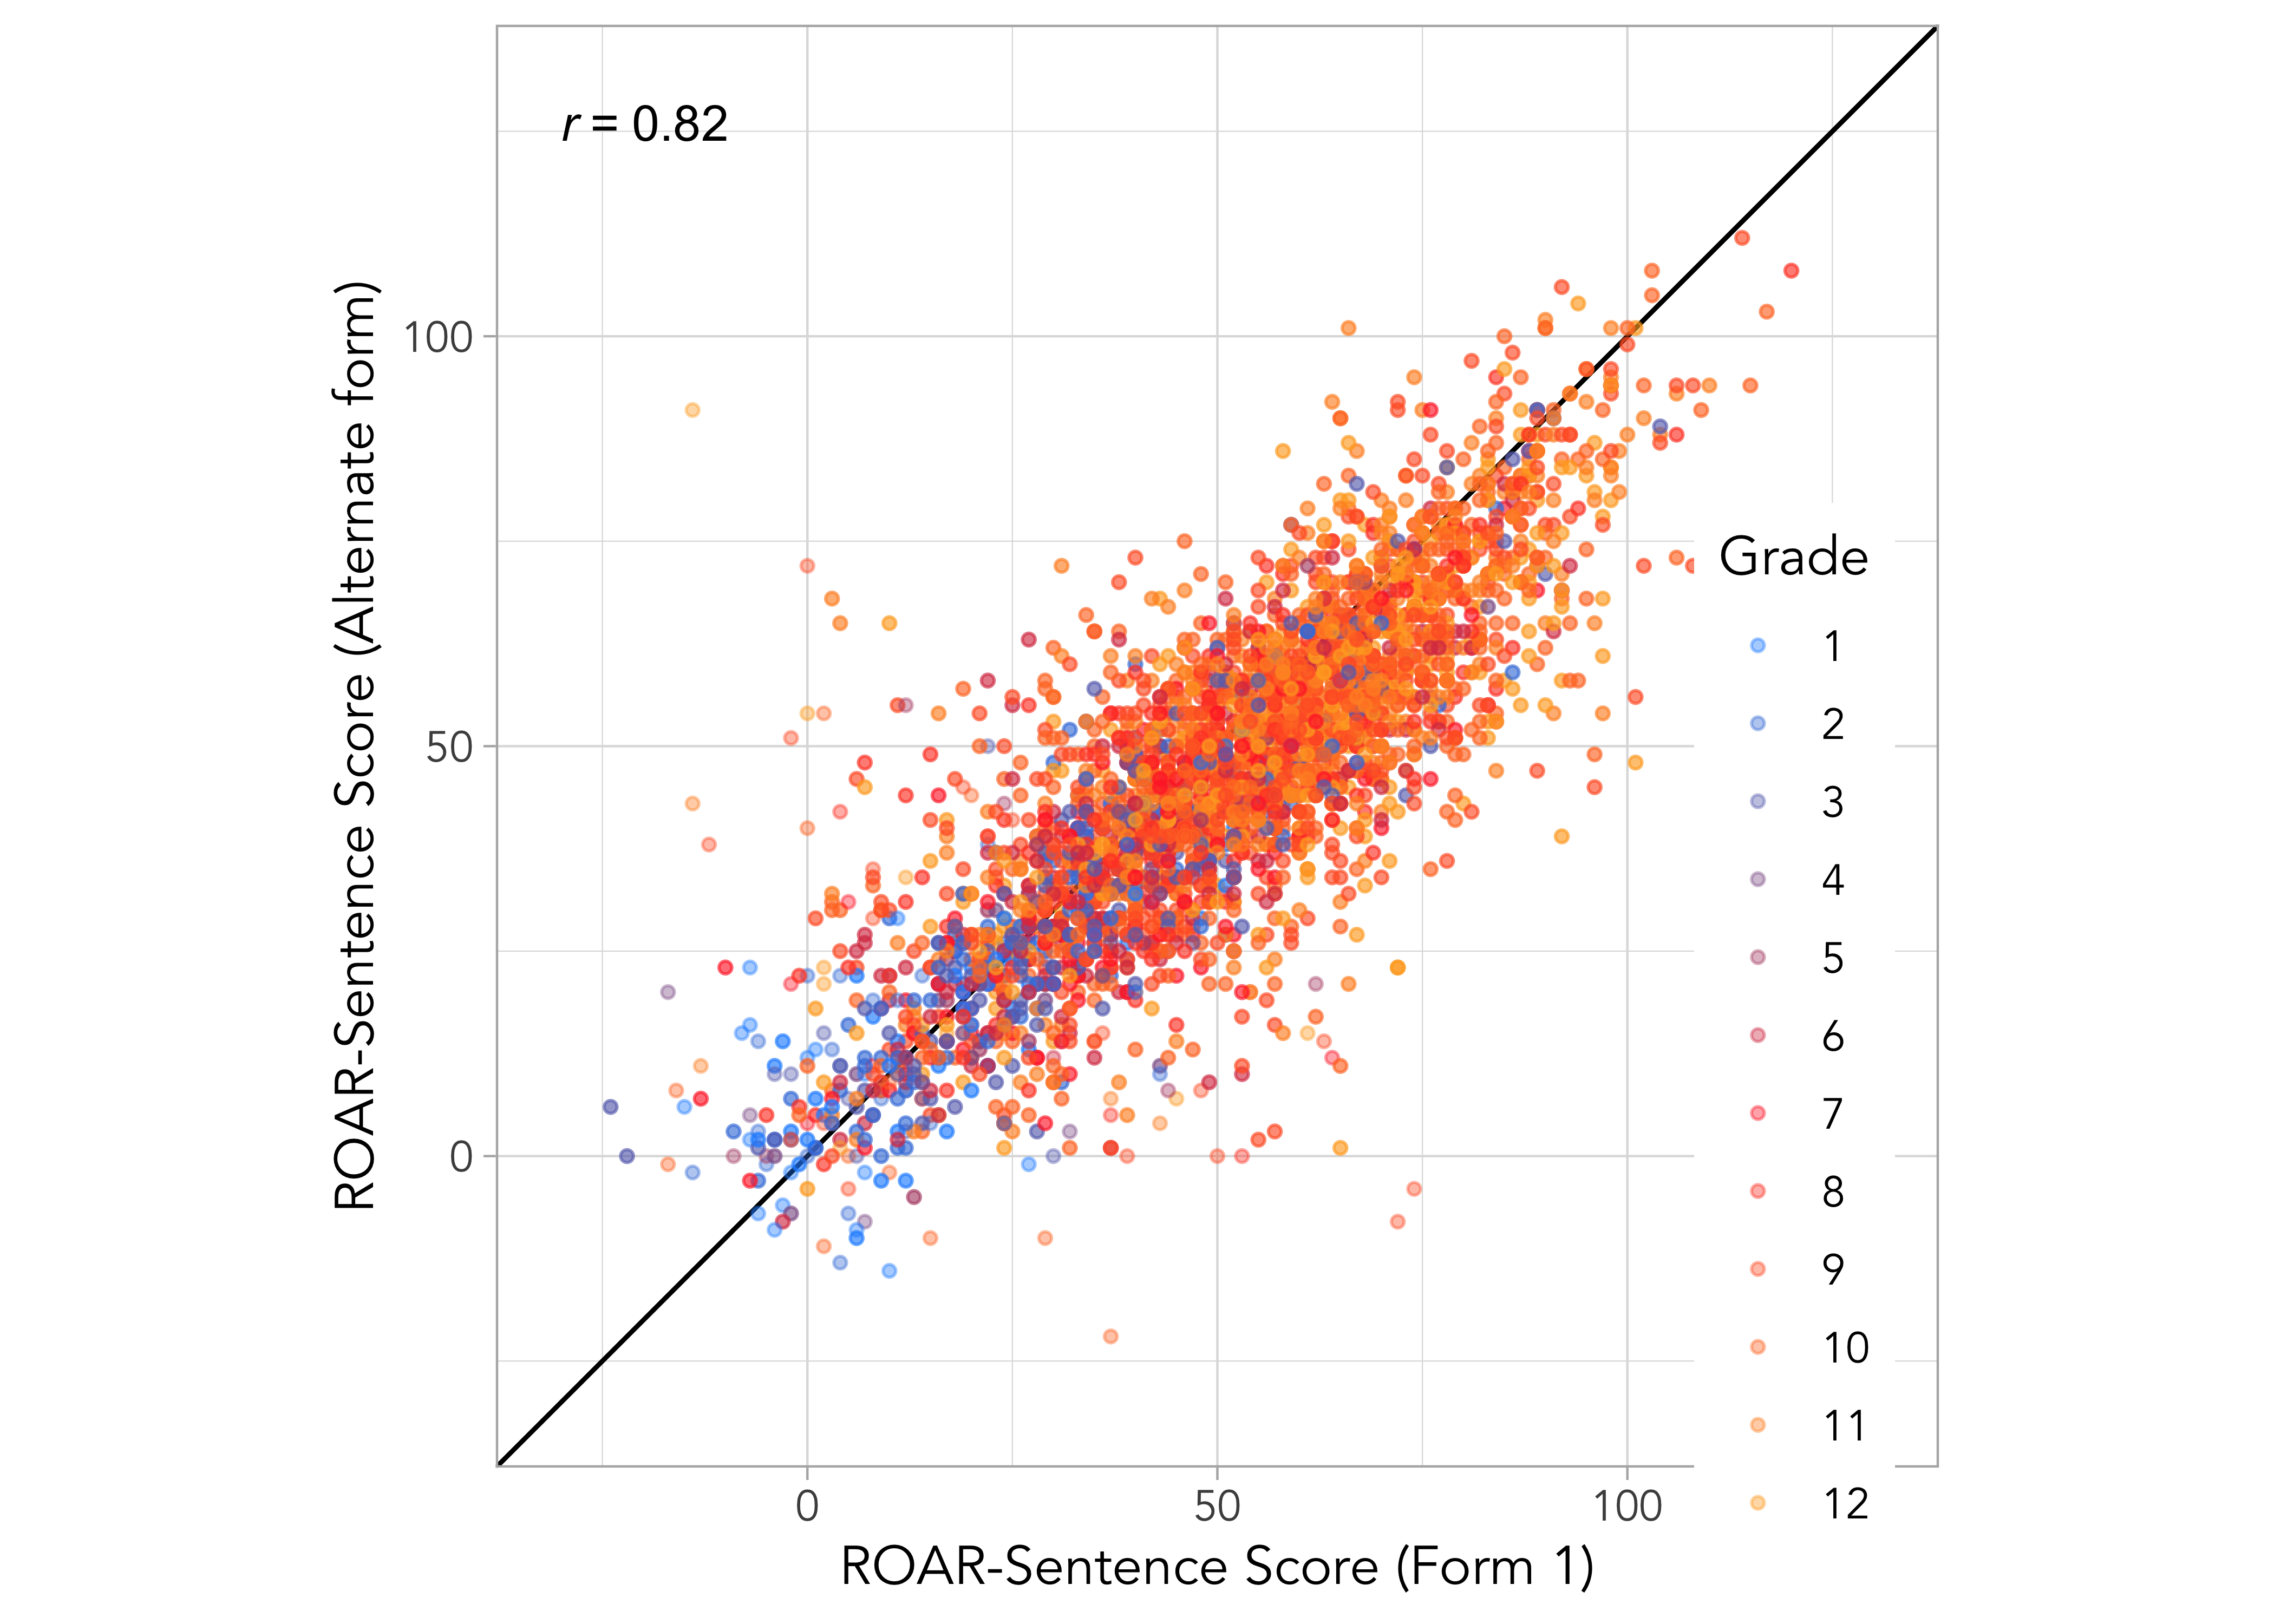
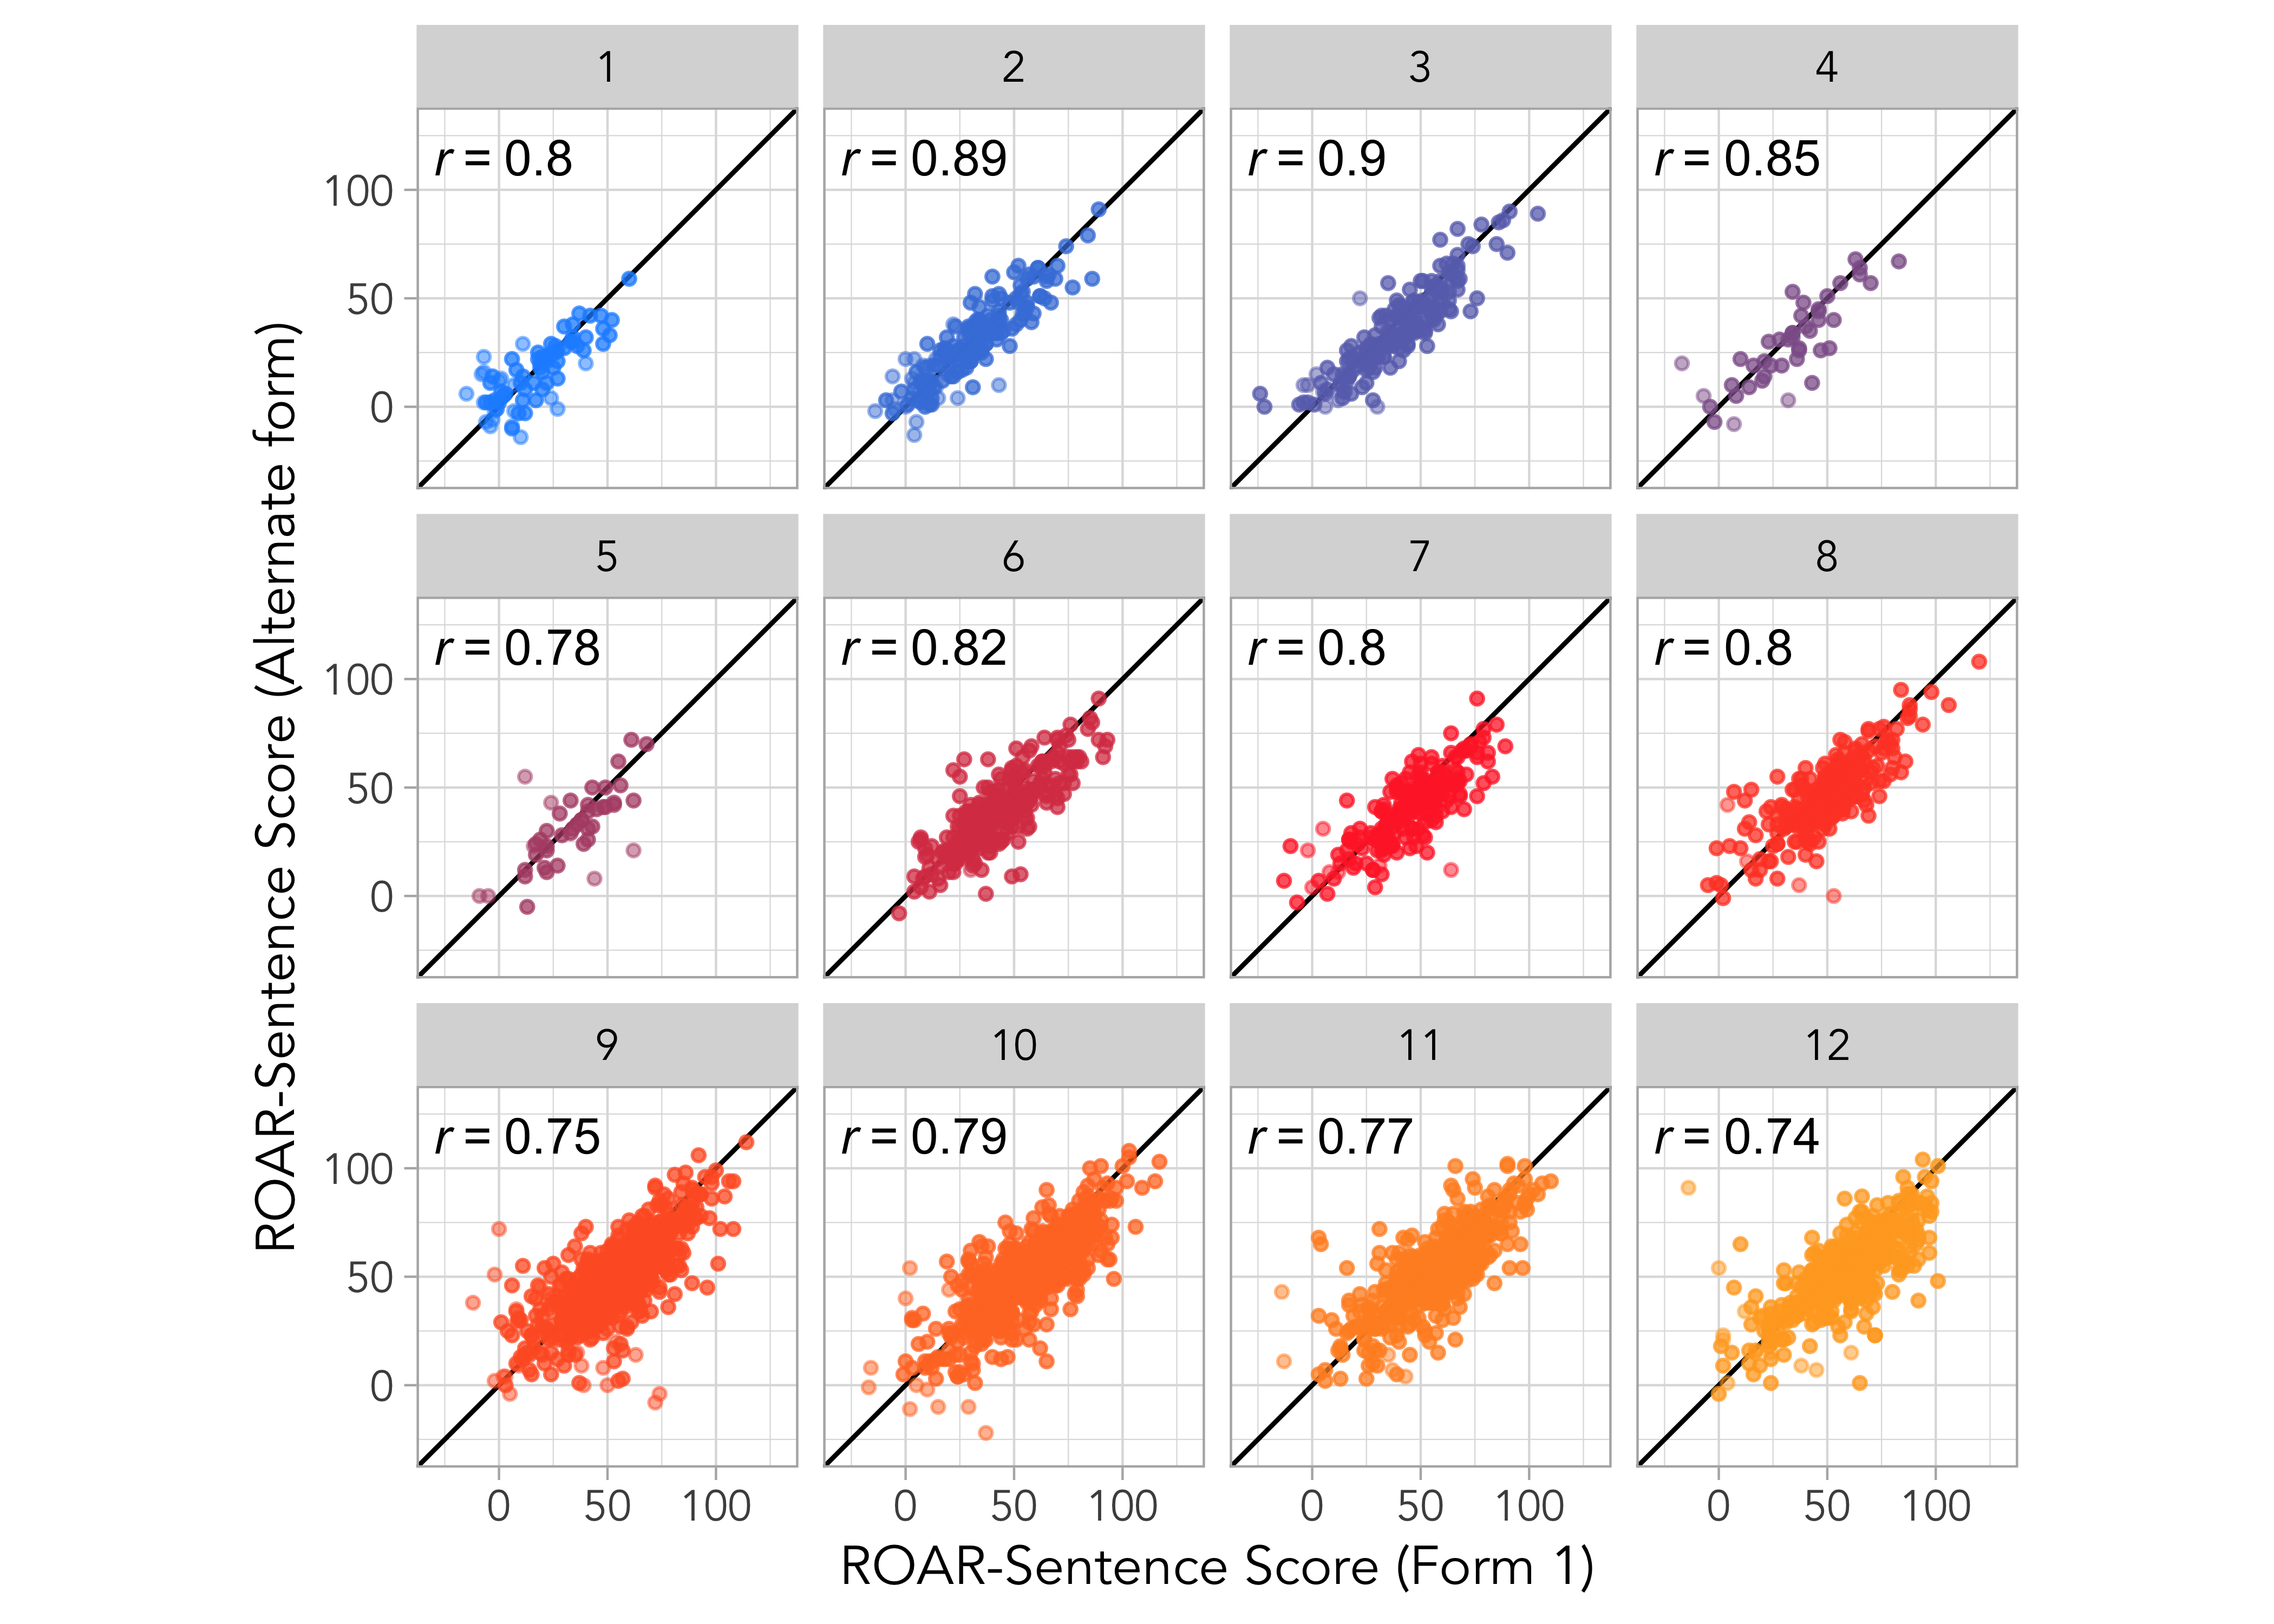
Alternate form reliability is computed as the Pearson correlation between scores on equated test forms that were administered during the same testing session. Figure 18.4 (a) shows a plot of student scores on alternate test forms combining grades and Figure 18.4 (b) shows separate plots for each grade. Table 18.1 reports alternate form reliability for the full sample and separately by grade.
| Grade | Alternate Form Reliability | 95% Confidence Interval | N |
|---|---|---|---|
| All | 0.82 | 0.81 to 0.83 | 3691 |
| 1 | 0.88 | 0.80 to 0.92 | 67 |
| 2 | 0.91 | 0.88 to 0.93 | 165 |
| 3 | 0.90 | 0.87 to 0.93 | 170 |
| 4 | 0.85 | 0.71 to 0.93 | 30 |
| 5 | 0.83 | 0.69 to 0.91 | 39 |
| 6 | 0.80 | 0.75 to 0.84 | 278 |
| 7 | 0.78 | 0.72 to 0.83 | 206 |
| 8 | 0.82 | 0.78 to 0.86 | 278 |
| 9 | 0.76 | 0.73 to 0.79 | 784 |
| 10 | 0.81 | 0.78 to 0.83 | 630 |
| 11 | 0.77 | 0.73 to 0.80 | 565 |
| 12 | 0.73 | 0.68 to 0.77 | 479 |
| Gender | Alternate Form Reliability | 95% Confidence Interval | N |
|---|---|---|---|
| All | 0.81 | 0.80 to 0.82 | 3335 |
| Female | 0.82 | 0.81 to 0.84 | 1659 |
| Male | 0.79 | 0.77 to 0.81 | 1676 |
| Free/Reduced Lunch Status | Alternate Form Reliability | 95% Confidence Interval | N |
|---|---|---|---|
| All | 0.90 | 0.88 to 0.92 | 402 |
| Free/Reduced | 0.92 | 0.87 to 0.95 | 77 |
| Paid | 0.89 | 0.87 to 0.91 | 325 |
| English Learner Status | Alternate Form Reliability | 95% Confidence Interval | N |
|---|---|---|---|
| All | 0.89 | 0.87 to 0.91 | 602 |
| English Learner | 0.91 | 0.89 to 0.93 | 238 |
| English Only | 0.85 | 0.82 to 0.88 | 300 |
| Initial Fluent English Proficient | 0.91 | 0.86 to 0.95 | 55 |
| Reclassified Fluency English Proficient | NA | NA | 9 |
| Home Language | Alternate Form Reliability | 95% Confidence Interval | N |
|---|---|---|---|
| All | 0.88 | 0.86 to 0.91 | 324 |
| English | 0.87 | 0.83 to 0.89 | 234 |
| Other | 0.90 | 0.84 to 0.94 | 61 |
| Spanish | 0.93 | 0.85 to 0.97 | 29 |
| Special Education | Alternate Form Reliability | 95% Confidence Interval | N |
|---|---|---|---|
| All | 0.92 | 0.90 to 0.94 | 330 |
| No | 0.92 | 0.90 to 0.93 | 327 |
| Yes | NA | NA | 3 |
| Hispanic/Latinx | Alternate Form Reliability | 95% Confidence Interval | N |
|---|---|---|---|
| All | 0.81 | 0.80 to 0.83 | 3409 |
| No | 0.81 | 0.80 to 0.82 | 3351 |
| Yes | 0.93 | 0.89 to 0.96 | 58 |
| Race | Alternate Form Reliability | 95% Confidence Interval | N |
|---|---|---|---|
| All | 0.80 | 0.78 to 0.81 | 3157 |
| Asian | 0.91 | 0.88 to 0.93 | 194 |
| Black/African American | 0.71 | 0.67 to 0.75 | 545 |
| Multiracial | 0.79 | 0.77 to 0.81 | 2052 |
| White | 0.86 | 0.83 to 0.88 | 366 |
References
Yeatman, Jason D, Jasmine E Tran, Amy K Burkhardt, Wanjing A Ma, Jamie L Mitchell, Maya Yablonski, Liesbeth Gijbels, Carrie Townley-Flores, and Adam Richie-Halford. 2024. “Development and Validation of a Rapid and Precise Online Sentence Reading Efficiency Assessment.” Frontiers in Education 9: 1494431. https://doi.org/10.3389/feduc.2024.1494431.
Zelikman, Wanjing and Tran, Eric and Ma. 2023. “Generating and Evaluating Tests for K-12 Students with Language Model Simulations: A Case Study on Sentence Reading Efficiency.” In Proceedings of the 2023 Conference on Empirical Methods in Natural Language Processing, edited by Juan and Bali Bouamor Houda and Pino, 2190–2205. Singapore: Association for Computational Linguistics. https://doi.org/10.18653/v1/2023.emnlp-main.135.