19  Reliability of ROAR-Letter

19.1 Reliability of calibration sample

A Rasch plus guessing model was fit to the ROAR-Letter calibration sample (see Table 8.1 and Table 8.2). All ROAR-Letter items fit the model well (see Chapter 4 for fit criteria). Calibration data were obtained from 5365 students who took ROAR-Letter. Two versions of ROAR-Letter were administered: 1668 students took the full, 88-item version with no time limit and 3697 students took a shorter version consisting of 10 letter names and up to 36 letter-sound items with a 5-minute time limit. Based on this IRT model, overall empirical reliability for ROAR-Letter was 0.87 (95% CI: 0.86 to 0.87).

Figure 19.1: Letter-CAT simulation based on item-response data from 5365 Kindergarten-2nd grade students. Items were sampled in three ways and empirical reliability was calculated as a function of the number of items completed. Optimal = items with difficulty closest to each student’s theta; Random = random sample; Worst = items with difficulty farthest from theta.

19.2 Reliability of computer-adaptive ROAR-Letter

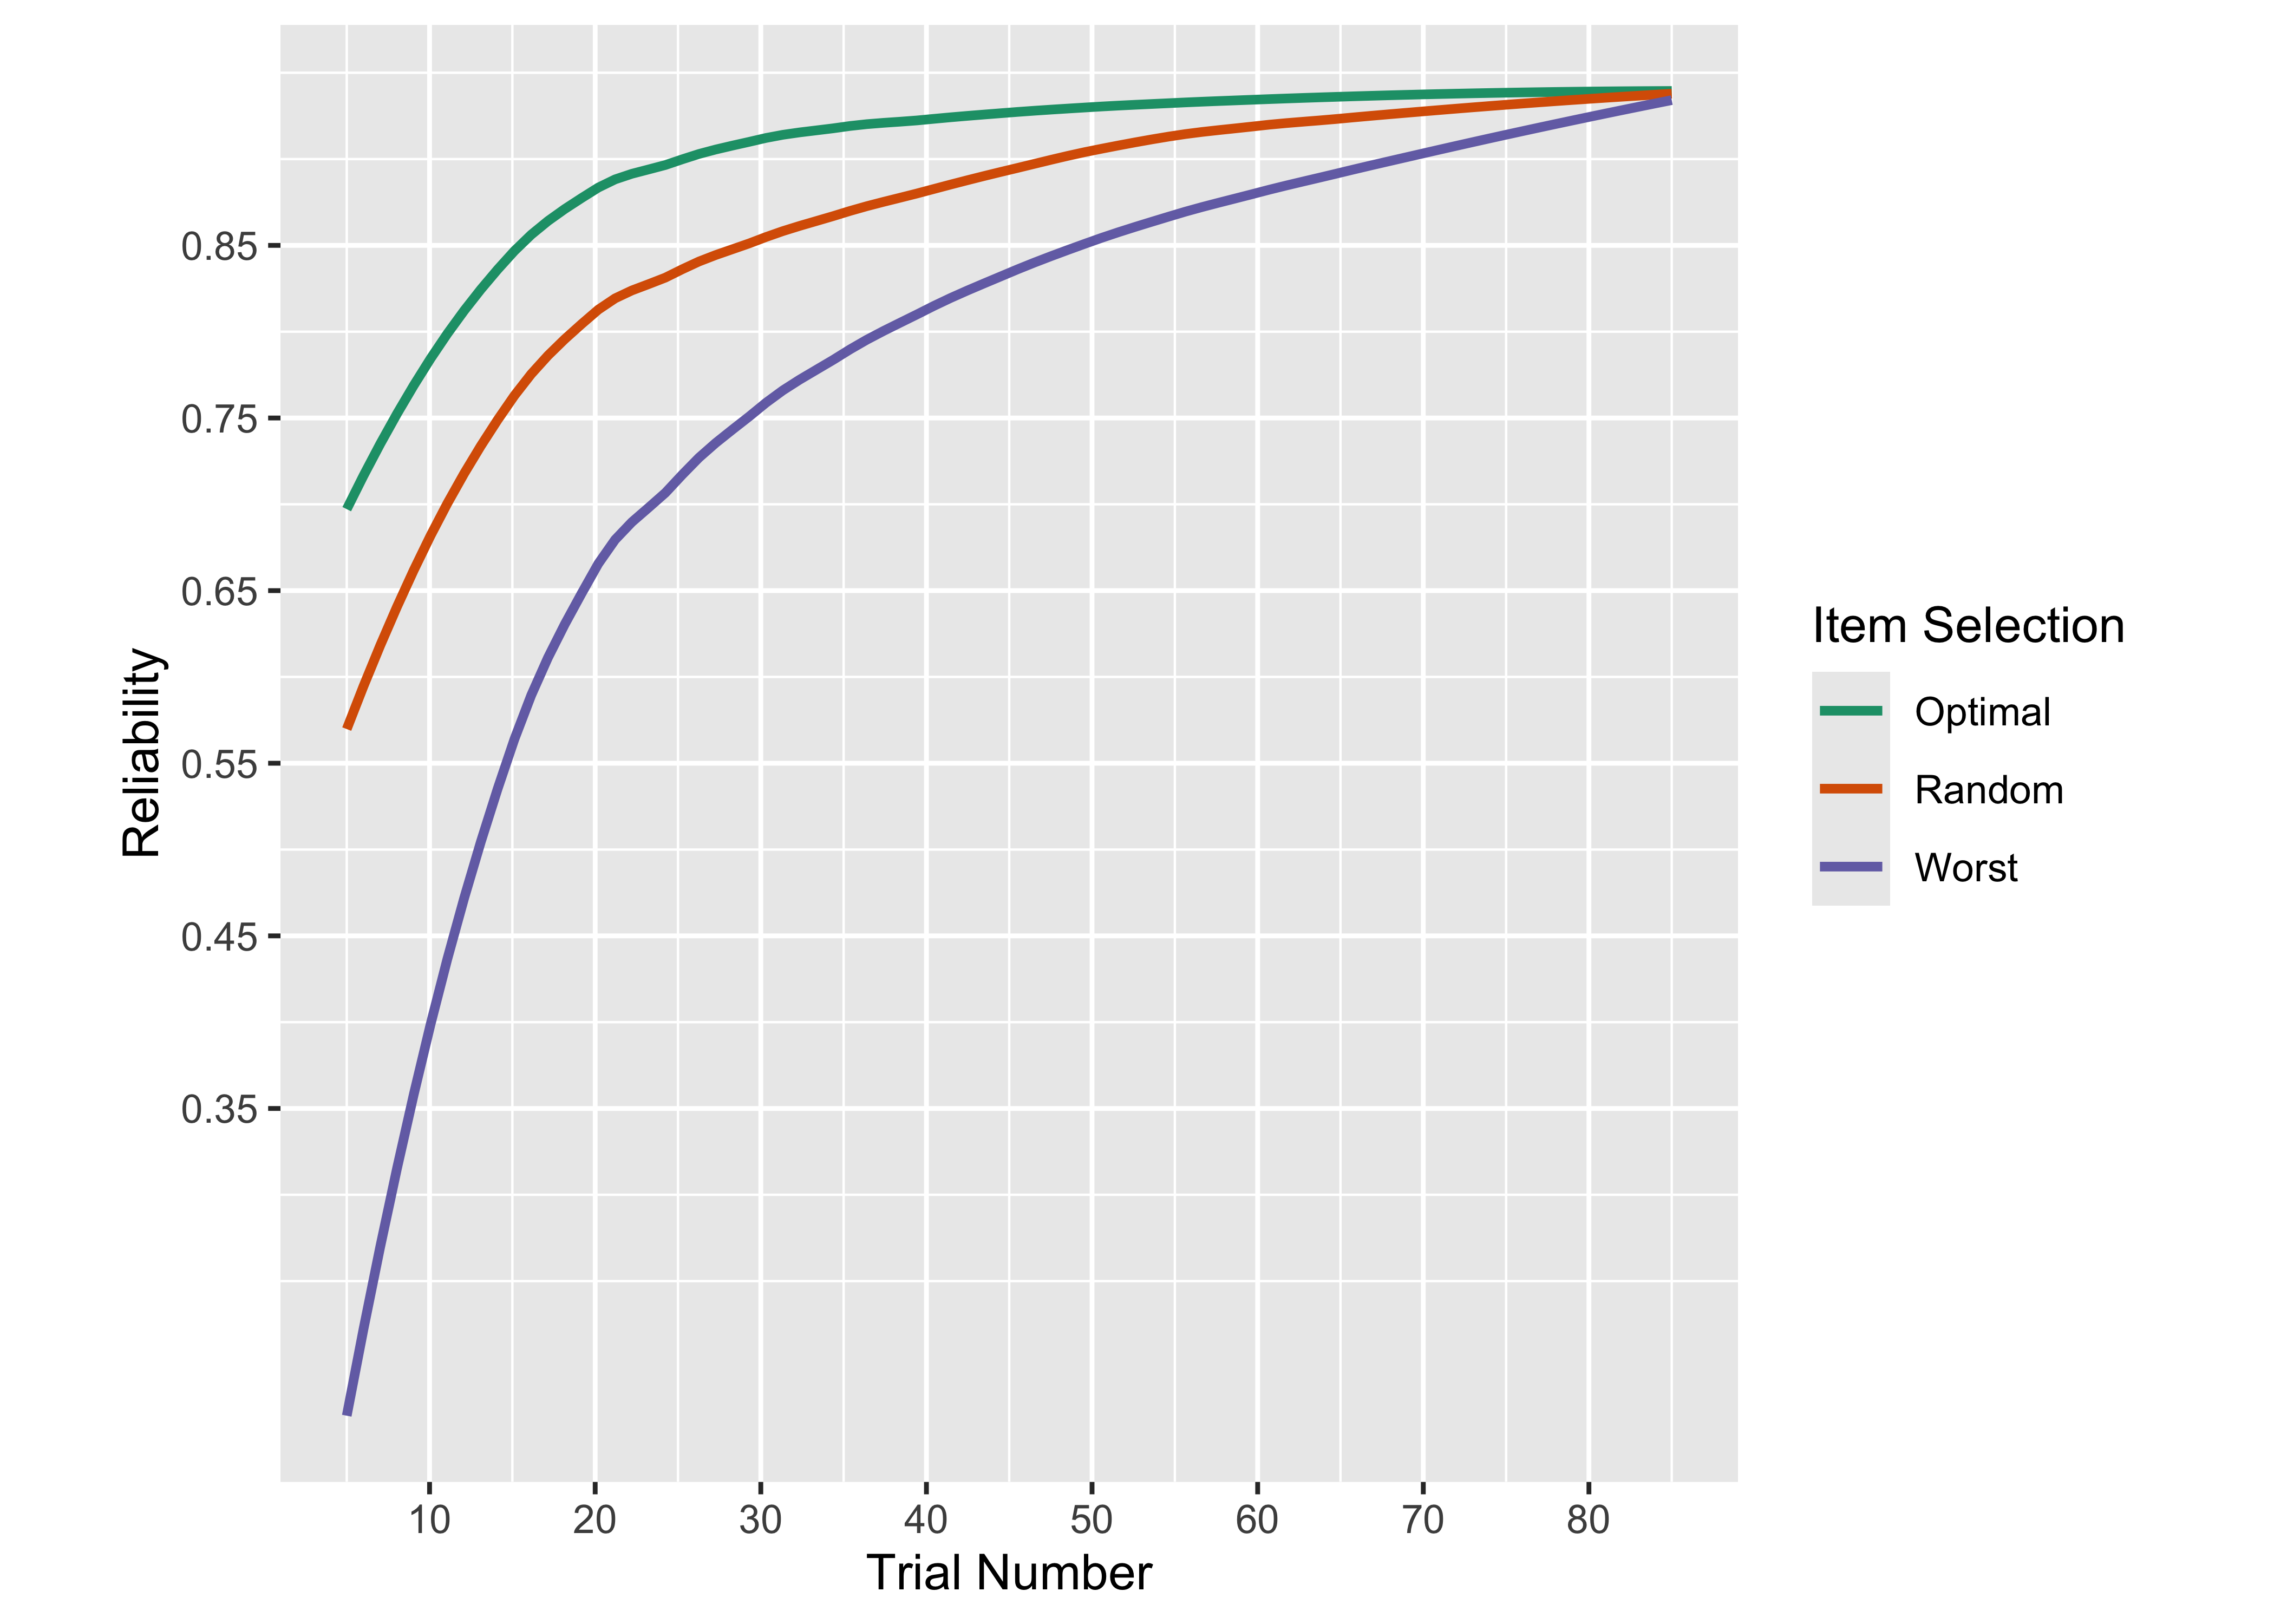
A computer-adaptive version of ROAR-Letter is more efficient than a fixed-length form while still providing reliable scores; however, it is important to consider the manner in which the items are selected. We ran a CAT simulation as described in (Ma et al. 2023) to determine the item selection criteria that would maximize reliability in the fewest number of trials (Figure 19.1). After selecting 25 trials as the most efficient number, we simulated a 25-trial computer adaptive test using participant responses.

Reliability (\(\rho_{xx^\prime}\)) is computed based on the estimated variance of \(\hat{\theta}\) relative to the estimated standard error (\(\widehat{SE}(\hat{\theta})^2\)) using Equation 24.1.

Students who answered every administered item correctly were excluded from the reliability calculation, since their theta and SE are determined by the prior rather than the data. After this filter, 4078 of 5178 calibration students remained (1100 excluded). Based on the 25-item optimal CAT, overall empirical reliability for ROAR-Letter was 0.86 (95% CI: 0.85 to 0.86).

Table 19.1 reports marginal reliability by grade, based on a 25-item simulation of an optimal item selection algorithm using participant data. To ensure that ROAR-Letter is fair and equitable for different demographic groups, we also report reliability by gender (Table 19.2), eligibility for free and reduced price lunch (Table 19.3), English learner status based on state of California designations (Table 19.4), primary language spoken (Table 19.5), special education (Table 19.6), ethnicity (Table 19.7), and race (Table 19.8).

Grade N Empirical Reliability 95% CI
All 4078 0.86 0.85 to 0.86
Kindergarten 2585 0.87 0.86 to 0.87
1 900 0.77 0.75 to 0.79
2 593 0.64 0.59 to 0.69
Table 19.1: Reliability of computer-adaptive ROAR-Letter by grade (simulated 25-item CAT)
Gender N Empirical Reliability 95% CI
All 2705 0.84 0.83 to 0.84
Female 1236 0.84 0.83 to 0.85
Male 1469 0.83 0.82 to 0.84
Table 19.2: Reliability of computer-adaptive ROAR-Letter by gender (simulated 25-item CAT)
Free/Reduced Lunch Status N Empirical Reliability 95% CI
All 589 0.78 0.74 to 0.80
Free/Reduced 317 0.81 0.78 to 0.84
Paid 272 0.69 0.61 to 0.75
Table 19.3: Reliability of computer-adaptive ROAR-Letter by free/reduced lunch status (simulated 25-item CAT)
English Learner Status N Empirical Reliability 95% CI
All 603 0.78 0.74 to 0.80
English Learner 237 0.81 0.77 to 0.84
English Only 328 0.73 0.67 to 0.78
Initial Fluent English Proficient 31 NA NA
Reclassified Fluency English Proficient 7 NA NA
Table 19.4: Reliability of computer-adaptive ROAR-Letter by English learner status (simulated 25-item CAT)
Home Language N Empirical Reliability 95% CI
All 584 0.77 0.74 to 0.80
English 403 0.72 0.67 to 0.77
Other 3 NA NA
Spanish 178 0.82 0.78 to 0.85
Table 19.5: Reliability of computer-adaptive ROAR-Letter by home language (simulated 25-item CAT)
Special Education (IEP) N Empirical Reliability 95% CI
All 576 0.78 0.75 to 0.80
No 512 0.77 0.74 to 0.80
Yes 64 0.81 0.69 to 0.86
Table 19.6: Reliability of computer-adaptive ROAR-Letter by special education status (simulated 25-item CAT)
Hispanic Ethnicity N Empirical Reliability 95% CI
All 2101 0.83 0.82 to 0.84
No 1292 0.80 0.78 to 0.81
Yes 809 0.86 0.85 to 0.87
Table 19.7: Reliability of computer-adaptive ROAR-Letter by Hispanic ethnicity (simulated 25-item CAT)
Race N Empirical Reliability 95% CI
All 1452 0.84 0.83 to 0.85
American Indian/Alaska Native 41 NA NA
Asian 167 0.74 0.66 to 0.79
Black/African American 279 0.81 0.78 to 0.84
Multiracial 26 NA NA
Native Hawaiian/Other Pacific Islander 28 NA NA
White 911 0.86 0.84 to 0.87
Table 19.8: Reliability of computer-adaptive ROAR-Letter by race (simulated 25-item CAT). Groups with N < 50 are not reported.

References

Ma, Wanjing A, Adam Richie-Halford, Klint Burkhardt Amy and Kanopka, Clementine Chou, and Jason D Domingue Benjamin and Yeatman. 2023. ROAR-CAT: Rapid Online Assessment of Reading Ability with Computerized Adaptive Testing.”