3 ROAR Scores and Norms
ROAR has been developed through a collaborative, co-design process with schools around the United States. The development, validation, score-reporting, and norming samples reflect the contributions of hundreds of schools that have collaborated with the ROAR team through a Research Practice Partnership (RPP) model (Laura Wentworth et al. 2023; L. Wentworth et al. 2021). The goal of this model is to make sure that the diverse interests of stakeholders (teachers, students, parents, school administrators, etc.) representing the incredible diversity in the U.S. education system have a voice in guiding the research and development process of the tools used in their schools. Section 3.2 shows the distribution of ROAR partner schools around the United States.
3.1 ROAR Scores
The ROAR assessment score reports include different types of scores that each have intended use cases. The ROAR Next Steps Guide provides detailed descriptions of how to interpret scores and use them to guide instruction and/or intervention. The ROAR Family Guide provides an explanation of scores and a guide for support at home, designed for parents and guardians.
One important consideration for interpreting scores on any assessment is participant effort, concentration, and engagement. A score is only an accurate representative of the participant’s ability level if the participant is engaged and tries their hardest even as the assessment gets difficult. For assessments that are individually administered (e.g. by a teacher), the administrator might get a qualitative impression of the participant’s effort and focus. If the same person is administering the assessment and interpreting the scores (e.g. classroom teacher or reading specialist), this qualitative impression can be helpful. However it can also be a source of bias and it is hard to standardize the criteria for judging engagement. For automated, online assessments like ROAR, participant disengagement might be a particular concern and needs to be considered when interpreting scores. Validated ROAR measures have defined criteria, grounded in research, for identifying disengaged participants and flagging unreliable scores (for example see Section 17.2 and Section 18.2). This criteria is defined in an algorithm that takes into account a) the response time distribution and b) pattern of responses on the assessment. Scores for any participant that are flagged for disengagement or other issues that might affect the interpretation of the score are flagged in the ROAR Score Report. Figure 3.5 shows an example ROAR Score Table indicating which students need support in Phonological Awareness, Single Word Reading and Sentence Reading Efficiency and disengaged participants with unreliable data are flagged with grayed out scores (dialog box provides additional information).
Types of Scores
Raw Scores and Scaled Scores: A raw score is the basic measure of a student’s performance on the test. A scaled score puts the raw score on an interval scale to make it more interpretable for practitioners. Each assessment reports a raw score and the scoring rules for that raw score are detailed in the introduction to that assessment (for example, see Section 5.4 for the scoring rules for ROAR-Word). Most of the assessments use item response theory (IRT; see Section 4.2) and computer adaptive testing (CAT; see Chapter 4) for scoring, though some timed assessments like ROAR-Sentence (see Section 6.4) use other types of scoring models. All assessments that use an IRT model for scoring report Scaled Scores. Scaled Scores are comparable across grades and over time and are useful for tracking growth in reading skills (e.g., response to intervention (RTI)).
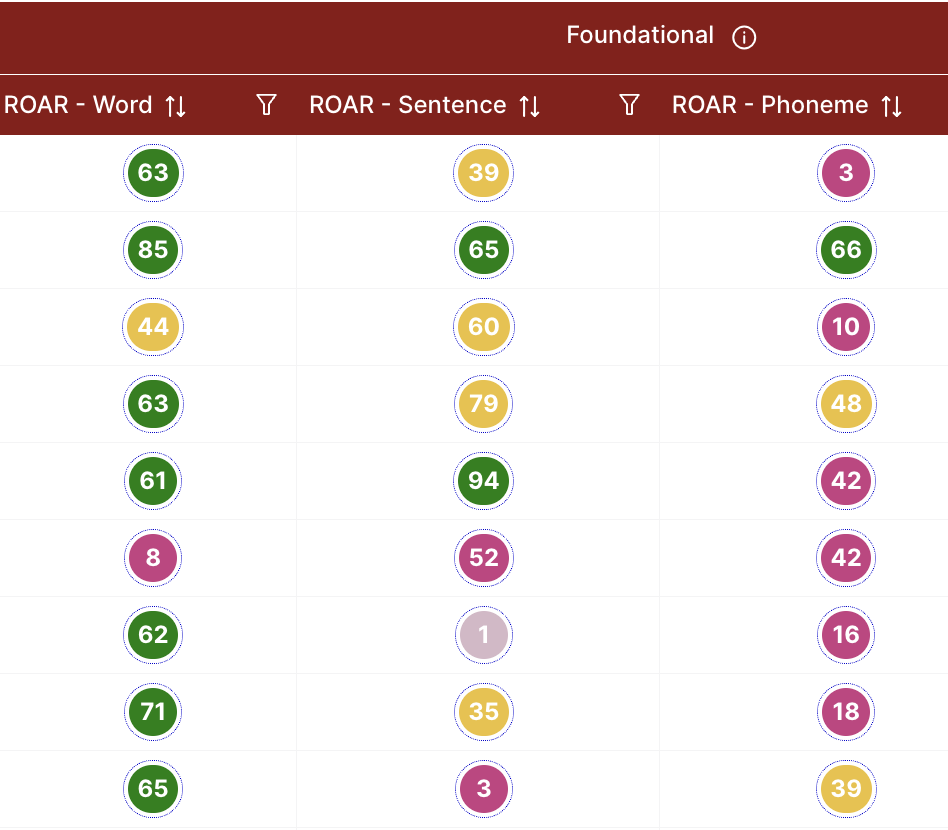
Percentile Scores: The percentile refers to a student’s rank within their grade level on the given skill. The percentile is the number of students out of 100 who have lower scores. Percentile scores are computed by comparing raw scores to a norming table. A norming table captures the distribution of scores for each age bin in a lookup table providing the percentiles associated with each raw score. Percentile scores are useful for identifying students who are struggling relative to their peers (or relative to national norms). Figure 3.6 (a) shows a screenshot from ROAR Score Reports displaying Percentile Scores. The norming table for percentile scores are computed using Generalized Additive Models for Location, Scale and Shape (GAMLSS) to model raw ROAR test scores and to predict corresponding age-based percentiles.
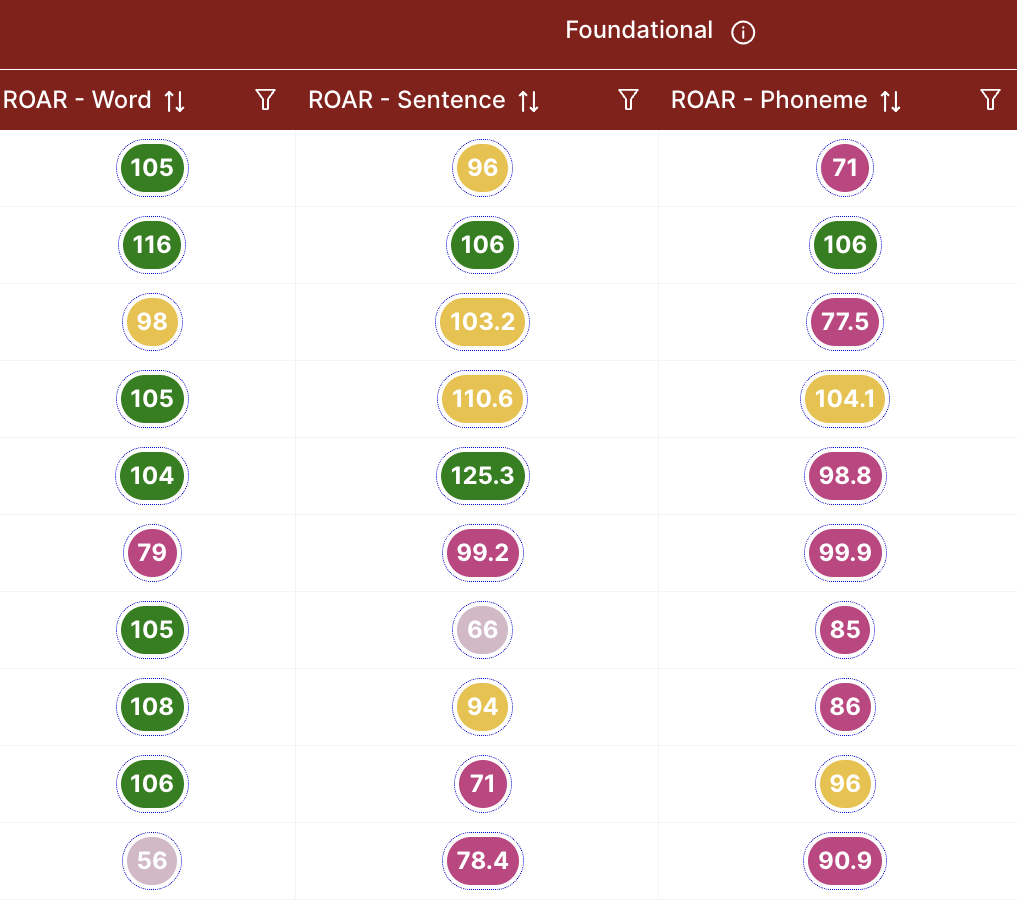
Standard Scores: A standard score is a way of showing how performance compares to other kids of the same age or grade. The standard score is comparable within a grade level, but not across grade levels or over time. Figure 3.6 (b) shows a screenshot from ROAR Score Reports displaying standard scores. Age standardized scores for ROAR-Word put scores for each age bin on a standard scale (normal distribution, \(\mu=100\), \(\sigma=15\), see Figure 3.3) and are computed using Generalized Additive Models for Location, Scale and Shape (GAMLSS) to output age-based standard percentiles which can be converted to z-scores. (see Section 3.4 for more information).
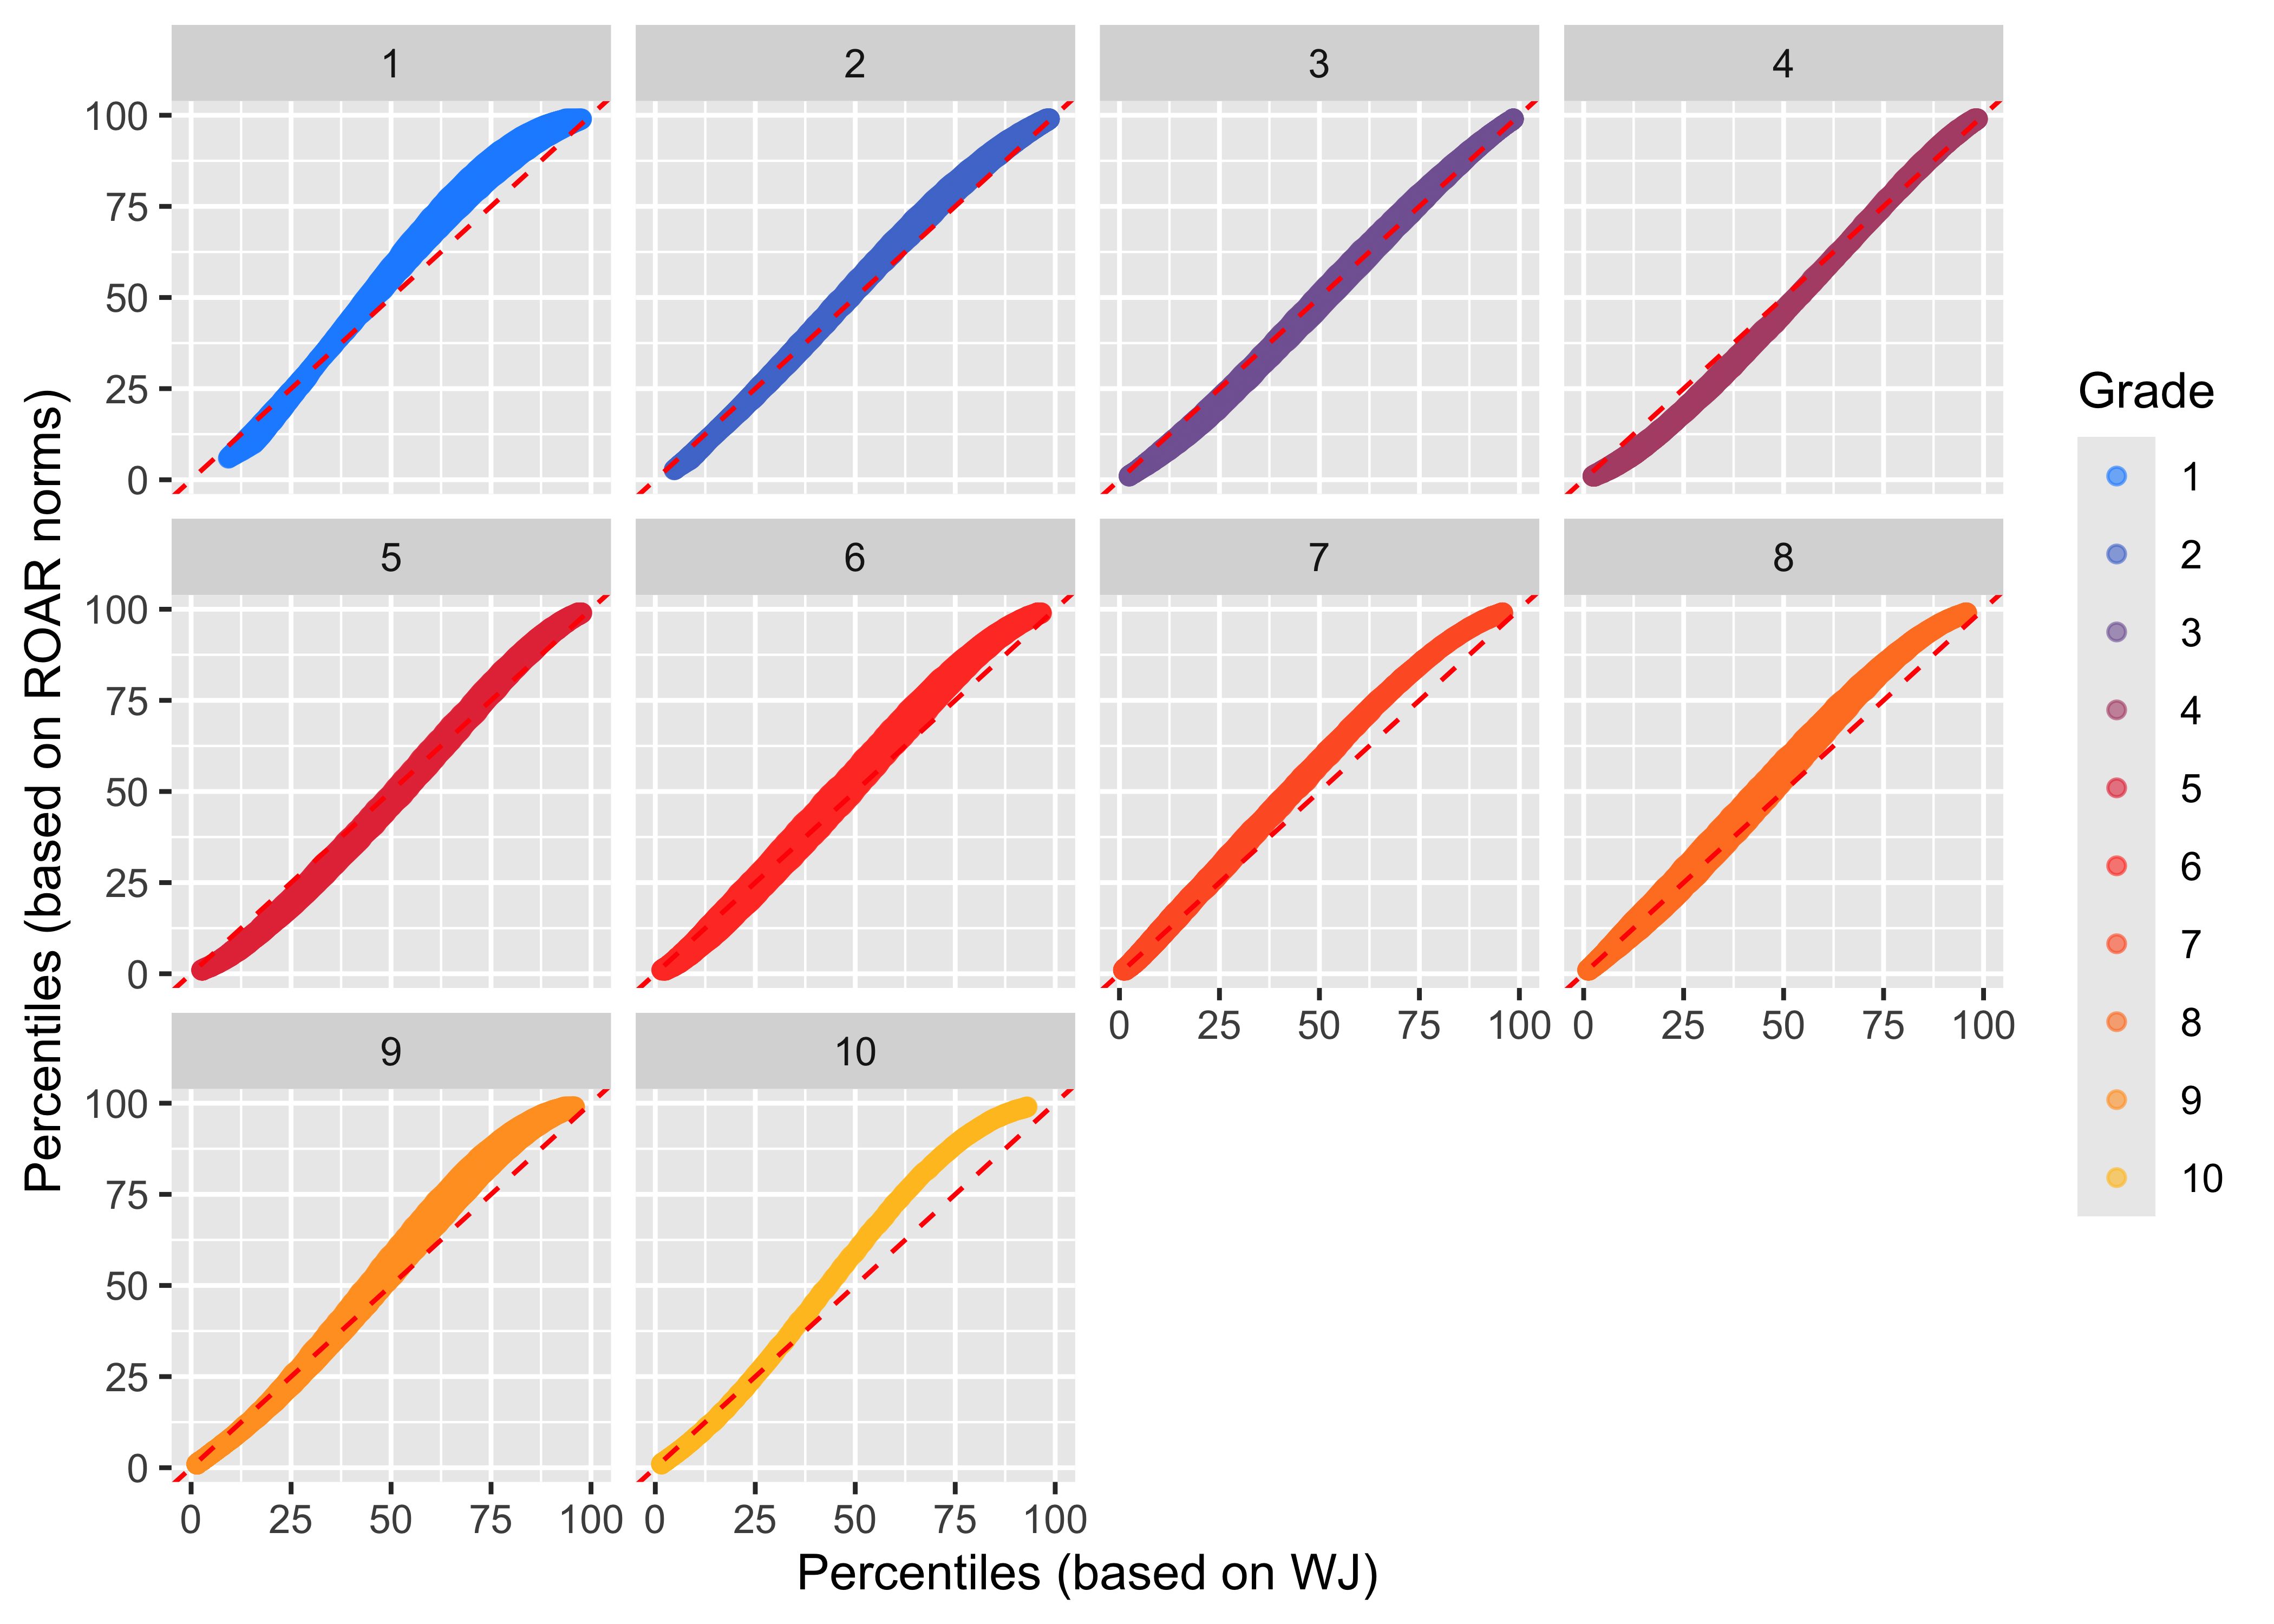
The ROAR norming table which comprises raw scores, scaled scores (for IRT- and CAT-based assessments), age-based standard scores, and age-based percentiles were compared to the linking of ROAR scores to criterion measures such as WJ BRS Standard Scores and Percentiles in the case of ROAR-Word (Section 27.1.1) and CTOPP Standard Scores in the case of ROAR-Phoneme (Chapter 29). This linking allowed ROAR scores to be interpreted with direct reference to the criterion measure that is often used to define dyslexia risk and to validate the GAMLSS created norms (Figure 3.9).
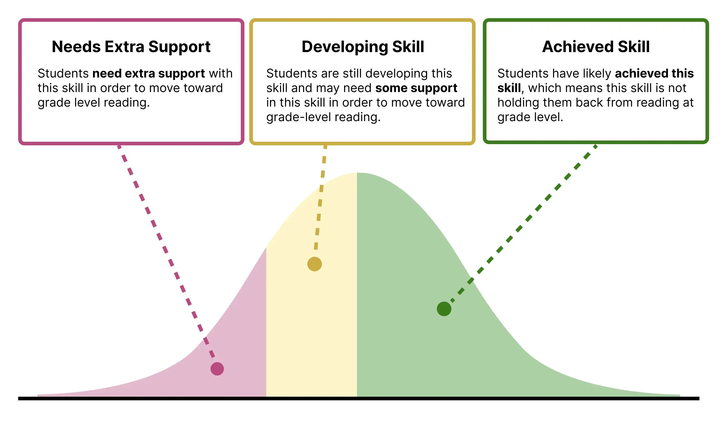
- Support Categories: For each measure, ROAR recommends students who are in need of extra support. Support categories can also be interpreted as indicating risk of reading difficulties such as dyslexia (for more information see Chapter 32 and Chapter 10). Dyslexia refers to the lower end of a continuum of reading skills and there is no agreed upon cutoff.
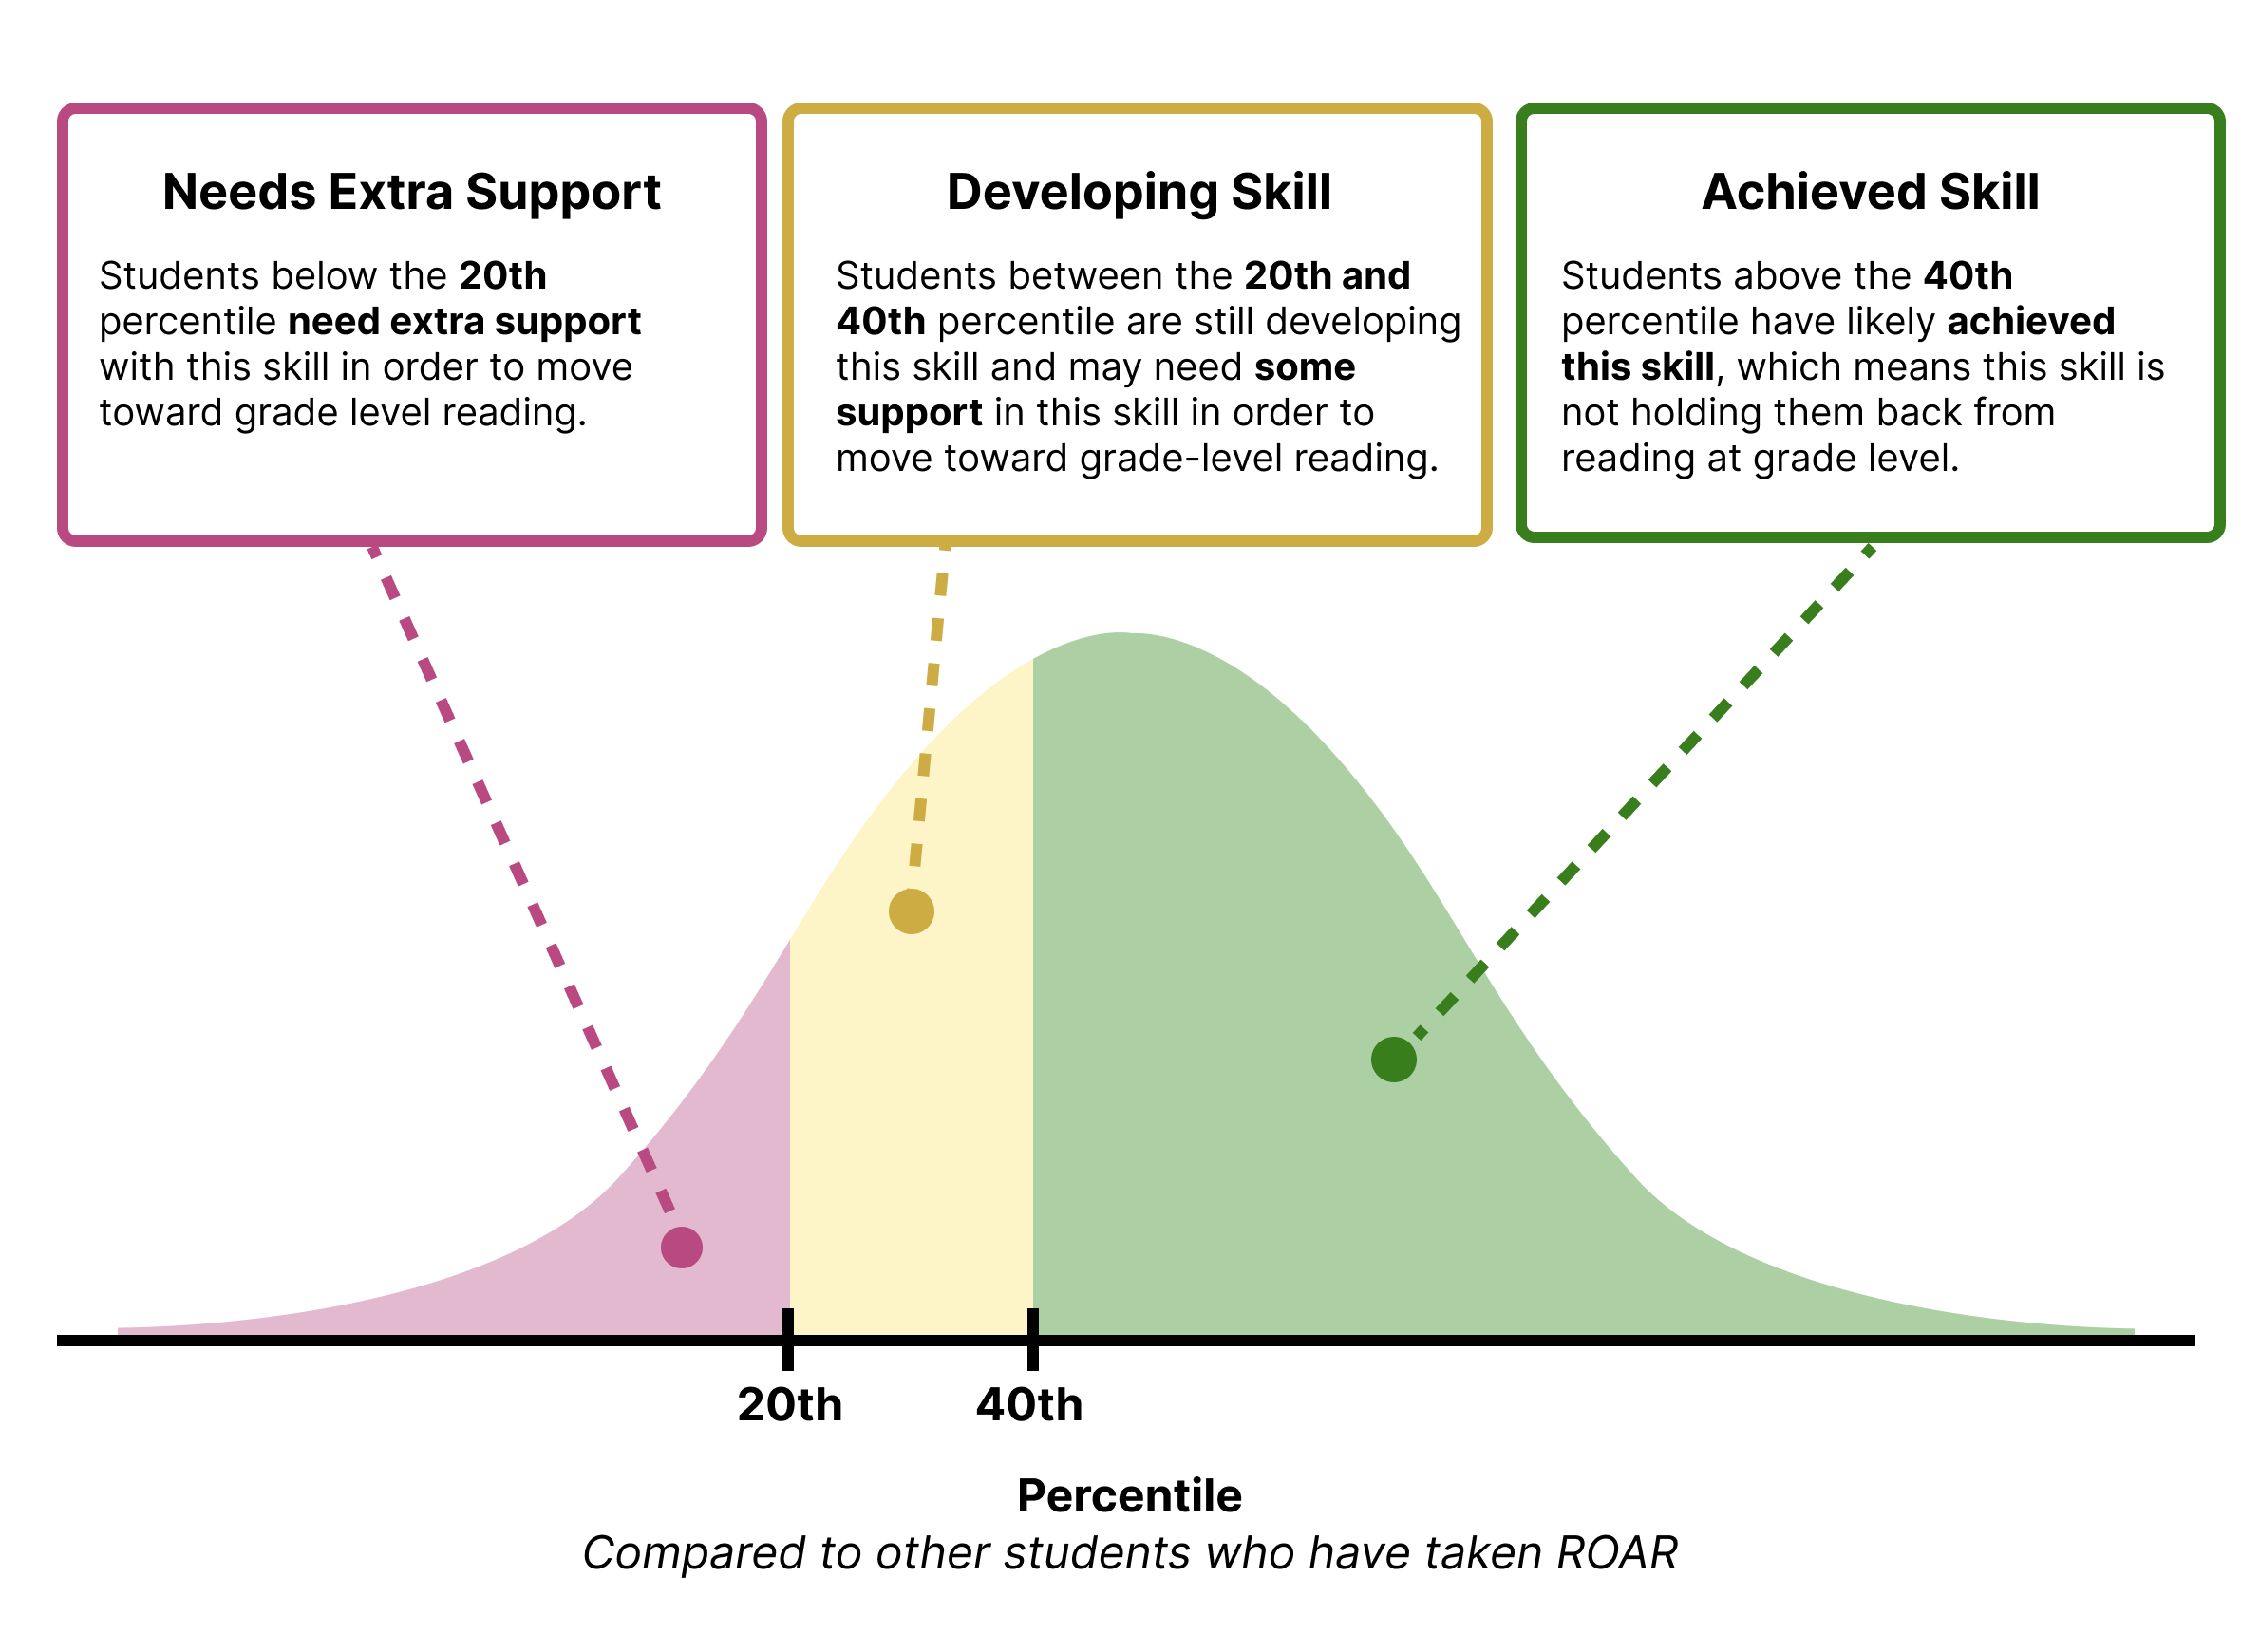
For students in Kindergarten through 5th grade, percentiles are used to determine ROAR Support Categories. The 20th percentile based on national norms is a common cutpoint that is used to indicate students who are in need of additional support and that is the cut point implemented in ROAR Support Categories. Students below the 20th percentile are recommended for additional support. Students between the 20th and 40th percentile are indicated that the skill is still developing. Students above the 40th percentile are indicated as being at grade level (achieved skill).
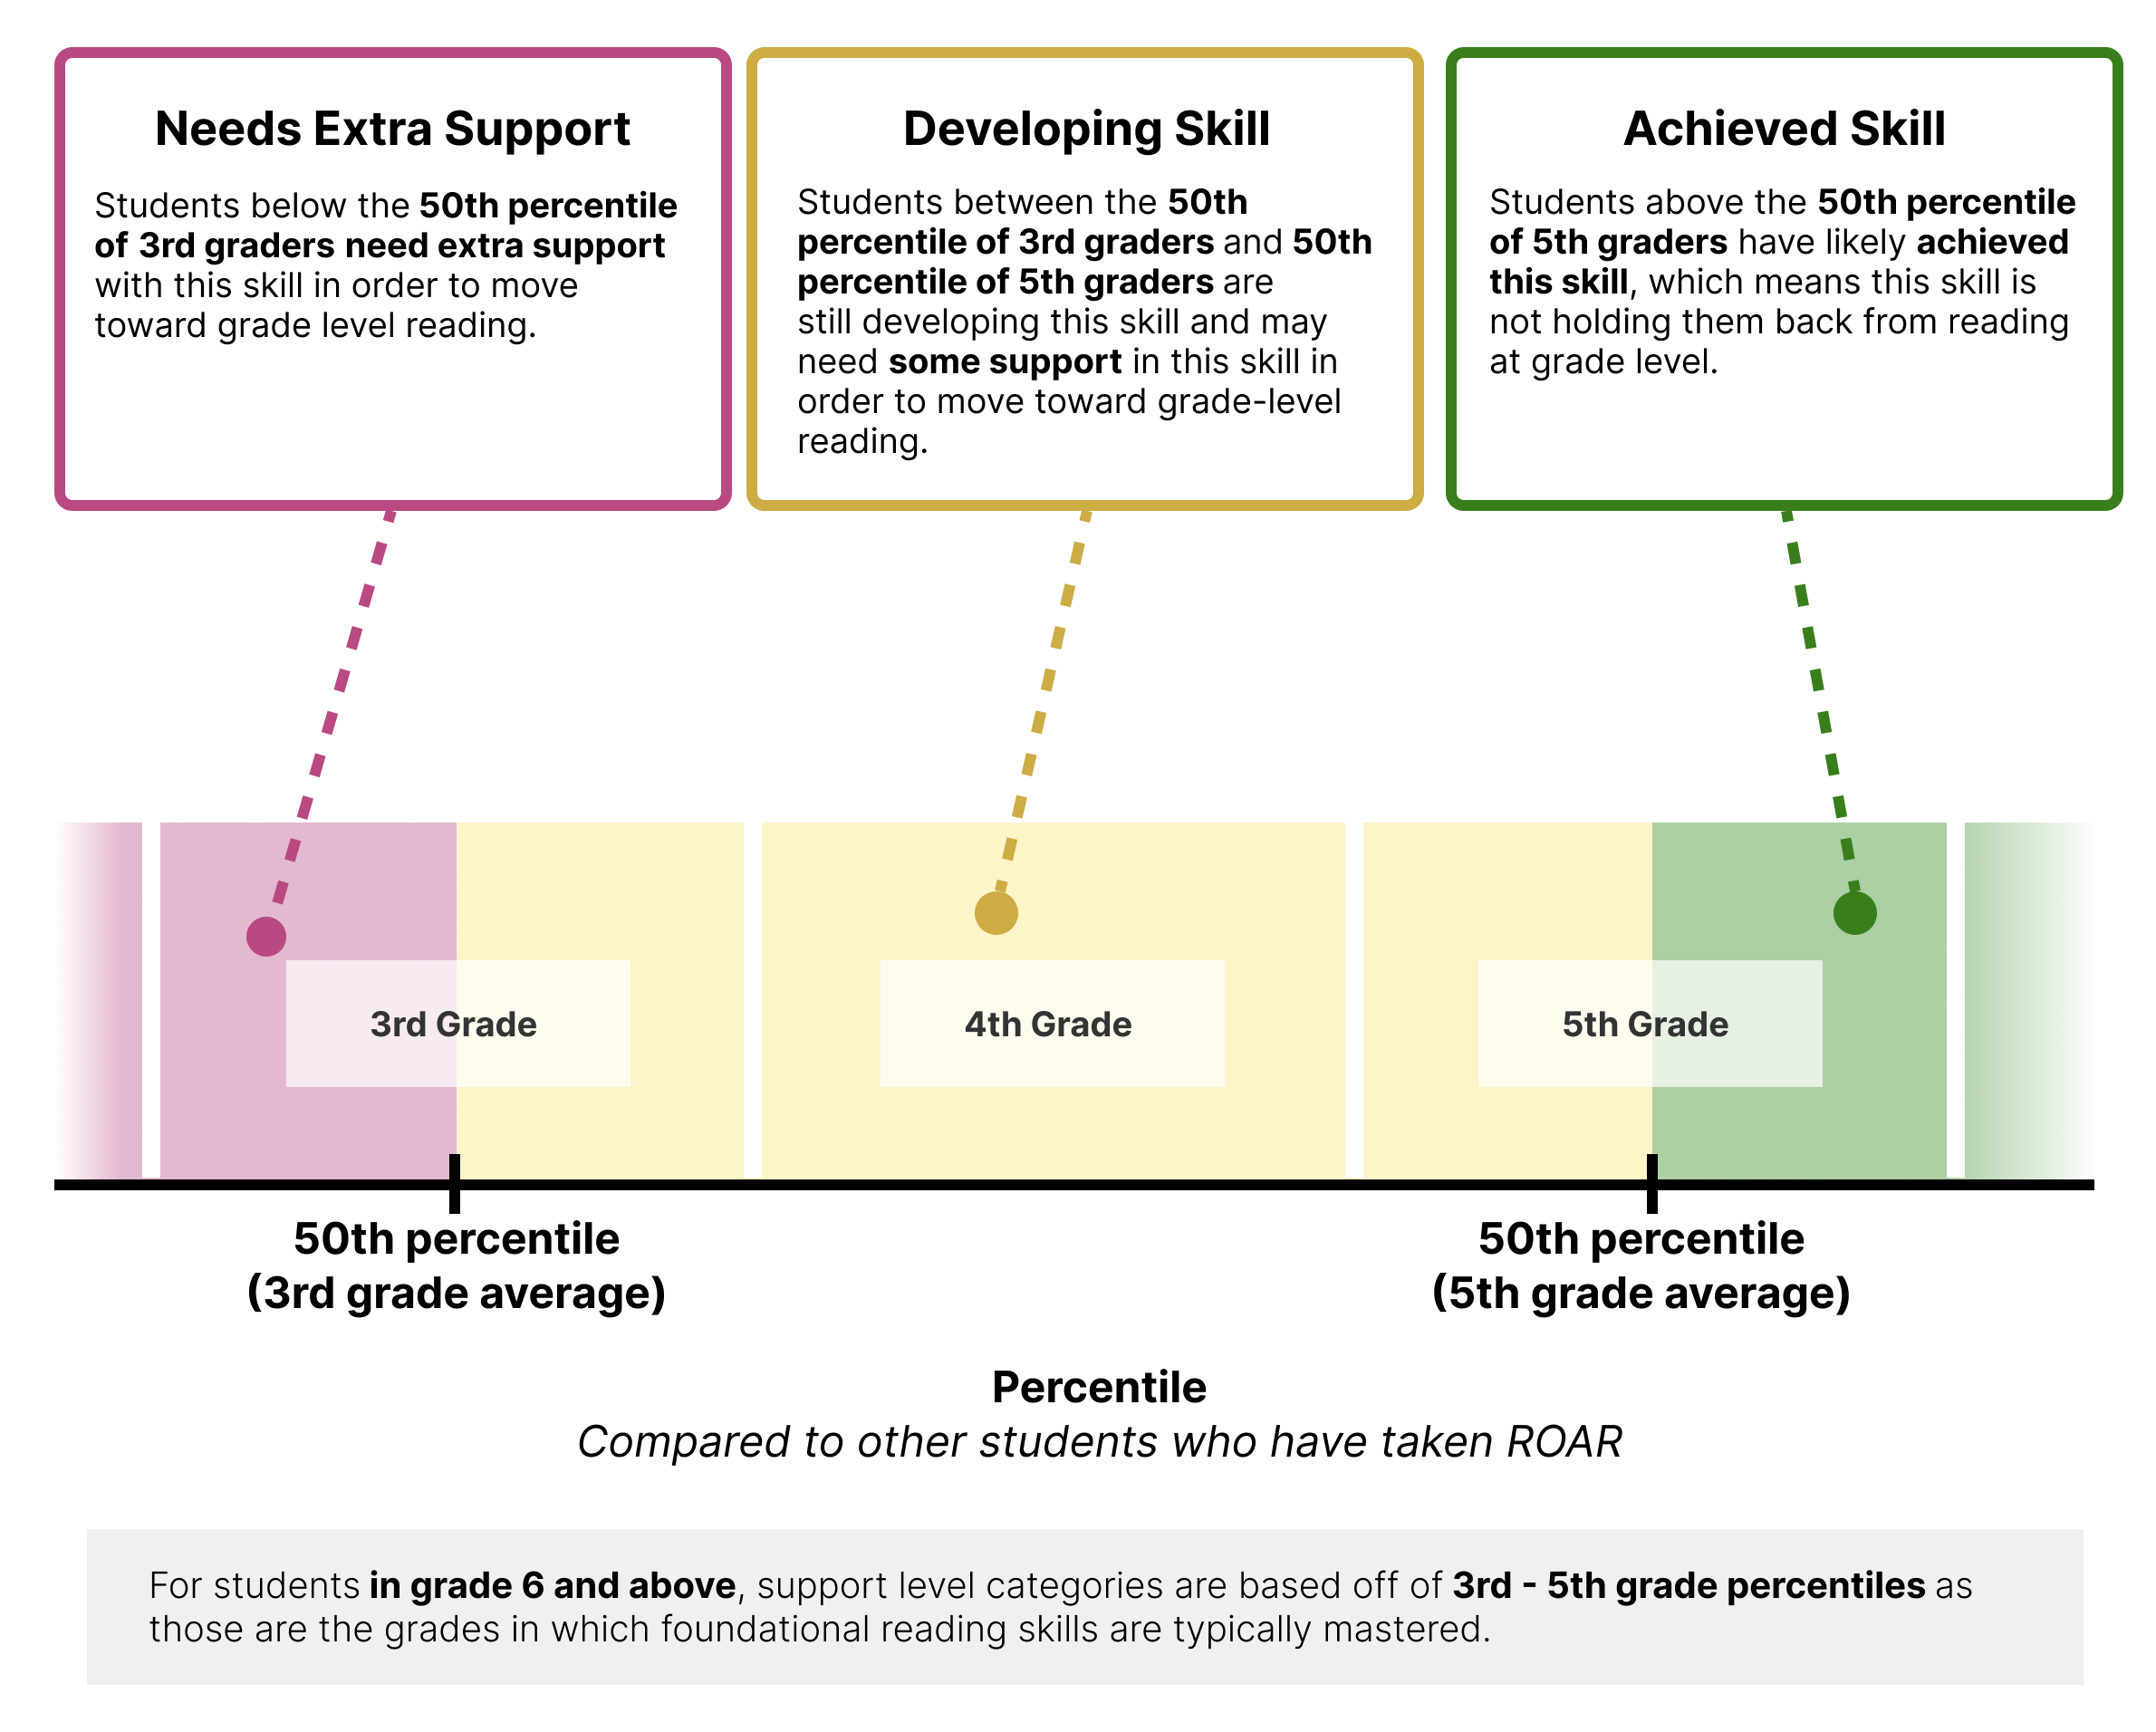
For students in 6th through 12th grade, support categories are determined relative to the “Decoding Threshold”, or specific cut-points that represent a meaningful bottleneck for reading development (see Section 36.2.3 and Chapter 37 for more information on the Decoding Threshold). The cut-points determined by the decoding threshold also correspond to 3rd grade and 5th grade median scores (50th percentile) for each individual assessment.
The “Decoding Threshold Hypothesis” posits that students below a certain proficiency level in Foundational Reading Skills will experience stagnant comprehension growth as they struggle with basic word recognition (Figure 37.1, Figure 37.2). 3rd grade and 5th grade median scores were determined to match the transition zones. Students in grades 6th through 12th grade that score below the 3rd grade median are recommended for additional support. Students in these grades that score between the 3rd and 5th grade median are indicated that the skill is still developing. 6th through 12th grade students who score above the 5th grade median are indicated as having achieved the skill.
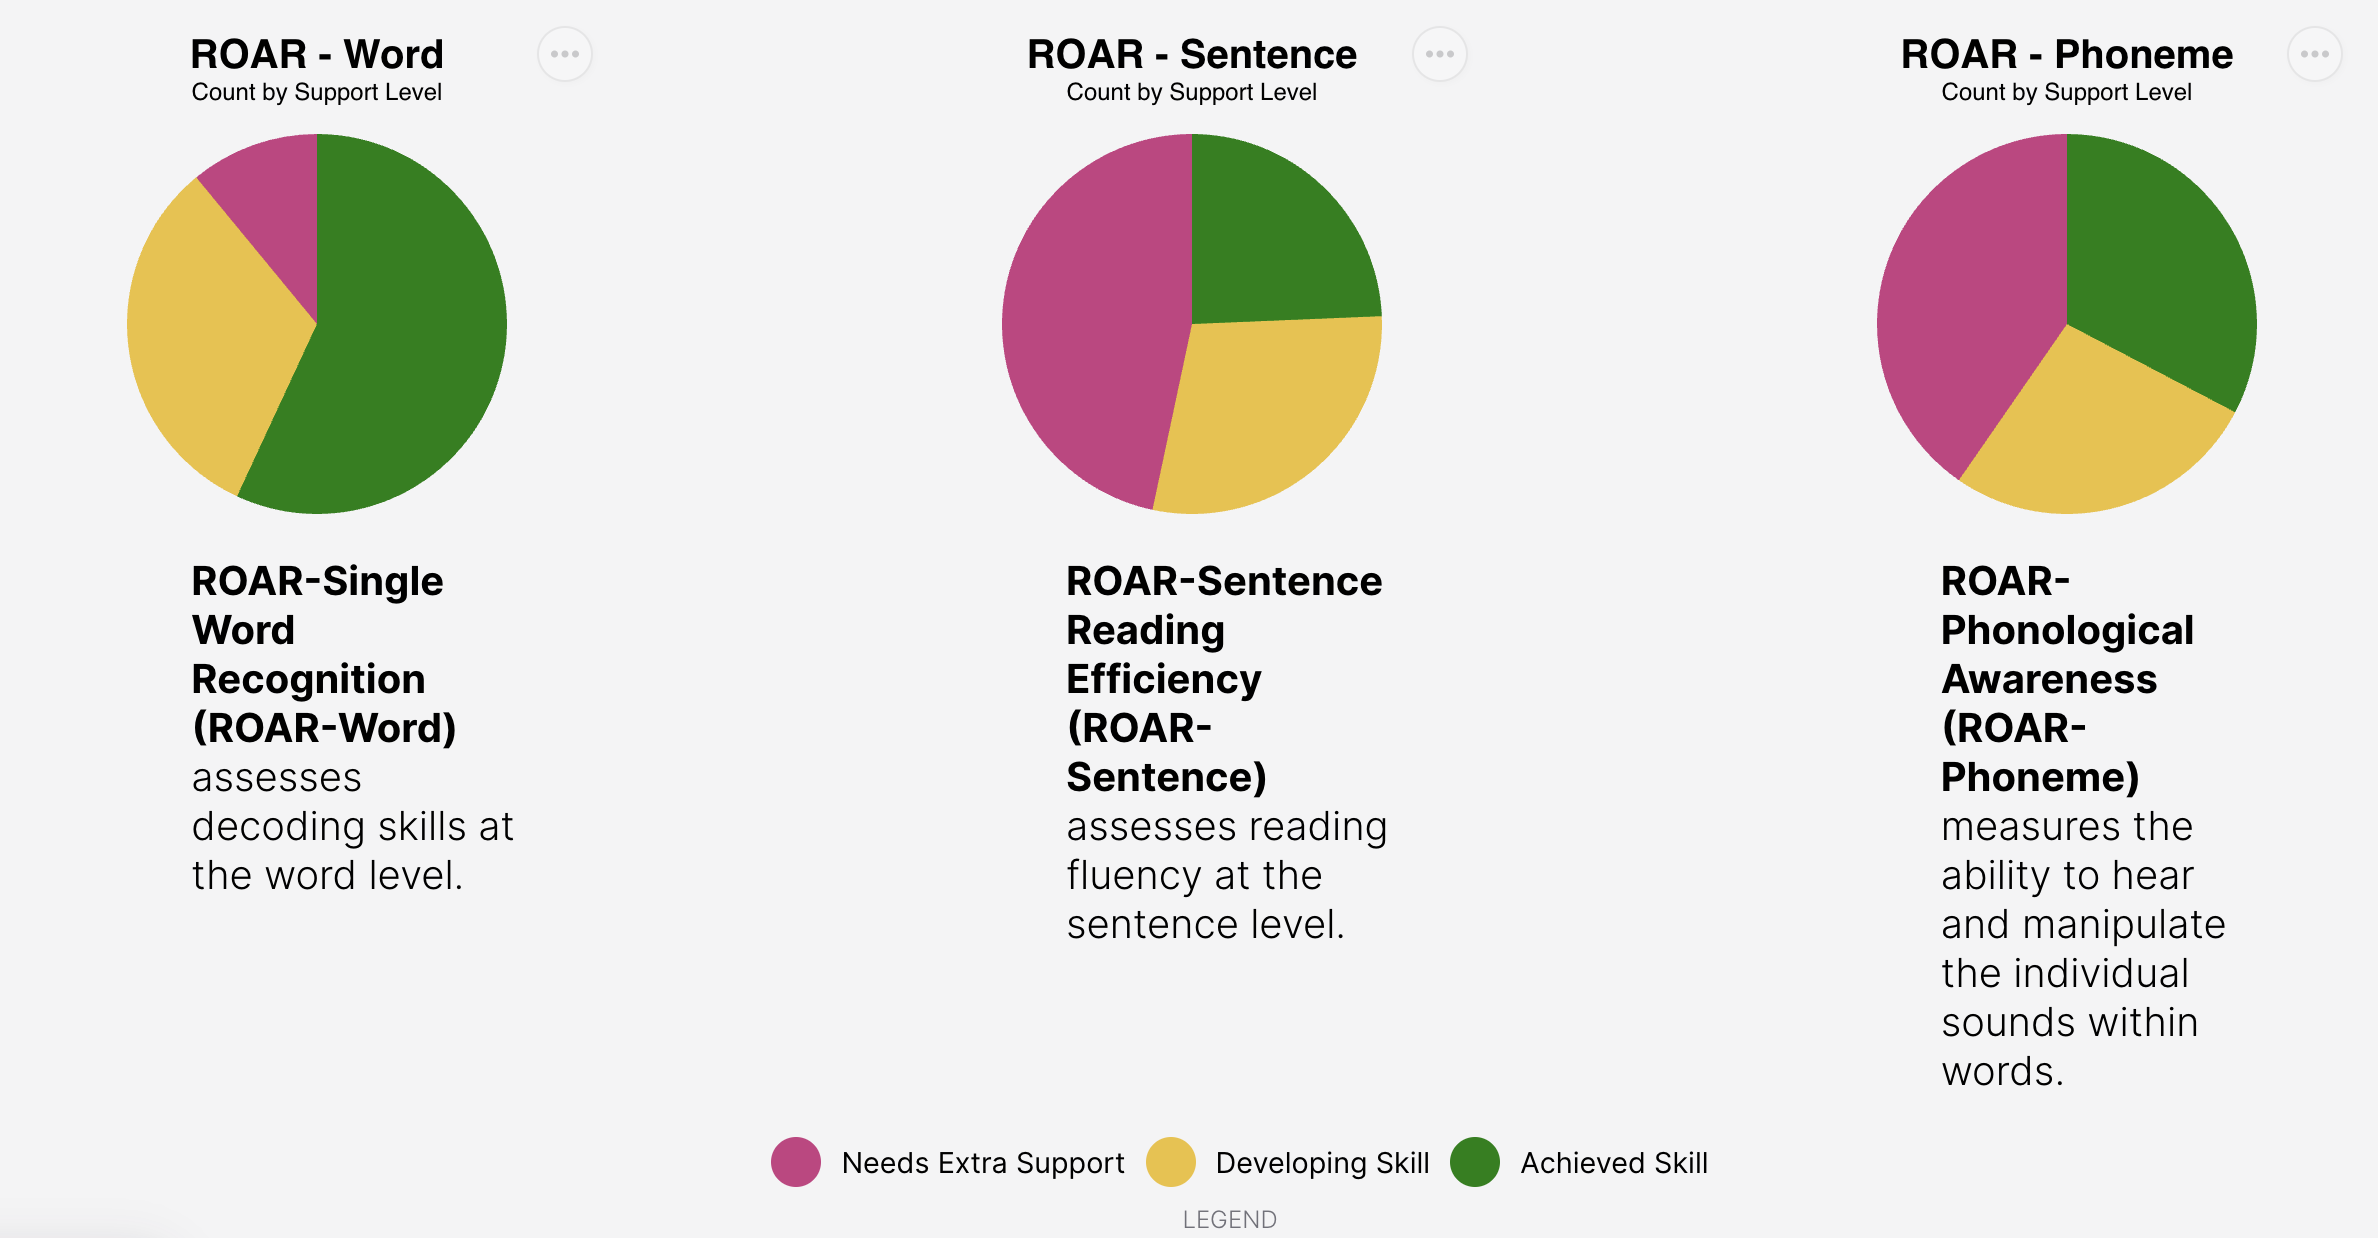
The support categories described can be seen in Figure 3.4 which shows the distribution of support categories from a hypothetical school district in the ROAR Score Report and Figure 3.5 shows a ROAR Score Table indicating which participants need support in which skills.

3.2 Map of ROAR Partners
2542 schools and community based organizations across 39 states around the United States are rostered with ROAR. See the map of ROAR partners in each state. This representative sample of the U.S. education system enables both a) research that is representative of the incredible diversity of educational experiences around the U.S. and b) norming samples for many ROAR assessments.
3.3 Table of school characteristics
ROAR is designed to serve schools nationwide. Through our research-practice partnership model, we seek to work with a broad scope of schools and community organizations representing the diversity of students across the country. Table 3.1 describes the schools and student populations that are represented in our norming sample. To compute nationally representative norms, we removed organizations that tested nonrepresentative student populations and we weighted the contribution of each school’s data to better represent the typical student population in the United States. Table 3.2 shows the weighted student population that was used in our norming models (see Section 3.4).
| Overall (N=94) |
|
|---|---|
| School Level | |
| Elementary | 41 (43.6%) |
| Secondary | 32 (34.0%) |
| Combined | 13 (13.8%) |
| Missing | 8 (8.5%) |
| School Type | |
| Public | 82 (87.2%) |
| Charter | 5 (5.3%) |
| Private | 7 (7.4%) |
| Locale | |
| City | 57 (60.6%) |
| Rural | 9 (9.6%) |
| Suburb | 28 (29.8%) |
| Town | 0 (0%) |
| % Free or Reduced Meals | |
| Mean (SD) | 56.4 (85.6) |
| Median [Min, Max] | 49.2 [0, 731] |
| Missing | 19 (20.2%) |
| % Hispanic | |
| Mean (SD) | 40.3 (30.2) |
| Median [Min, Max] | 38.3 [1.13, 98.2] |
| % American Indian/Alaskan Native | |
| Mean (SD) | 0.276 (0.507) |
| Median [Min, Max] | 0.0245 [0, 3.12] |
| % Asian and Pacific Islander | |
| Mean (SD) | 12.8 (17.9) |
| Median [Min, Max] | 2.63 [0, 86.6] |
| % Black | |
| Mean (SD) | 16.1 (23.5) |
| Median [Min, Max] | 2.99 [0, 93.5] |
| % White | |
| Mean (SD) | 23.8 (25.0) |
| Median [Min, Max] | 13.9 [0, 97.4] |
| % Multi-Racial | |
| Mean (SD) | 5.87 (5.97) |
| Median [Min, Max] | 3.89 [0, 28.6] |
| Overall (N=94) |
|
|---|---|
| School Level | |
| Elementary | 41 (43.6%) |
| Secondary | 32 (34.0%) |
| Combined | 13 (13.8%) |
| Missing | 8 (8.5%) |
| School Type | |
| Public | 82 (87.2%) |
| Charter | 5 (5.3%) |
| Private | 7 (7.4%) |
| Locale | |
| City | 57 (60.6%) |
| Rural | 9 (9.6%) |
| Suburb | 28 (29.8%) |
| Town | 0 (0%) |
| % Free or Reduced Meals | |
| Mean (SD) | 52.7 (87.0) |
| Median [Min, Max] | 48.4 [0, 731] |
| Missing | 19 (20.2%) |
| % Hispanic | |
| Mean (SD) | 37.3 (32.4) |
| Median [Min, Max] | 34.0 [0.128, 98.2] |
| % American Indian/Alaskan Native | |
| Mean (SD) | 0.261 (0.510) |
| Median [Min, Max] | 0.00367 [0, 3.12] |
| % Asian and Pacific Islander | |
| Mean (SD) | 8.57 (15.4) |
| Median [Min, Max] | 1.60 [0, 86.6] |
| % Black | |
| Mean (SD) | 13.7 (21.1) |
| Median [Min, Max] | 2.85 [0, 92.9] |
| % White | |
| Mean (SD) | 19.4 (25.2) |
| Median [Min, Max] | 7.81 [0, 97.4] |
| % Multi-Racial | |
| Mean (SD) | 3.84 (4.47) |
| Median [Min, Max] | 2.16 [0, 28.6] |
For several analyses throughout the ROAR Technical Manual, we take into account individual student demographics. Table 3.3 shows descriptive statistics for the group of students for whom we currently have individual demographics. This group represents about half of our overall sample. While many of our partnering schools share demographic data with us, some do not. Others share race/ethnicity but not other important demographics such as home language, English learner status, and indicators of socioeconomic status such as free and reduced meal eligibility. Depending on the analysis, we will use a subset of this data so that we can achieve a representative sample. Where applicable, this is clarified throughout the ROAR Technical Manual, and updated sample demographic tables are provided.
Table 3.4 shows descriptive statistics for the group of students for whom we currently have individual demographics that are specifically in the norming sample. This group is a small portion of our overall sample of students with demographics and an even smaller portion of our overall students who have taken ROAR. Depending on the norms analysis, we used a subset of the larger demographic data to achieve a representative sample.
| N | % | % Missing | |
|---|---|---|---|
| Female | 80418 | 33.61 | 30.62 |
| Free or Reduced Lunch | 1818 | 0.76 | 97.98 |
| English Language Learner | 5563 | 2.32 | 88.04 |
| Special Education | 1125 | 0.47 | 96.26 |
| Race/Ethnicity | |||
| Hispanic Ethnicity | 43472 | 18.17 | 31.94 |
| White | 51782 | 21.64 | 50.61 |
| Black or African American | 36930 | 15.43 | 50.61 |
| Asian | 10280 | 4.30 | 50.61 |
| American Indian or Alaska Native | 2942 | 1.23 | 50.61 |
| Hawaiian or Other Pacific Islander | 479 | 0.20 | 50.61 |
| Multiracial | 16202 | 6.77 | 50.62 |
| Total | 239286 | ||
| N | % | % Missing | |
|---|---|---|---|
| Female | 4396 | 43.18 | 13.30 |
| Free or Reduced Lunch | 94 | 0.92 | 97.89 |
| English Language Learner | 63 | 0.62 | 96.94 |
| Special Education | 54 | 0.53 | 97.22 |
| Race/Ethnicity | |||
| Hispanic Ethnicity | 1990 | 19.55 | 11.38 |
| White | 2778 | 27.29 | 20.89 |
| Black or African American | 1384 | 13.59 | 20.89 |
| Asian | 456 | 4.48 | 20.89 |
| American Indian or Alaska Native | 70 | 0.69 | 20.89 |
| Hawaiian or Other Pacific Islander | 47 | 0.46 | 20.89 |
| Multiracial | 3308 | 32.49 | 20.89 |
| Total | 10181 | ||
3.4 Norming model for ROAR Foundational Reading Skills Suite
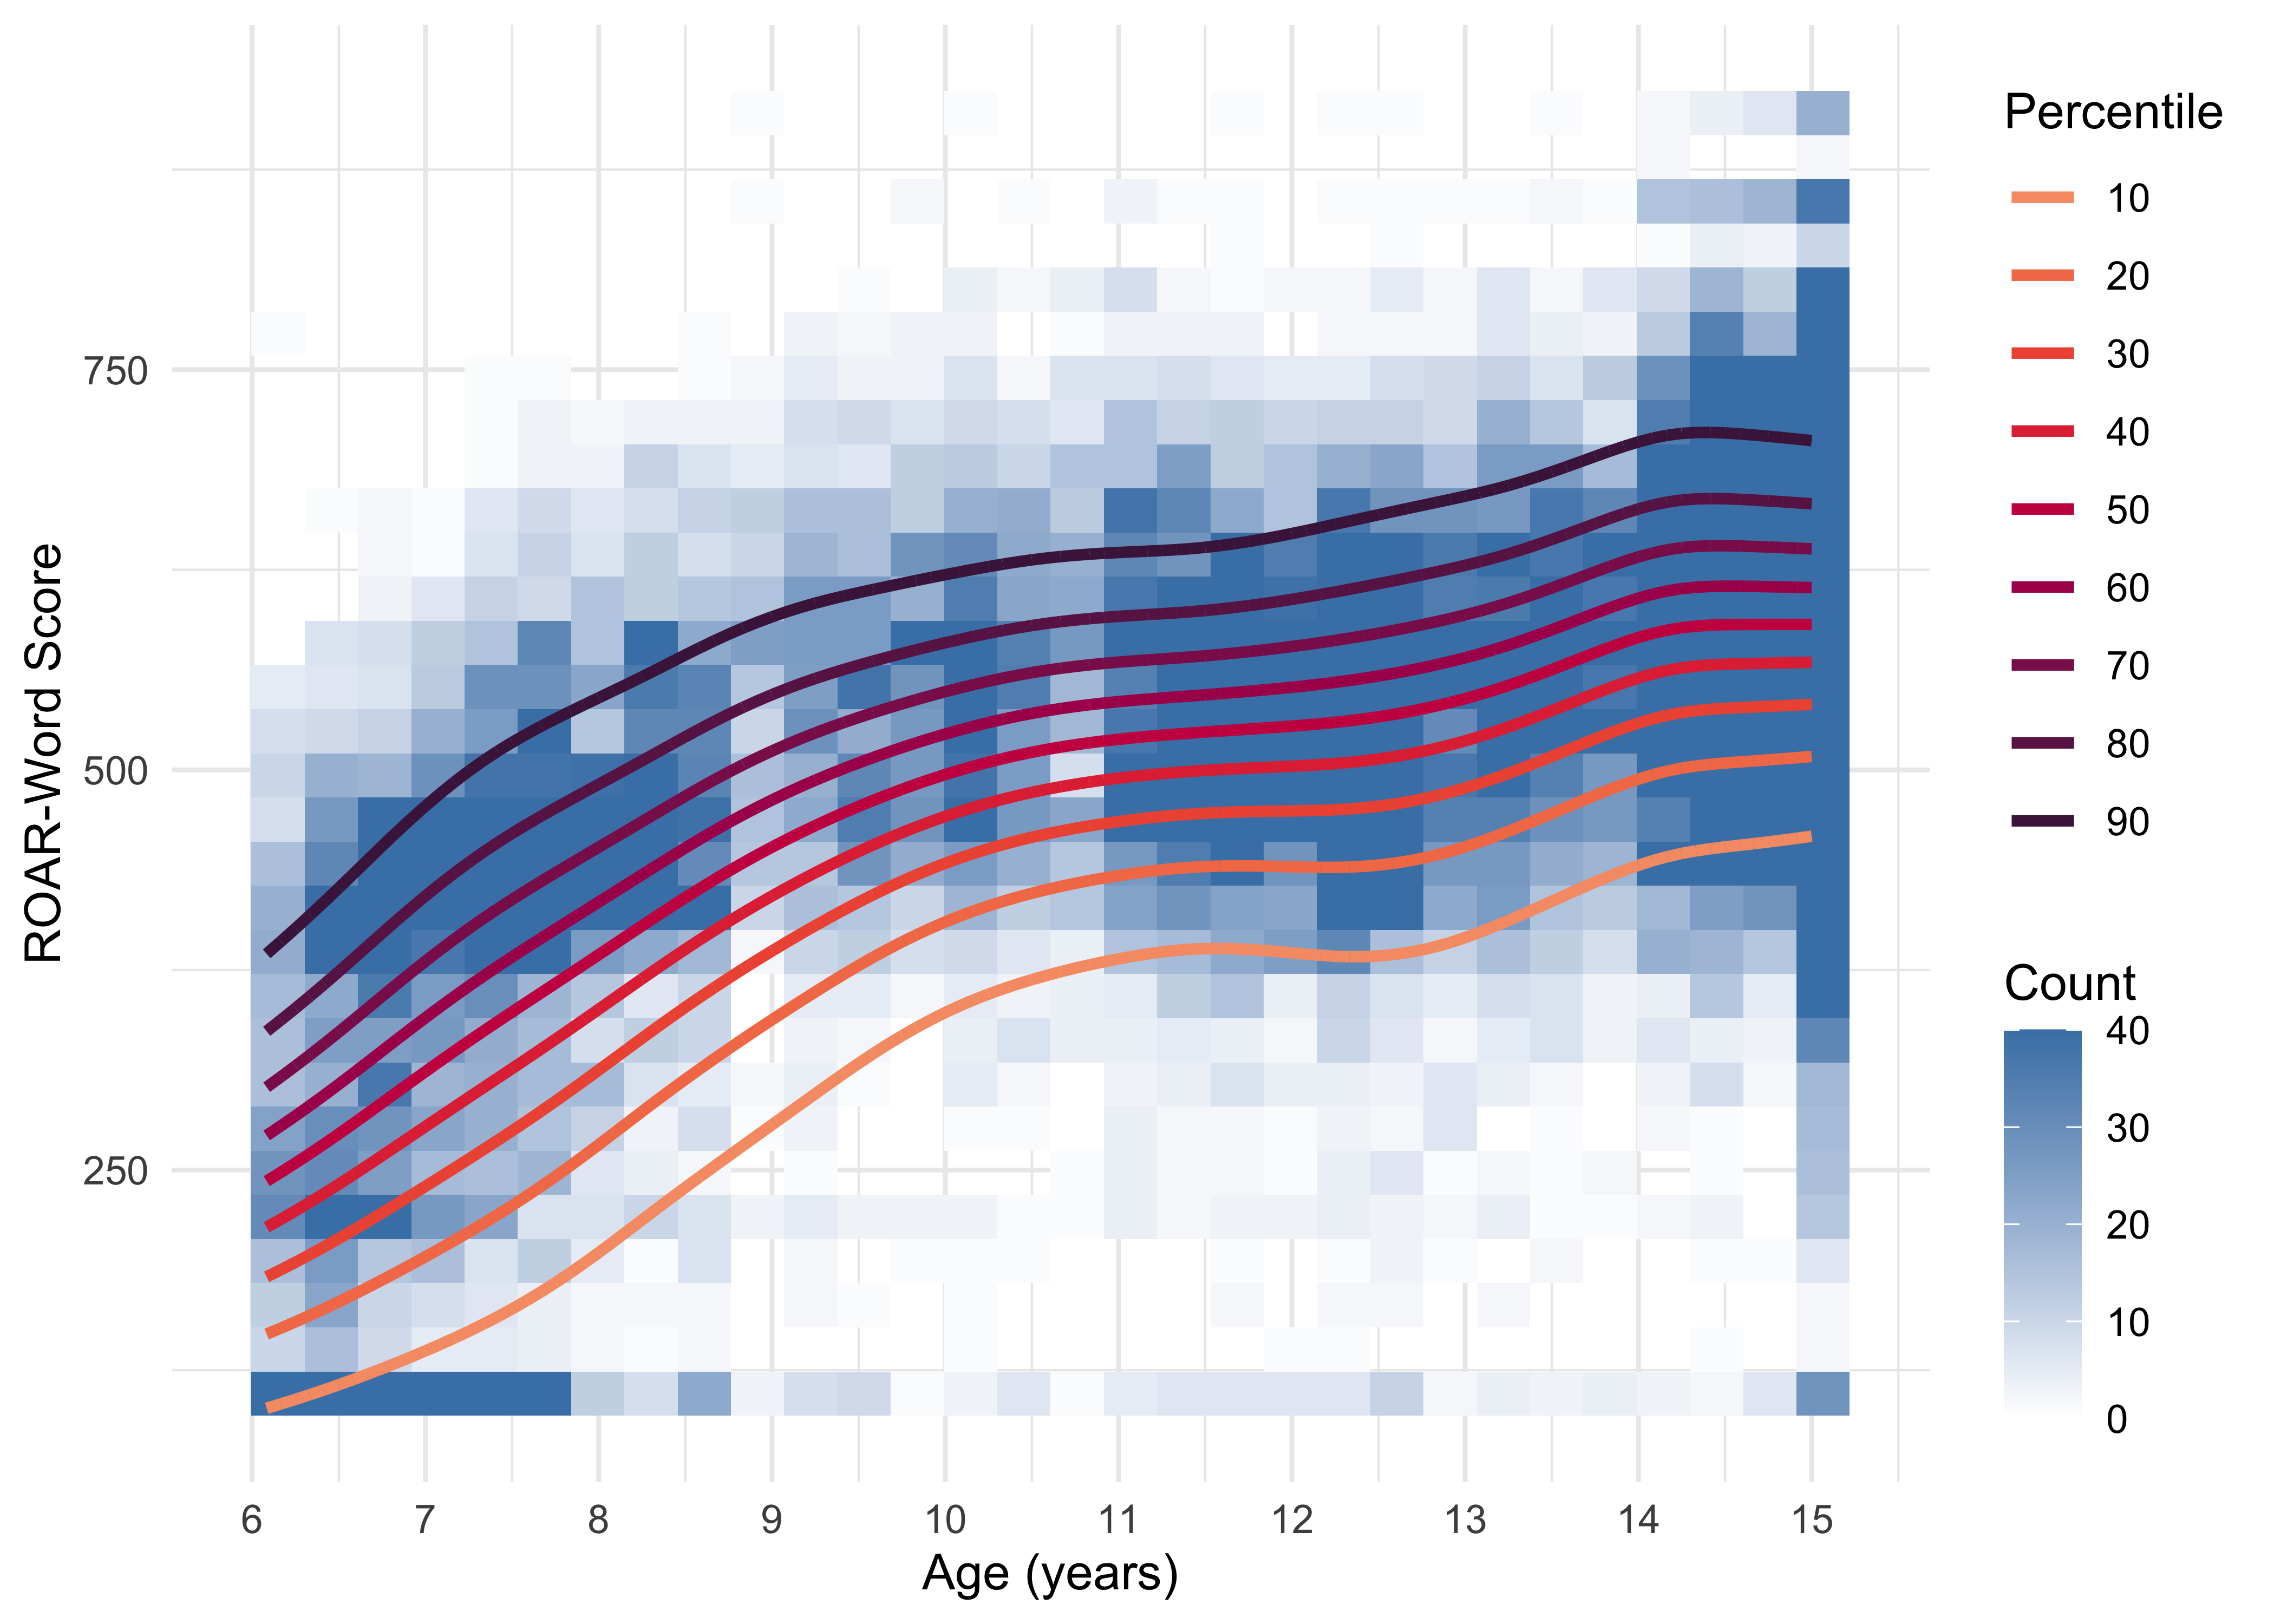
To generate age-referenced norms for ROAR we model raw test scores with Generalized Additive Models for Location, Scale and Shape (GAMLSS) implemented in the gamlss R packagem(Rigby and Stasinopoulos 2005). GAMLSS extends traditional regression by estimating not only the mean (μ) of the score distribution, but also parameters characterizing the shape of the distribution such as its scale (σ), skewness (ν) and kurtosis (τ) as smooth functions of age, thereby capturing the heteroscedasticity and non-normal shape typically seen in developmental data. GAMLSS is the current approach recommended by the World Health Organization to estimate non-linear growth trajectories (Borghi et al. 2006) and has been growing in popularity for applications spanning brain development (Bethlehem et al. 2022), cognitive development (Timmerman, Voncken, and Albers 2021), and clinical applications (Zhang et al. 2018). We selected the Box–Cox-t (BCT) family because it accommodates positive/negative skew and heavier tails while preserving scores’ natural lower bound at zero (Rigby and Stasinopoulos 2006). Penalized B-splines (P-splines) with automatic smoothing selection are used for μ and σ, with σ allowed to vary by age so that the spread of scores can widen or narrow across development. Once the model is fitted, centile curves (e.g., 5th, 25th, 50th, 75th, 95th) are obtained by inverting the fitted BCT distribution at each age point, and individual scores are transformed to age-adjusted Z-scores or percentile ranks by locating them on these curves—yielding a continuous, smoothly varying normative reference across the entire age range assessed by ROAR. Figure 3.8 shows percentile curves from the norming model fit to ROAR-Word data.
To validate that: - our norming sample is nationally representative and similar to other widely accepted standardized tests - the continuous norming model fit to ROAR-Word data based on a Generalized Additive Models for Location, Scale and Shape (GAMLSS) with a Box–Cox-t distribution performs similar to conventional approaches.
We compare the percentiles computed under the GAMLSS model to those derived by linking ROAR-Word scores to Woodcock Johnson percentiles. Figure 3.9 shows the similarity of the two norming approaches.
The norms and additional scoring details are provided in the introduciton to each measure within ROAR Foundational Reading Skills: - For ROAR-Word see: Chapter 5 - For ROAR-Sentence see: Chapter 6 - For ROAR-Letter see: Chapter 8 - For ROAR-Phoneme see: Chapter 7
References
Bethlehem, R A I, J Seidlitz, S R White, J W Vogel, K M Anderson, C Adamson, S Adler, et al. 2022. “Brain Charts for the Human Lifespan.” Nature 604 (7906): 525–33.
Borghi, Elaine, Mercedes de Onis, Cutberto Garza, Jan Van den Broeck, Edward A Frongillo, Laurence Grummer-Strawn, S Van Buuren, et al. 2006. “Construction of the World Health Organization Child Growth Standards: Selection of Methods for Attained Growth Curves.” Statistics in Medicine 25 (2): 247–65.
Rigby, Robert A, and D Mikis Stasinopoulos. 2005. “Generalized Additive Models for Location, Scale and Shape.” Journal of the Royal Statistical Society Series C: Applied Statistics 54 (3): 507–54.
———. 2006. “Using the Box-Cox t Distribution in GAMLSS to Model Skewness and Kurtosis.” Statistical Modelling 6 (3): 209–29.
Timmerman, Marieke E, Lieke Voncken, and Casper J Albers. 2021. “A Tutorial on Regression-Based Norming of Psychological Tests with GAMLSS.” Psychol. Methods 26 (3): 357–73.
Wentworth, Laura, Paula Arce-Trigatti, Carrie Conaway, and Samantha Shewchuk. 2023. Brokering in Education Research-Practice Partnerships: A Guide for Education Professionals and Researchers. Taylor & Francis.
Wentworth, L, R Khanna, M Nayfack, and D Schwartz. 2021. “Closing the Research-Practice Gap in Education.” Stanford Social Innovation Review 19 (2): 57–58.
Zhang, Jingzhou, Xiao Hu, Xinlun Tian, and Kai-Feng Xu. 2018. “Global Lung Function Initiative 2012 Reference Values for Spirometry in Asian Americans.” BMC Pulm. Med. 18 (1): 95.