| Grade | Early Reading Risk Level | N | Proportion of Risk Level |
|---|---|---|---|
| Kindergarten | High Risk | 36 | 35.6% |
| Kindergarten | Some Risk | 22 | 21.8% |
| Kindergarten | Low Risk | 43 | 42.6% |
| 1 | High Risk | 220 | 26% |
| 1 | Some Risk | 176 | 20.8% |
| 1 | Low Risk | 450 | 53.2% |
32 Validity: Dyslexia Screening and Sub-typing
32.1 Backgorund
From the perspective of neuroscience, written language is an incredible feat. Prompted by reading instruction, the brain constructs specialized circuits to translate visual symbols into their sounds and meanings (Yeatman 2022; Yeatman and White 2021). The brain has evolved dedicated circuits for spoken language and visual recognition processes because these skills have been integral to survival for eons. Written language, however, was invented by human societies only a few thousand years ago. It is unlikely that the brain evolved dedicated circuits for written language. The brain develops the circuitry for literacy through experiences with written language beginning in infancy thanks to the brain’s capacity to change in response to new experiences, a principle known as “plasticity”. This means that a child’s experiences in the classroom sculpt their neural circuitry of literacy.
However, this circuitry is not built from scratch. Literacy is grounded in circuits that evolved for component processes, such as spoken language and visual recognition. As a child begins to learn to read, brain circuits that evolved for visual recognition are reorganized to process text and route this information to the brain’s spoken language network. This process depends on instruction and practice. But for some children, the process of learning to read presents a substantial struggle. For children with Developmental Dyslexia, struggles with foundational reading skills—decoding, word recognition and reading speed/efficiency specifically—tend to persist throughout schooling unless they receive additional support and/or evidence-based intervention. The goal of a dyslexia screener is to identify students who would benefit from additional support in foundational reading skills. The promise of plasticity is that once they are identified and provided with intensive, targeted, systematic support in foundational reading skills, children with Developmental Dyslexia can develop the ability to decode and read efficiently.
There are a variety of definitions of dyslexia, but they all share this characteristic: persistent struggles with decoding, word recognition and establishing fluent reading.
International Dyslexia Association (IDA) Definition of Dyslexia
The International Dyslexia Association published one of the most widely used definitions of dyslexia which was developed through a consensus building process in partnership with the National Center for Learning Disabilities (NCLD), and the National Institute of Child Health and Human Development (NICHD) (Lyon, Shaywitz, and Shaywitz 2003).
From the IDA website: “Dyslexia is a specific learning disability that is neurobiological in origin. It is characterized by difficulties with accurate and/or fluent word recognition and by poor spelling and decoding abilities. These difficulties typically result from a deficit in the phonological component of language that is often unexpected in relation to other cognitive abilities and the provision of effective classroom instruction. Secondary consequences may include problems in reading comprehension and reduced reading experience that can impede growth of vocabulary and background knowledge.”
While this definition has been widely used for the past two decades, there has been a recent push to revise the definition of dyslexia to a) make diagnosis simpler, b) make it easier to get support to the students that need it and c) acknowledge heterogeneity and the multifactorial nature of dyslexia.
Proposed revisions to the definition of dyslexia
Catts et al. (2024) argue for an alternative, “prevention-based approach that focuses on the early identification of children at risk for dyslexia and the provision of instruction/intervention that is matched to their needs.” Catts et al. (2024) specifically propose revisions to the definition that incorporate other, known causal factors beyond phonological awareness.
Snowling and Hulme (2024), on the other hand, argue that a revised definition is unnecessary and propose that causal arguments need not go into the definition.
Finally, Elliott and Grigorenko (2024) propose a “simpler definition that describes the primary difficulty, avoids reference to causal explanation, unexpectedness, and secondary outcomes, and redirects practitioner and policymaker focus to the importance of addressing and meeting the needs of all struggling readers.”
The proposed revision of Elliott and Grigorenko (2024) only references challenges with word reading accuracy and speed, making Dyslexia more straightforward to diagnose and intervene.
To assess sensitivity and specificity of ROAR Foundational Reading Skills (see Section 10.1) as an indicator of dyslexia risk, we ran four studies of criterion validity—one with a reading assessment that is among the most commonly used in schools, and three with the most widely-used measure in dyslexia research:
32.2 Study 1: FAST™ earlyReading and FAST™ CBMreading
A study in collaboration with two, large and diverse California school districts that uses FAST™ earlyReading and FAST™ CBMreading risk categories as the criterion measures. FAST™ earlyReading and FAST™ CBMreading are individually administered screeners that classify students into three different risk levels for reading difficulties: “Low Risk”, “Some Risk”, and “High Risk”. For kindergarten we calculate prediction accuracy, sensitivity and specificity of ROAR Foundational Reading Skills relative to FAST™ earlyReading. For first grade, we calculate prediction accuracy, sensitivity and specificity of ROAR Foundational Reading Skills relative to FAST™ earlyReading and FAST™ CBMreading. For second grade we calculate prediction accuracy, sensitivity and specificity of ROAR Foundational Reading Skills relative to FAST™ CBMreading.
32.2.1 Sample demographics
This study was carried out in collaboration with two California school districts. Demographics of the sample are provided in Table 27.4.
Table 32.1 and Table 32.2 show the distribution of students in the sample across FAST™ earlyReading and FAST™ CBMreading risk categories. Note that FAST™ CBMreading categories of “College Pathway” and “Exceeding Expectations” have been included in the category “Low Risk” for the sake of this analysis.
| Grade | CBMreading Risk Level | N | Proportion of Grade |
|---|---|---|---|
| 1 | High Risk | 201 | 22.7% |
| 1 | Some Risk | 161 | 18.2% |
| 1 | Low Risk | 523 | 59.1% |
| 2 | High Risk | 187 | 19.4% |
| 2 | Some Risk | 149 | 15.5% |
| 2 | Low Risk | 626 | 65.1% |
32.2.2 ROAR-Word
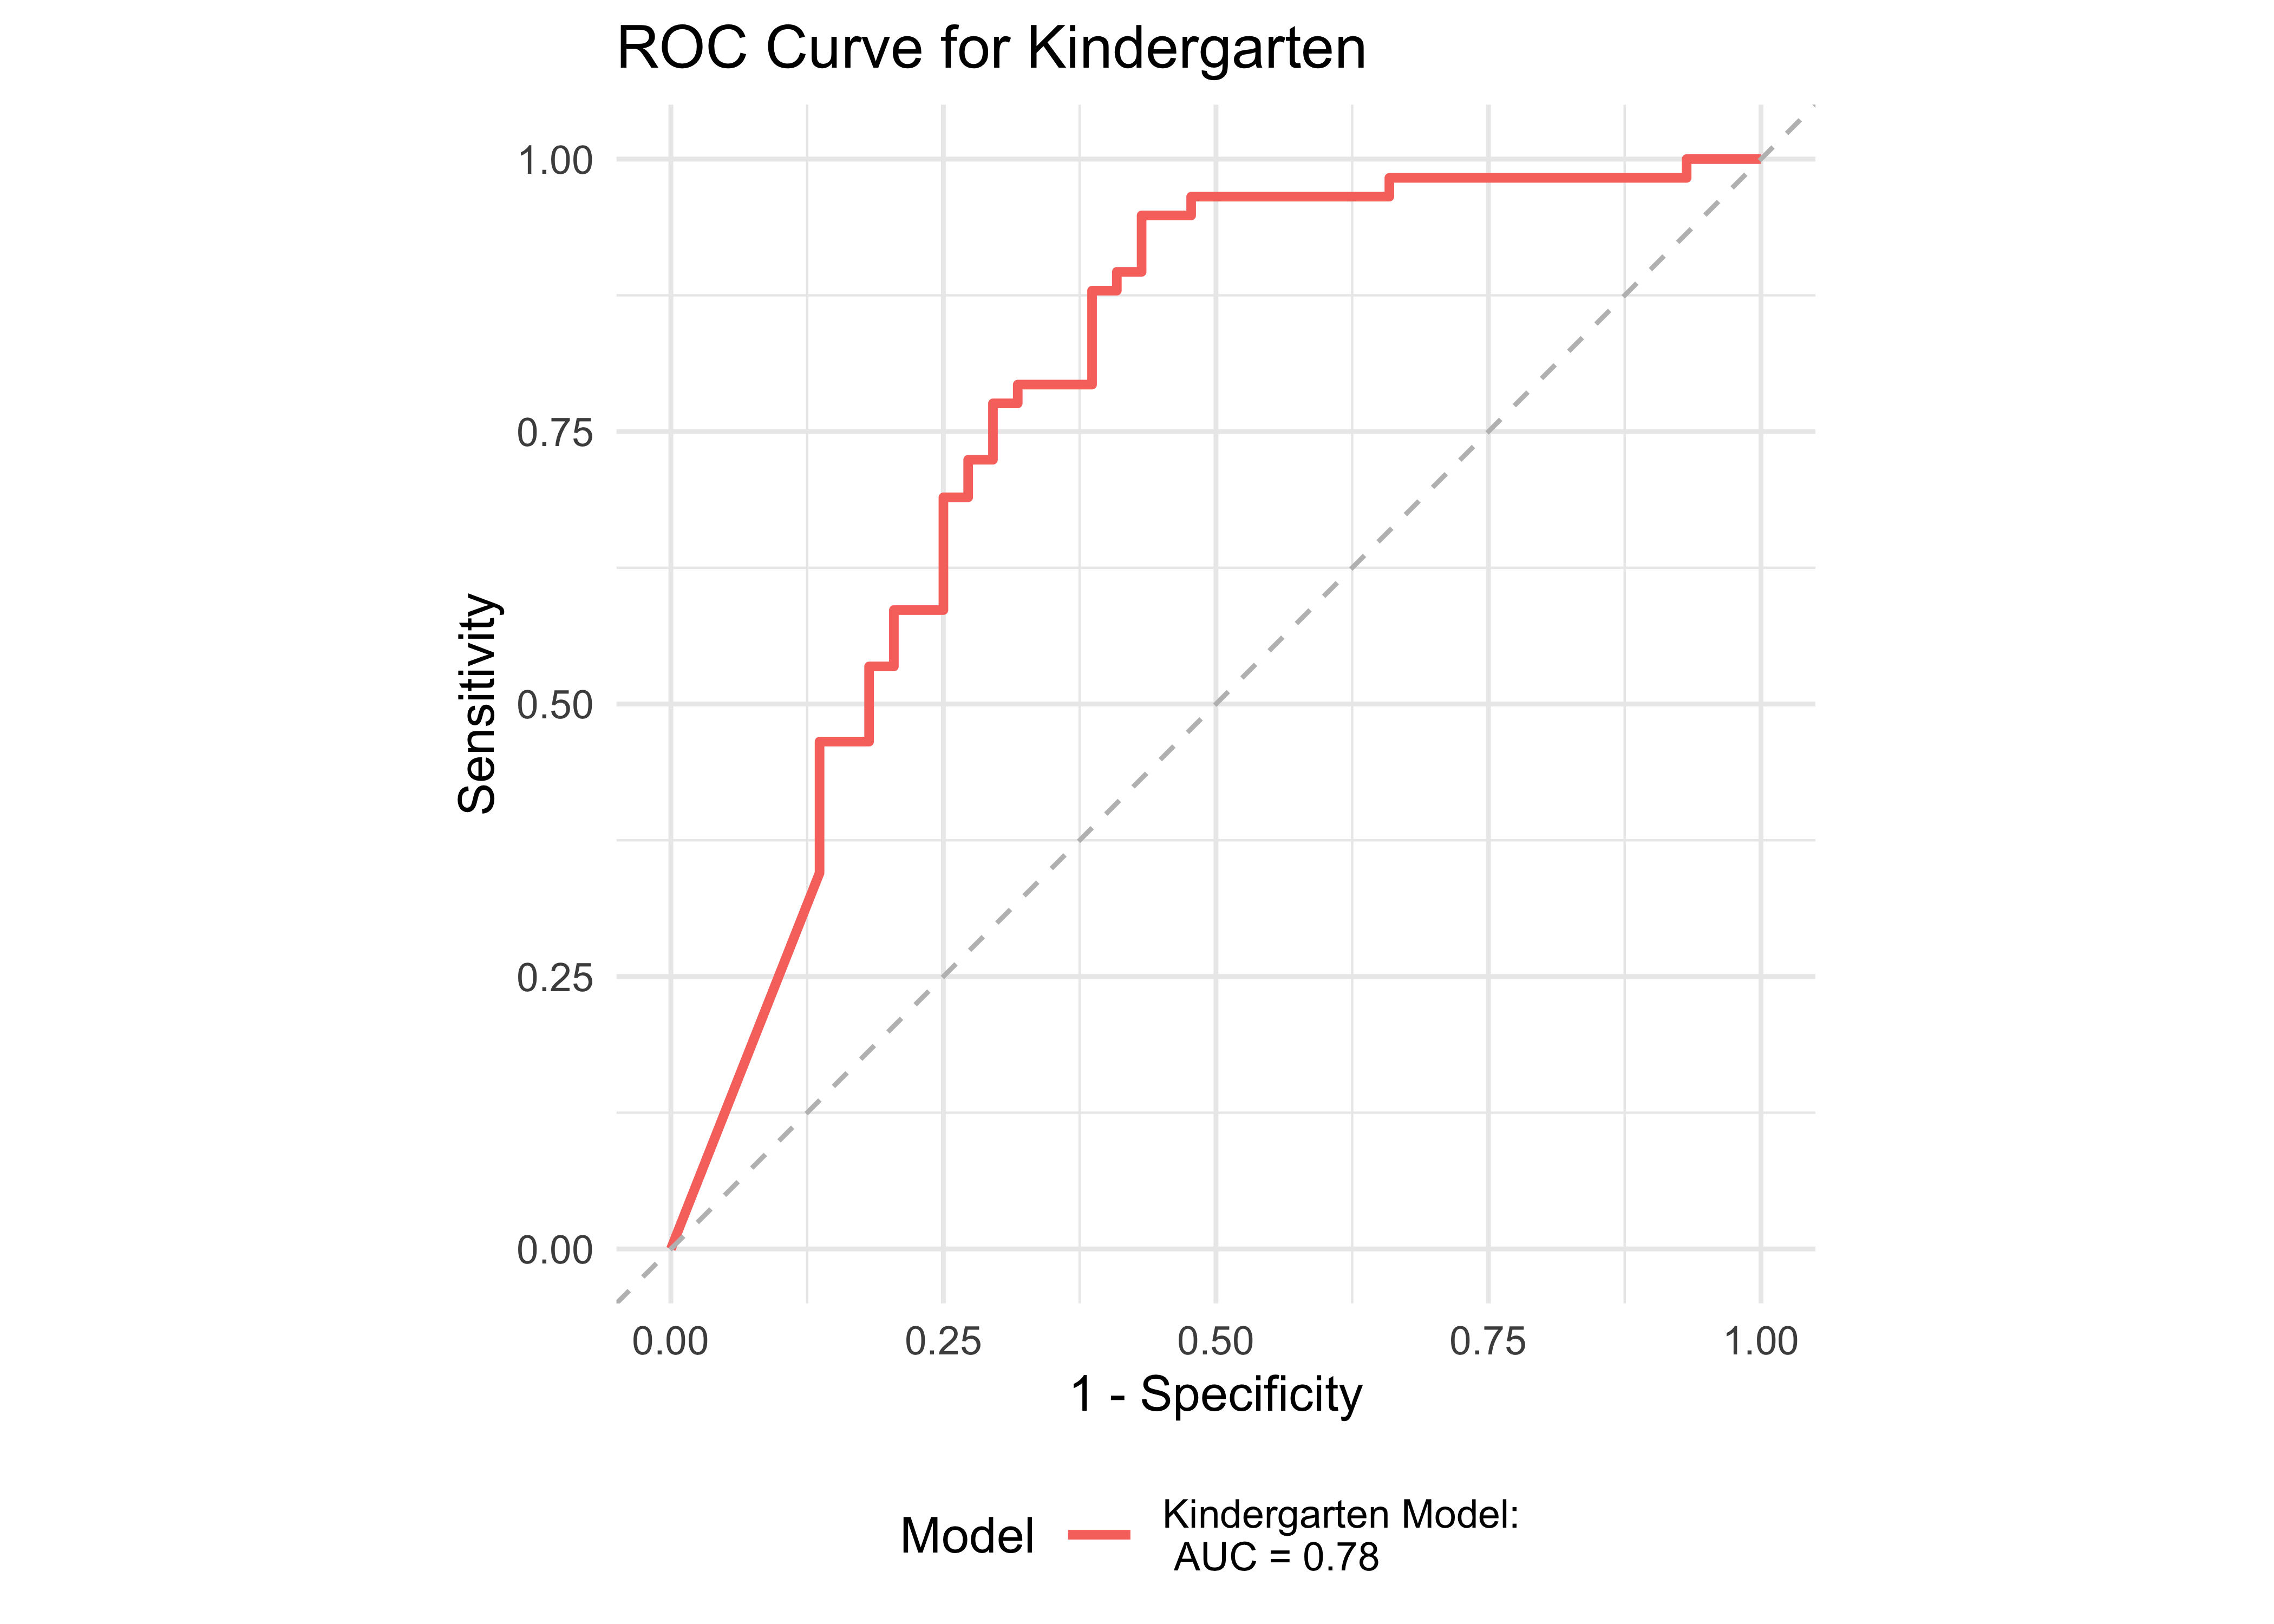
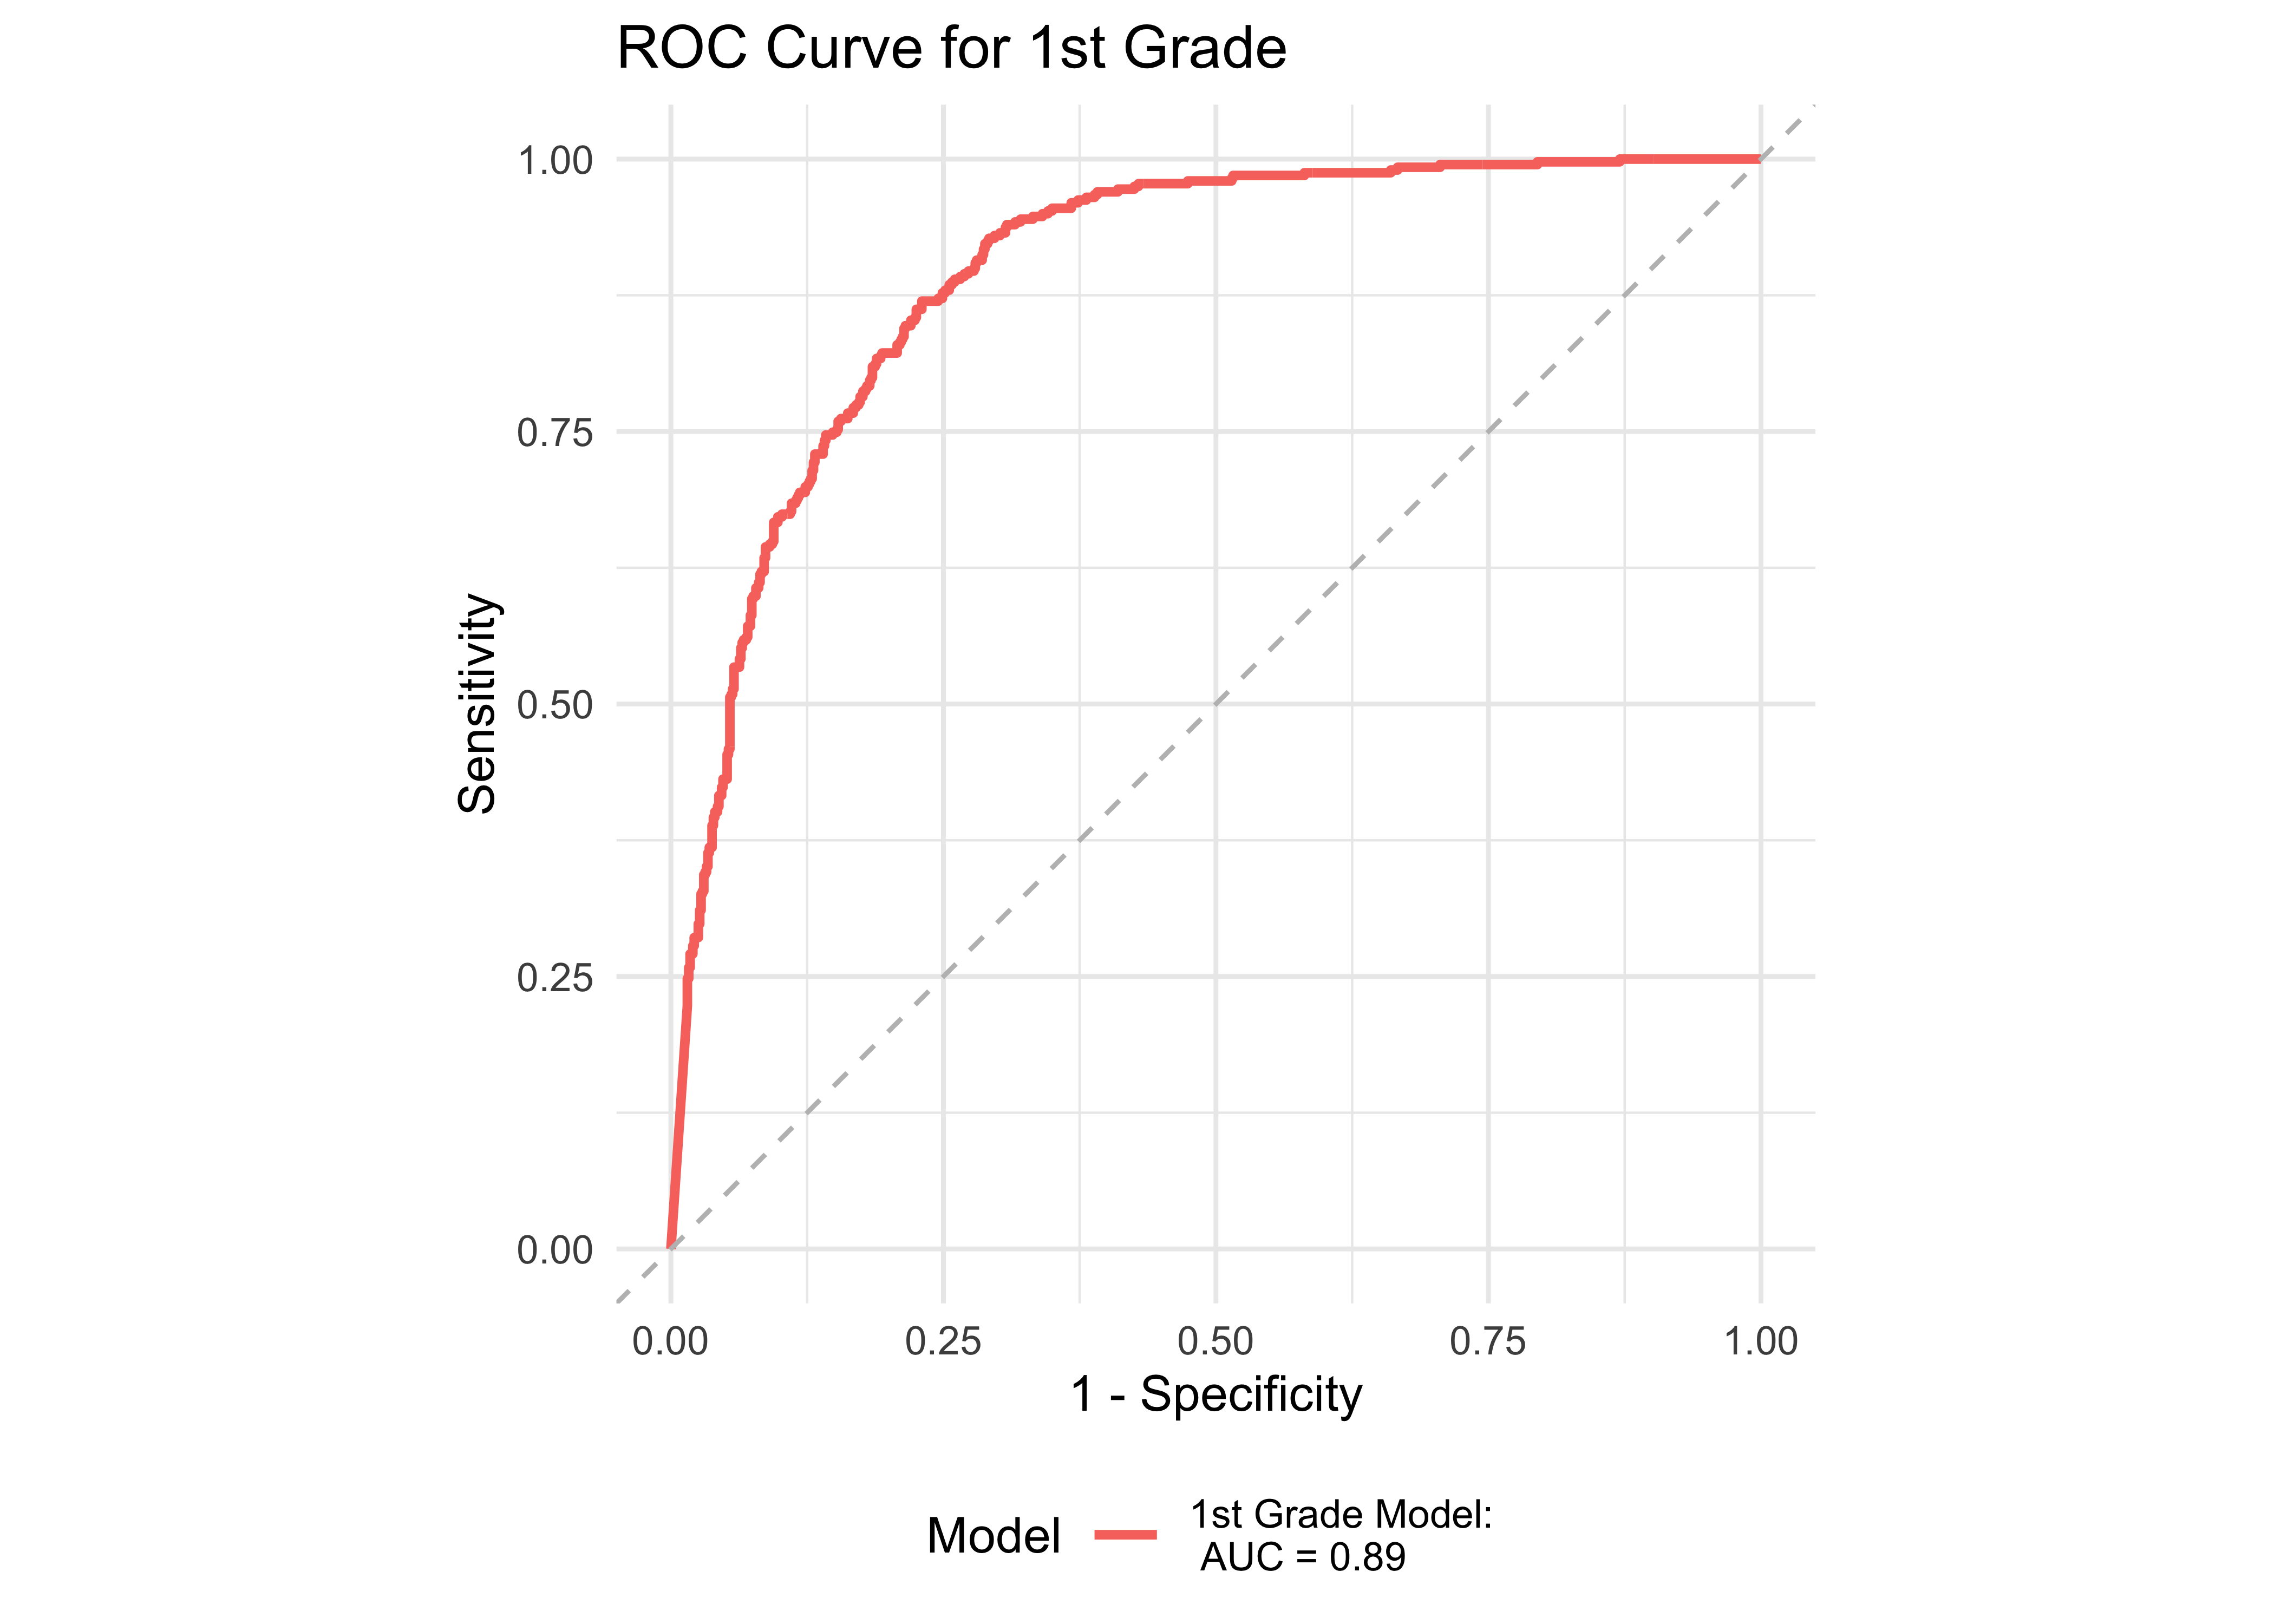
Since dyslexia is identified based on persistent difficulties with word reading accuracy and fluency, word reading measures are generally the most efficient screeners though additional measures of Letter Sound Knowledge, Phonological Awareness, Rapid Automatized Naming and Visual Processing can also improve sensitivity/specificity, particularly for younger students at the early stages of learning to read. Thus, we begin by computing prediction accuracy, sensitivity and specificity for ROAR-Word. We then examine whether additional measures lead to more accurate predictions. Finally, we examine each additional measure in isolation.
Figure 32.1 shows an ROC curve for kindergarten and 1st grade computed from a logistic regression model with ROAR-Word as a predictor of the FAST™ earlyReading “High Risk” category. Figure 32.2 shows and ROC curve for 1st and 2nd grades computed from a logistic regression model with ROAR-Word as a predictor of the FAST™ CBMreading “High Risk” category. All models in 1st and 2nd grade achieved exceptional accuracy with area under the curve (AUC) greater than 0.9 for both criterion measures. In kindergarten accuracy was lower, which is expected for a model that does not include other screening measures. Table 32.3 and Table 32.4 report sensitivity, specificity and accuracy by each demographic for which there were more than 10 participants. Table 32.5 and Table 32.6 report sensitivity, specificity and accuracy by each demographic for which there were more than 10 participants. Best sensitivity and specificity are determined using Youden’s J statistic (Youden 1950). The optimal cut-off is the threshold that maximizes the distance to the identity (diagonal) line. The optimality criterion is: \(max(sensitivities + sensitivities)\)
| Demographic Group | Grade | AUC | Best Specificity | Best Sensitivity | Specificity (Sensitivity at 0.9) | Sensitivity at 0.9 | N |
|---|---|---|---|---|---|---|---|
| English Learner | Kindergarten | 0.71 | 0.75 | 0.76 | 0.25 | 0.90 | 25 |
| Female | Kindergarten | 0.77 | 0.79 | 0.77 | 0.53 | 0.93 | 49 |
| Male | Kindergarten | 0.77 | 0.58 | 0.93 | 0.54 | 0.93 | 52 |
| White | Kindergarten | 0.76 | 0.59 | 0.95 | 0.59 | 0.90 | 48 |
| Hispanic Ethnicity | Kindergarten | 0.81 | 0.67 | 0.97 | 0.67 | 0.91 | 38 |
| Free or Reduced Lunch | Kindergarten | 1.00 | 1.00 | 1.00 | 1.00 | 0.92 | 27 |
| All | Kindergarten | 0.78 | 0.57 | 0.95 | 0.57 | 0.91 | 102 |
| Demographic Group | Grade | AUC | Best Specificity | Best Sensitivity | Specificity (Sensitivity at 0.9) | Sensitivity at 0.9 | N |
|---|---|---|---|---|---|---|---|
| English Learner | 1 | 0.87 | 0.75 | 0.88 | 0.57 | 0.91 | 196 |
| Female | 1 | 0.90 | 0.81 | 0.87 | 0.75 | 0.91 | 576 |
| Male | 1 | 0.89 | 0.80 | 0.81 | 0.69 | 0.90 | 601 |
| White | 1 | 0.84 | 0.66 | 0.93 | 0.66 | 0.91 | 439 |
| Hispanic Ethnicity | 1 | 0.85 | 0.77 | 0.80 | 0.59 | 0.90 | 340 |
| Black or African American | 1 | 0.82 | 0.67 | 1.00 | NA | NA | 20 |
| Multiracial | 1 | 0.84 | 0.78 | 0.85 | 0.52 | 0.92 | 143 |
| SPED | 1 | 0.95 | 1.00 | 0.83 | 0.73 | 0.91 | 57 |
| Free or Reduced Lunch | 1 | 0.88 | 0.90 | 0.72 | 0.68 | 0.90 | 256 |
| All | 1 | 0.89 | 0.77 | 0.87 | 0.72 | 0.90 | 1187 |
| Demographic Group | Grade | AUC | Best Specificity | Best Sensitivity | Specificity (Sensitivity at 0.9) | Sensitivity at 0.9 | N |
|---|---|---|---|---|---|---|---|
| English Learner | 1 | 0.86 | 0.73 | 0.88 | 0.64 | 0.91 | 196 |
| Female | 1 | 0.92 | 0.81 | 0.94 | 0.82 | 0.90 | 576 |
| Male | 1 | 0.92 | 0.82 | 0.89 | 0.78 | 0.90 | 601 |
| White | 1 | 0.89 | 0.75 | 0.94 | 0.76 | 0.91 | 439 |
| Hispanic Ethnicity | 1 | 0.86 | 0.76 | 0.87 | 0.68 | 0.90 | 340 |
| Asian | 1 | 0.92 | 0.73 | 1.00 | 0.73 | 0.94 | 294 |
| Multiracial | 1 | 0.90 | 0.80 | 1.00 | 0.80 | 0.93 | 143 |
| SPED | 1 | 0.91 | 0.94 | 0.90 | 0.81 | 0.90 | 57 |
| Free or Reduced Lunch | 1 | 0.89 | 0.75 | 0.88 | 0.70 | 0.91 | 256 |
| All | 1 | 0.92 | 0.78 | 0.94 | 0.80 | 0.90 | 1187 |
| Demographic Group | Grade | AUC | Best Specificity | Best Sensitivity | Specificity (Sensitivity at 0.9) | Sensitivity at 0.9 | N |
|---|---|---|---|---|---|---|---|
| English Learner | 2 | 0.81 | 0.73 | 0.82 | 0.53 | 0.90 | 247 |
| Female | 2 | 0.93 | 0.78 | 0.97 | 0.81 | 0.90 | 594 |
| Male | 2 | 0.90 | 0.86 | 0.80 | 0.73 | 0.90 | 623 |
| White | 2 | 0.88 | 0.74 | 1.00 | 0.79 | 0.90 | 277 |
| Hispanic Ethnicity | 2 | 0.89 | 0.87 | 0.81 | 0.67 | 0.90 | 335 |
| Asian | 2 | 0.91 | 0.76 | 1.00 | 0.76 | 0.93 | 248 |
| Multiracial | 2 | 0.83 | 0.78 | 0.91 | 0.38 | 0.91 | 168 |
| SPED | 2 | 0.91 | 0.78 | 0.90 | 0.65 | 0.90 | 65 |
| Free or Reduced Lunch | 2 | 0.91 | 0.90 | 0.82 | 0.76 | 0.90 | 272 |
| All | 2 | 0.91 | 0.84 | 0.86 | 0.78 | 0.90 | 1229 |


32.2.3 ROAR measures of foundational reading skills
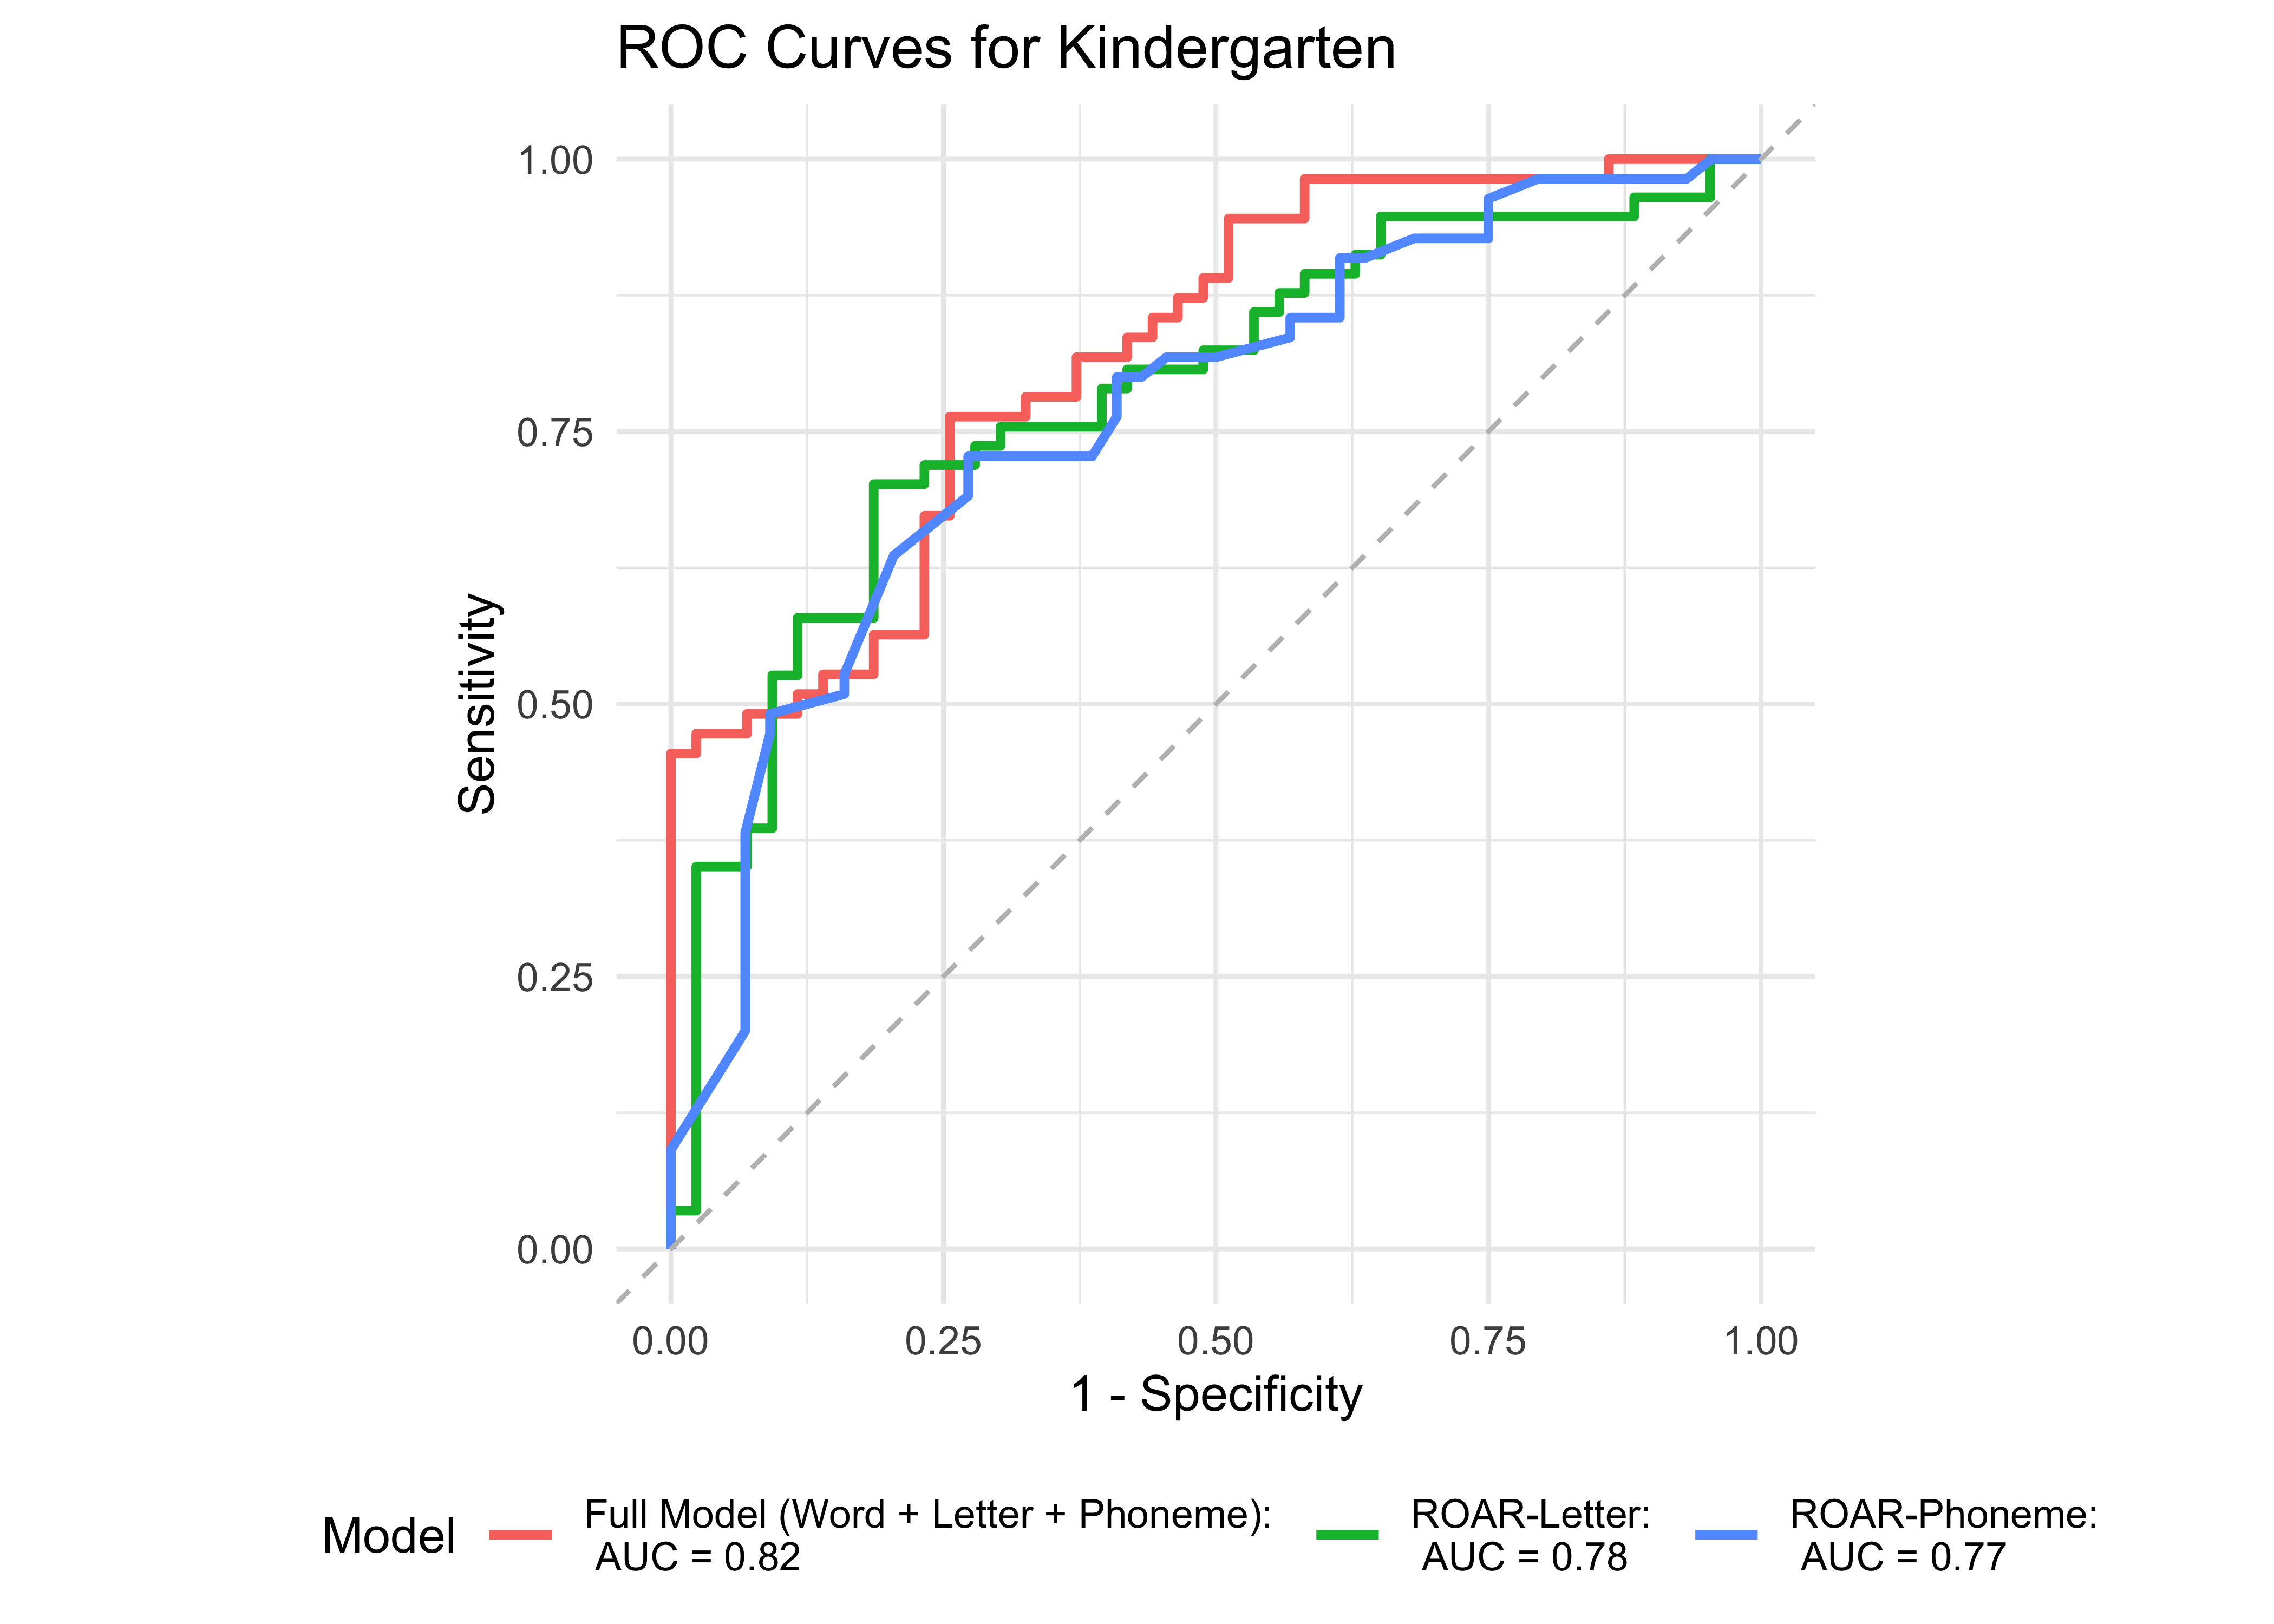
We next examine model accuracy based on a logistic regression model with all three ROAR measures of foundational reading skills: ROAR-Phoneme, ROAR-Letter and ROAR-Word. Because model accuracy was already near perfect for 1st and 2nd grade we would not expect a large improvement. However in kindergarten, when foundational reading skills are still being established, we expect measures of Phonological Awareness and Letter Sound knowledge to improve prediction accuracy.
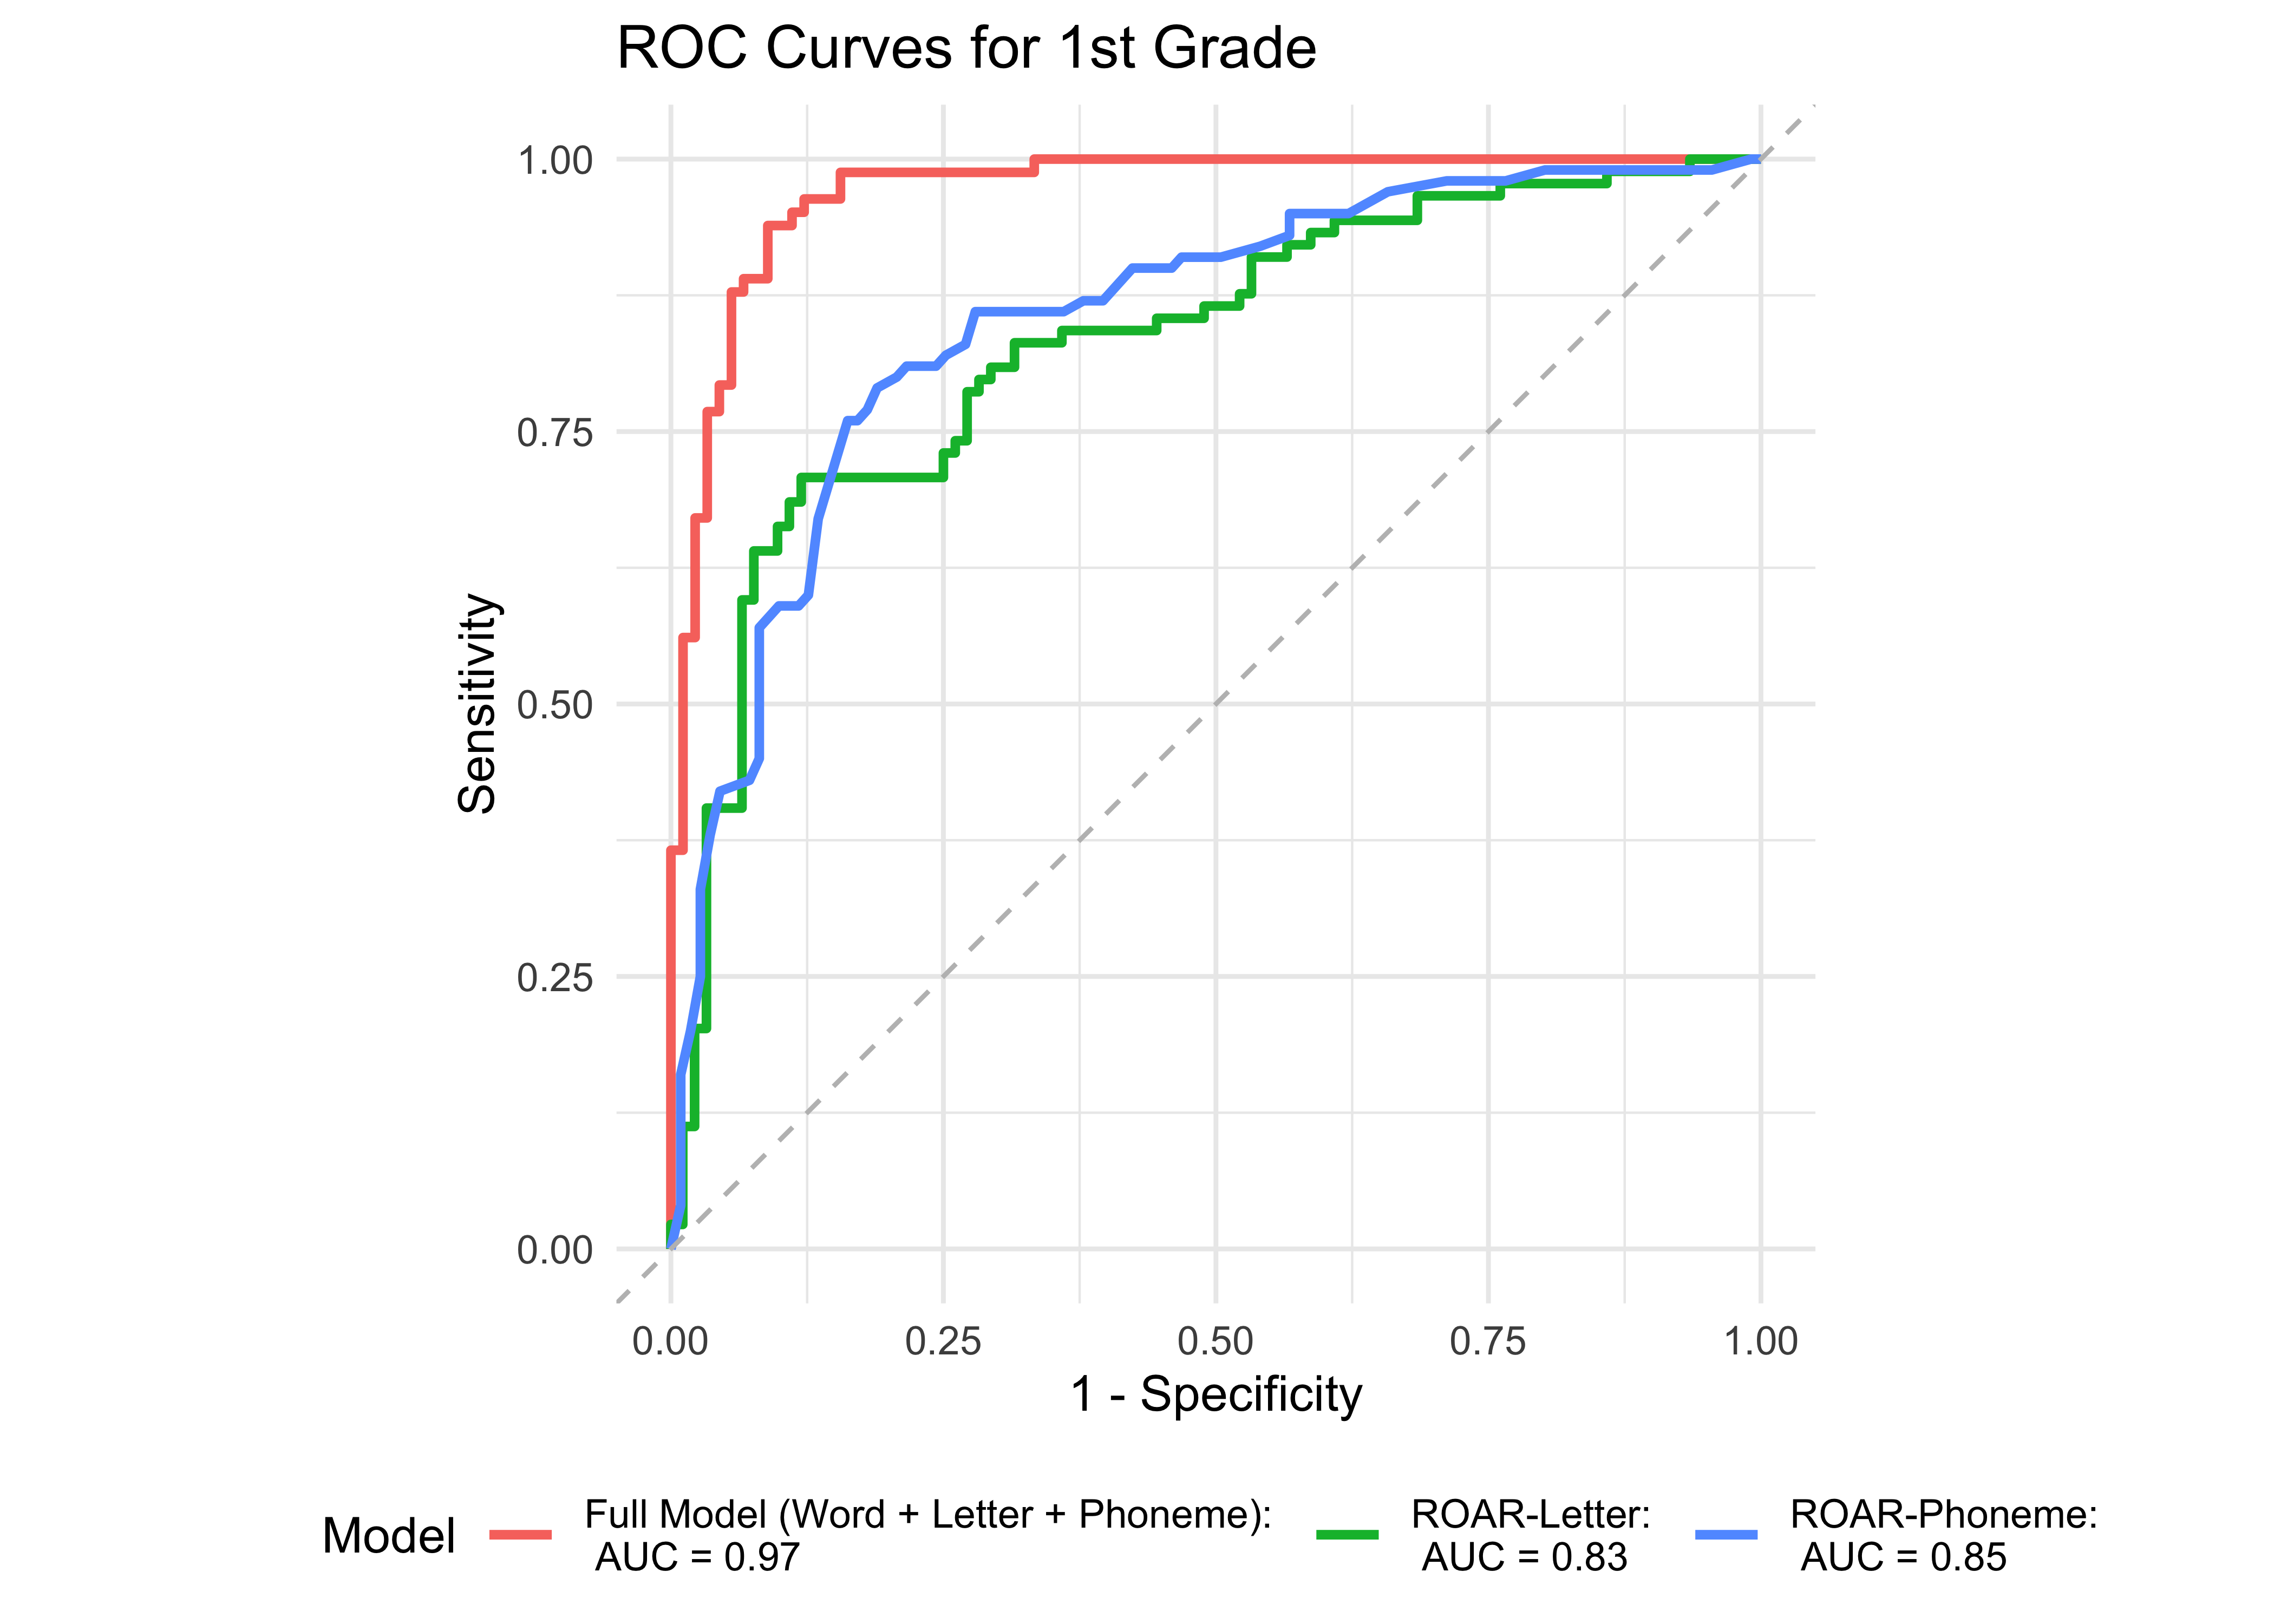
Figure 32.3 shows an ROC curve for the full model with all the ROAR measures (Phoneme, Letter, and Word) compared to models with each individual measure in kindergarten. ROAR-Letter and ROAR-Phoneme both achieved exceptional accuracy and the full model performed marginally better. Figure 32.4 shows ROC curves for the four models in 1st grade. In 1st grade, ROAR-Word is the best single predictor and the full model (ROAR-Letter, ROAR-Phoneme, and ROAR-Word) performs marginally better.


32.2.3.1 ROAR measures of foundational reading skills within seasons
We now examine model accuracy based on a logistic regression model split across various time periods and administrations with combinations of ROAR foundational reading skills measures as predictors. Determining how models perform throughout the school year is an important step in understanding ROAR’s ability to predict students’ reading abilities and FAST™ CBMreading and FAST™ EarlyReading scores at the beginning, middle, and end of the school year.
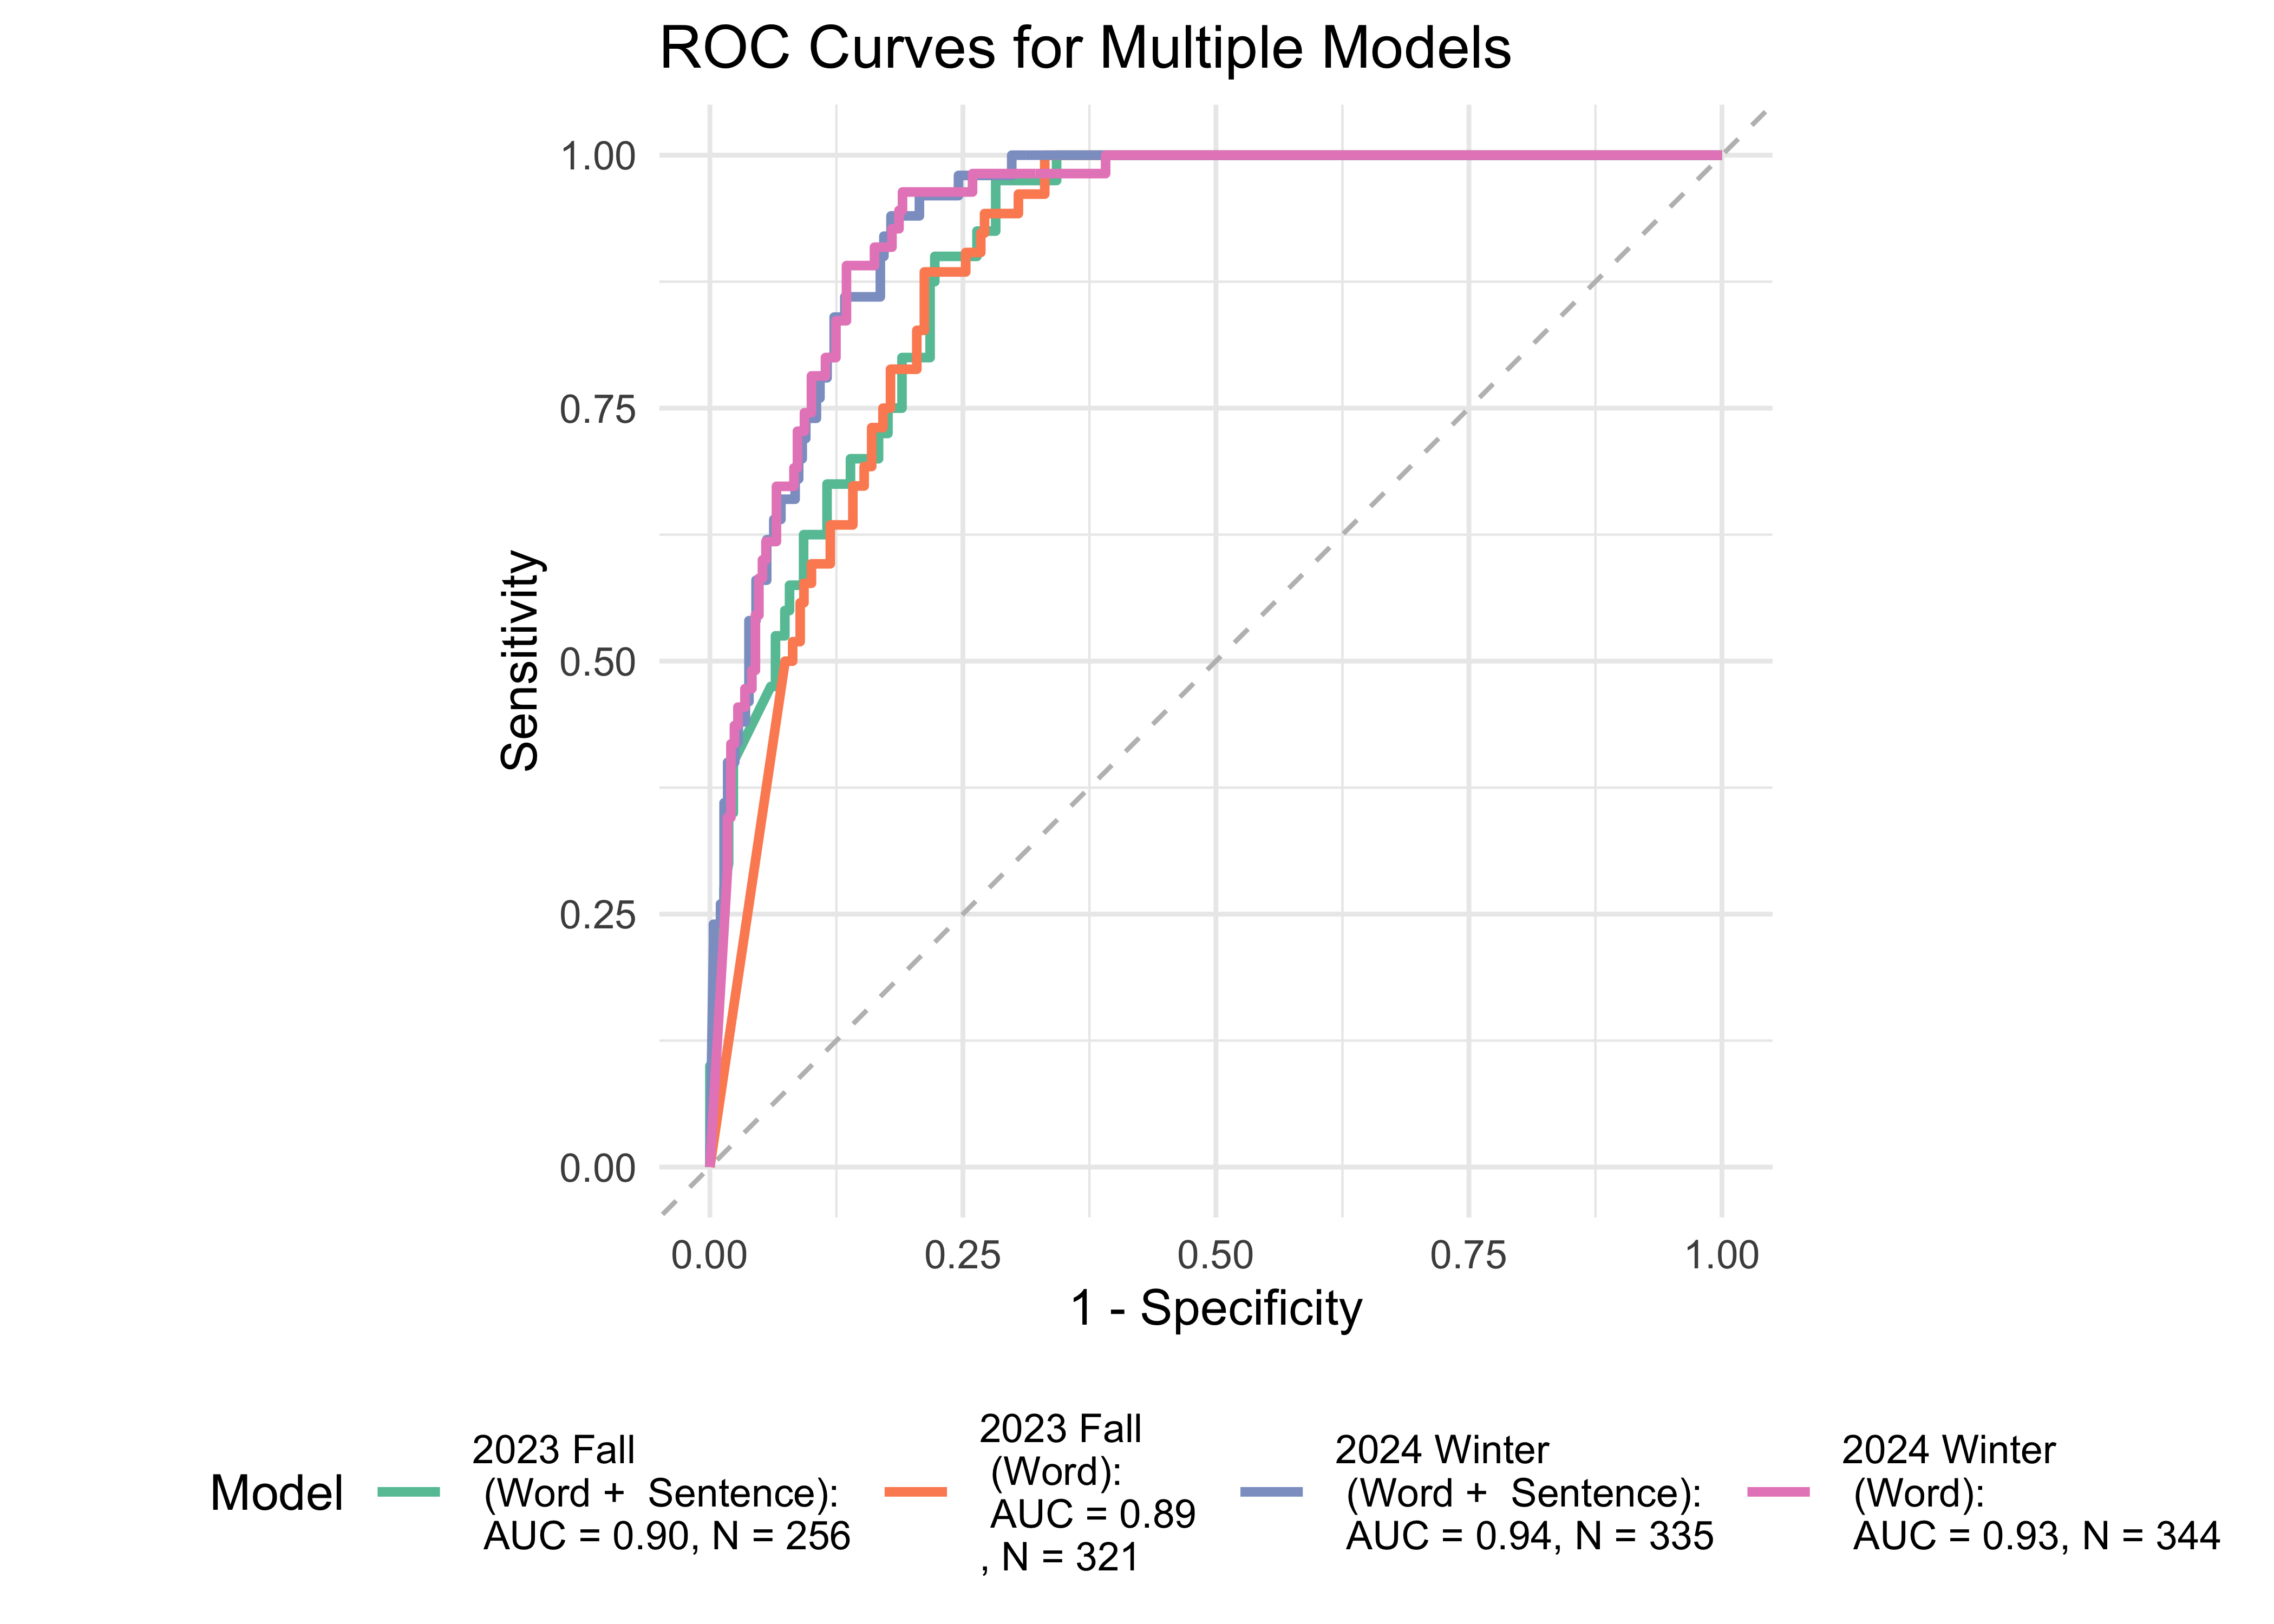
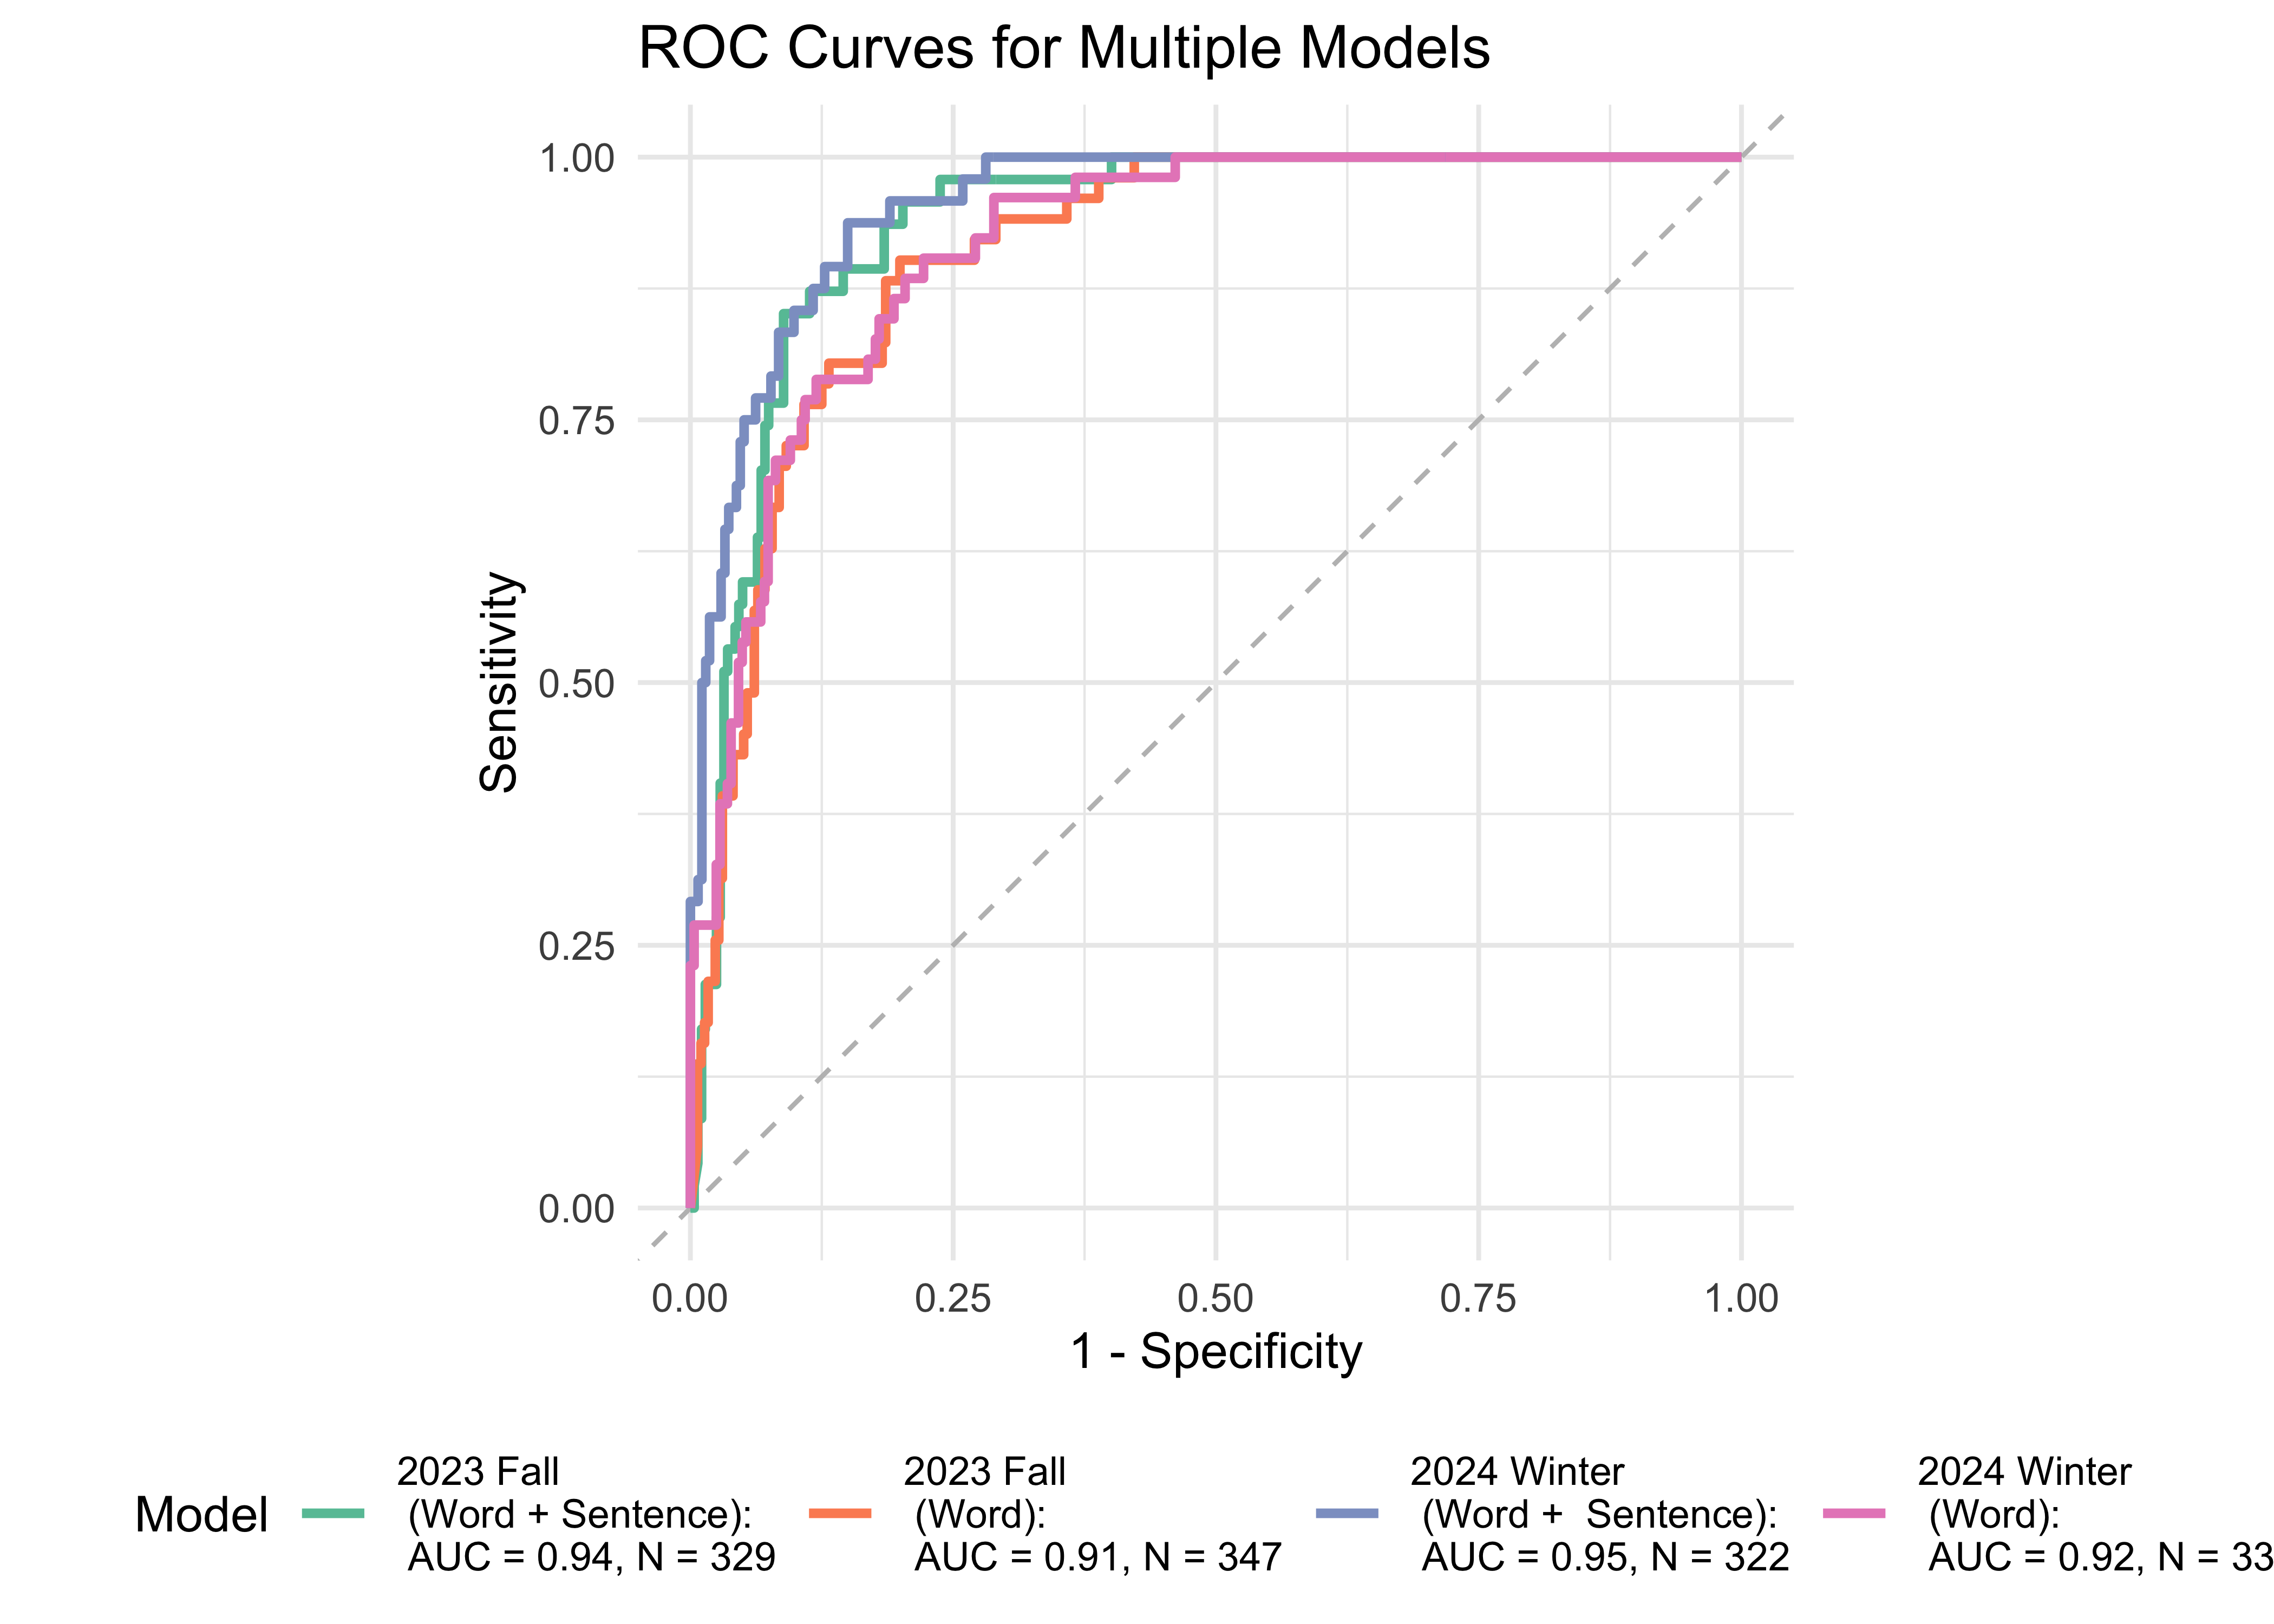
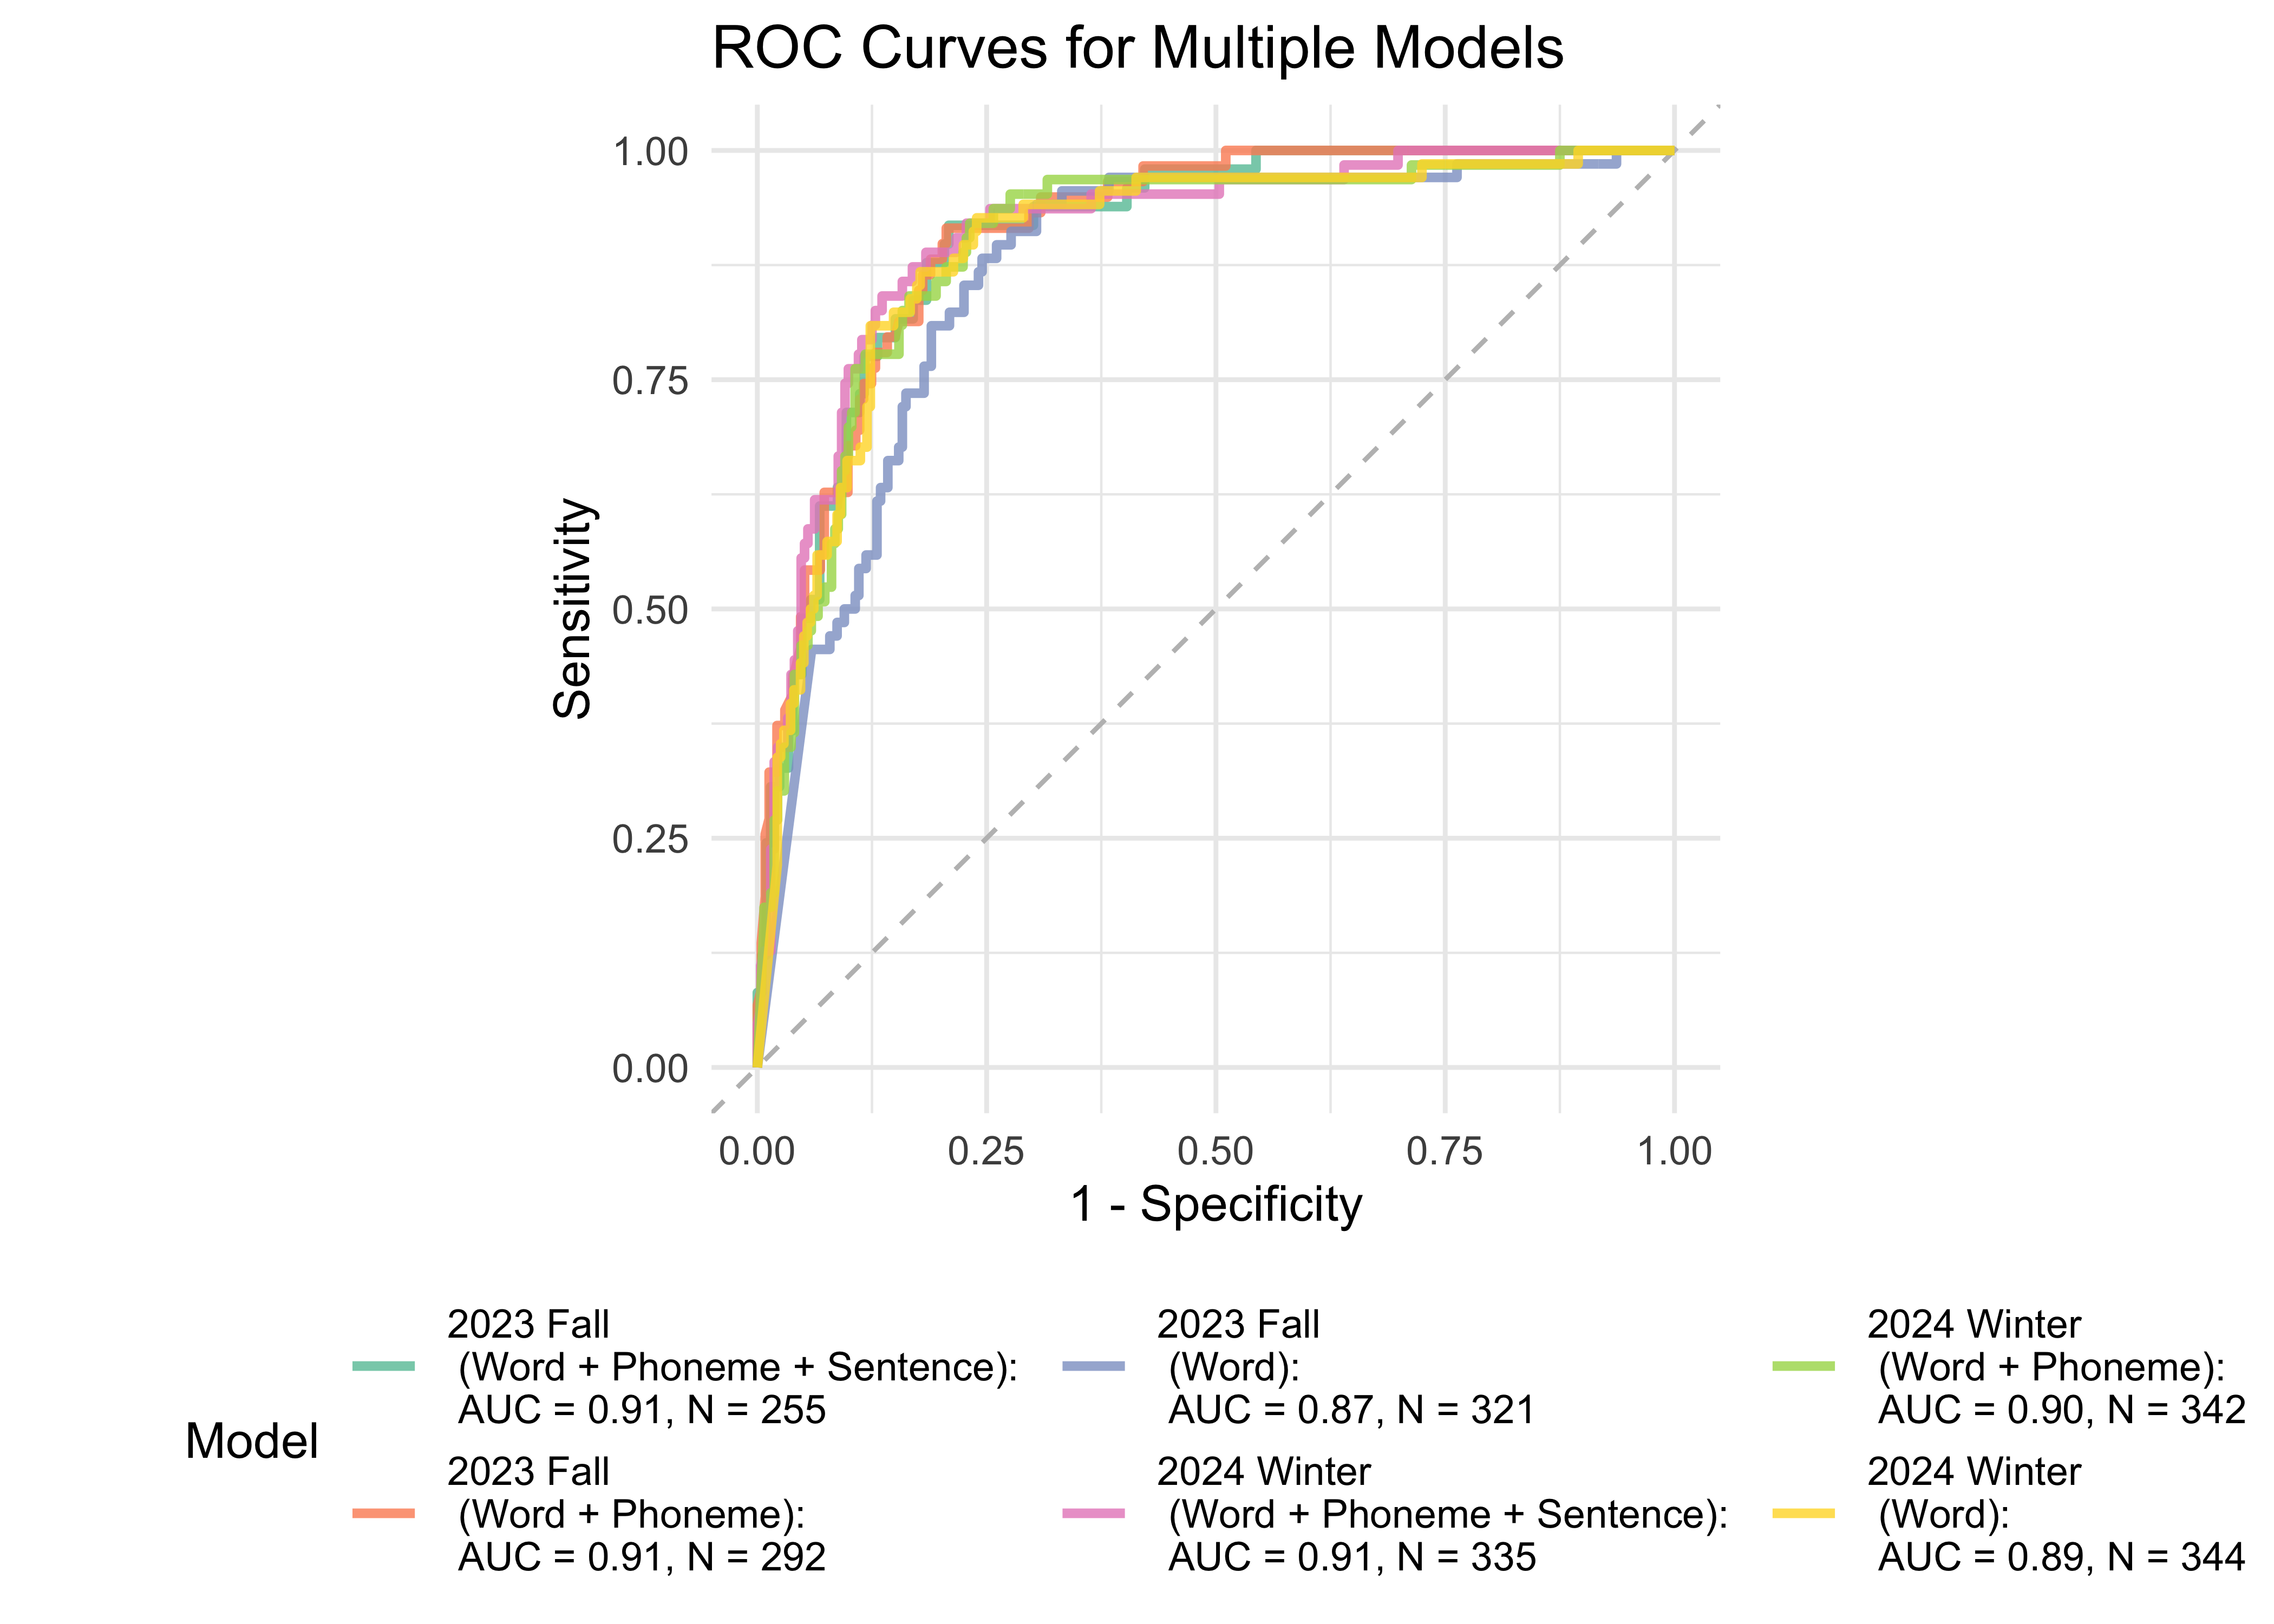
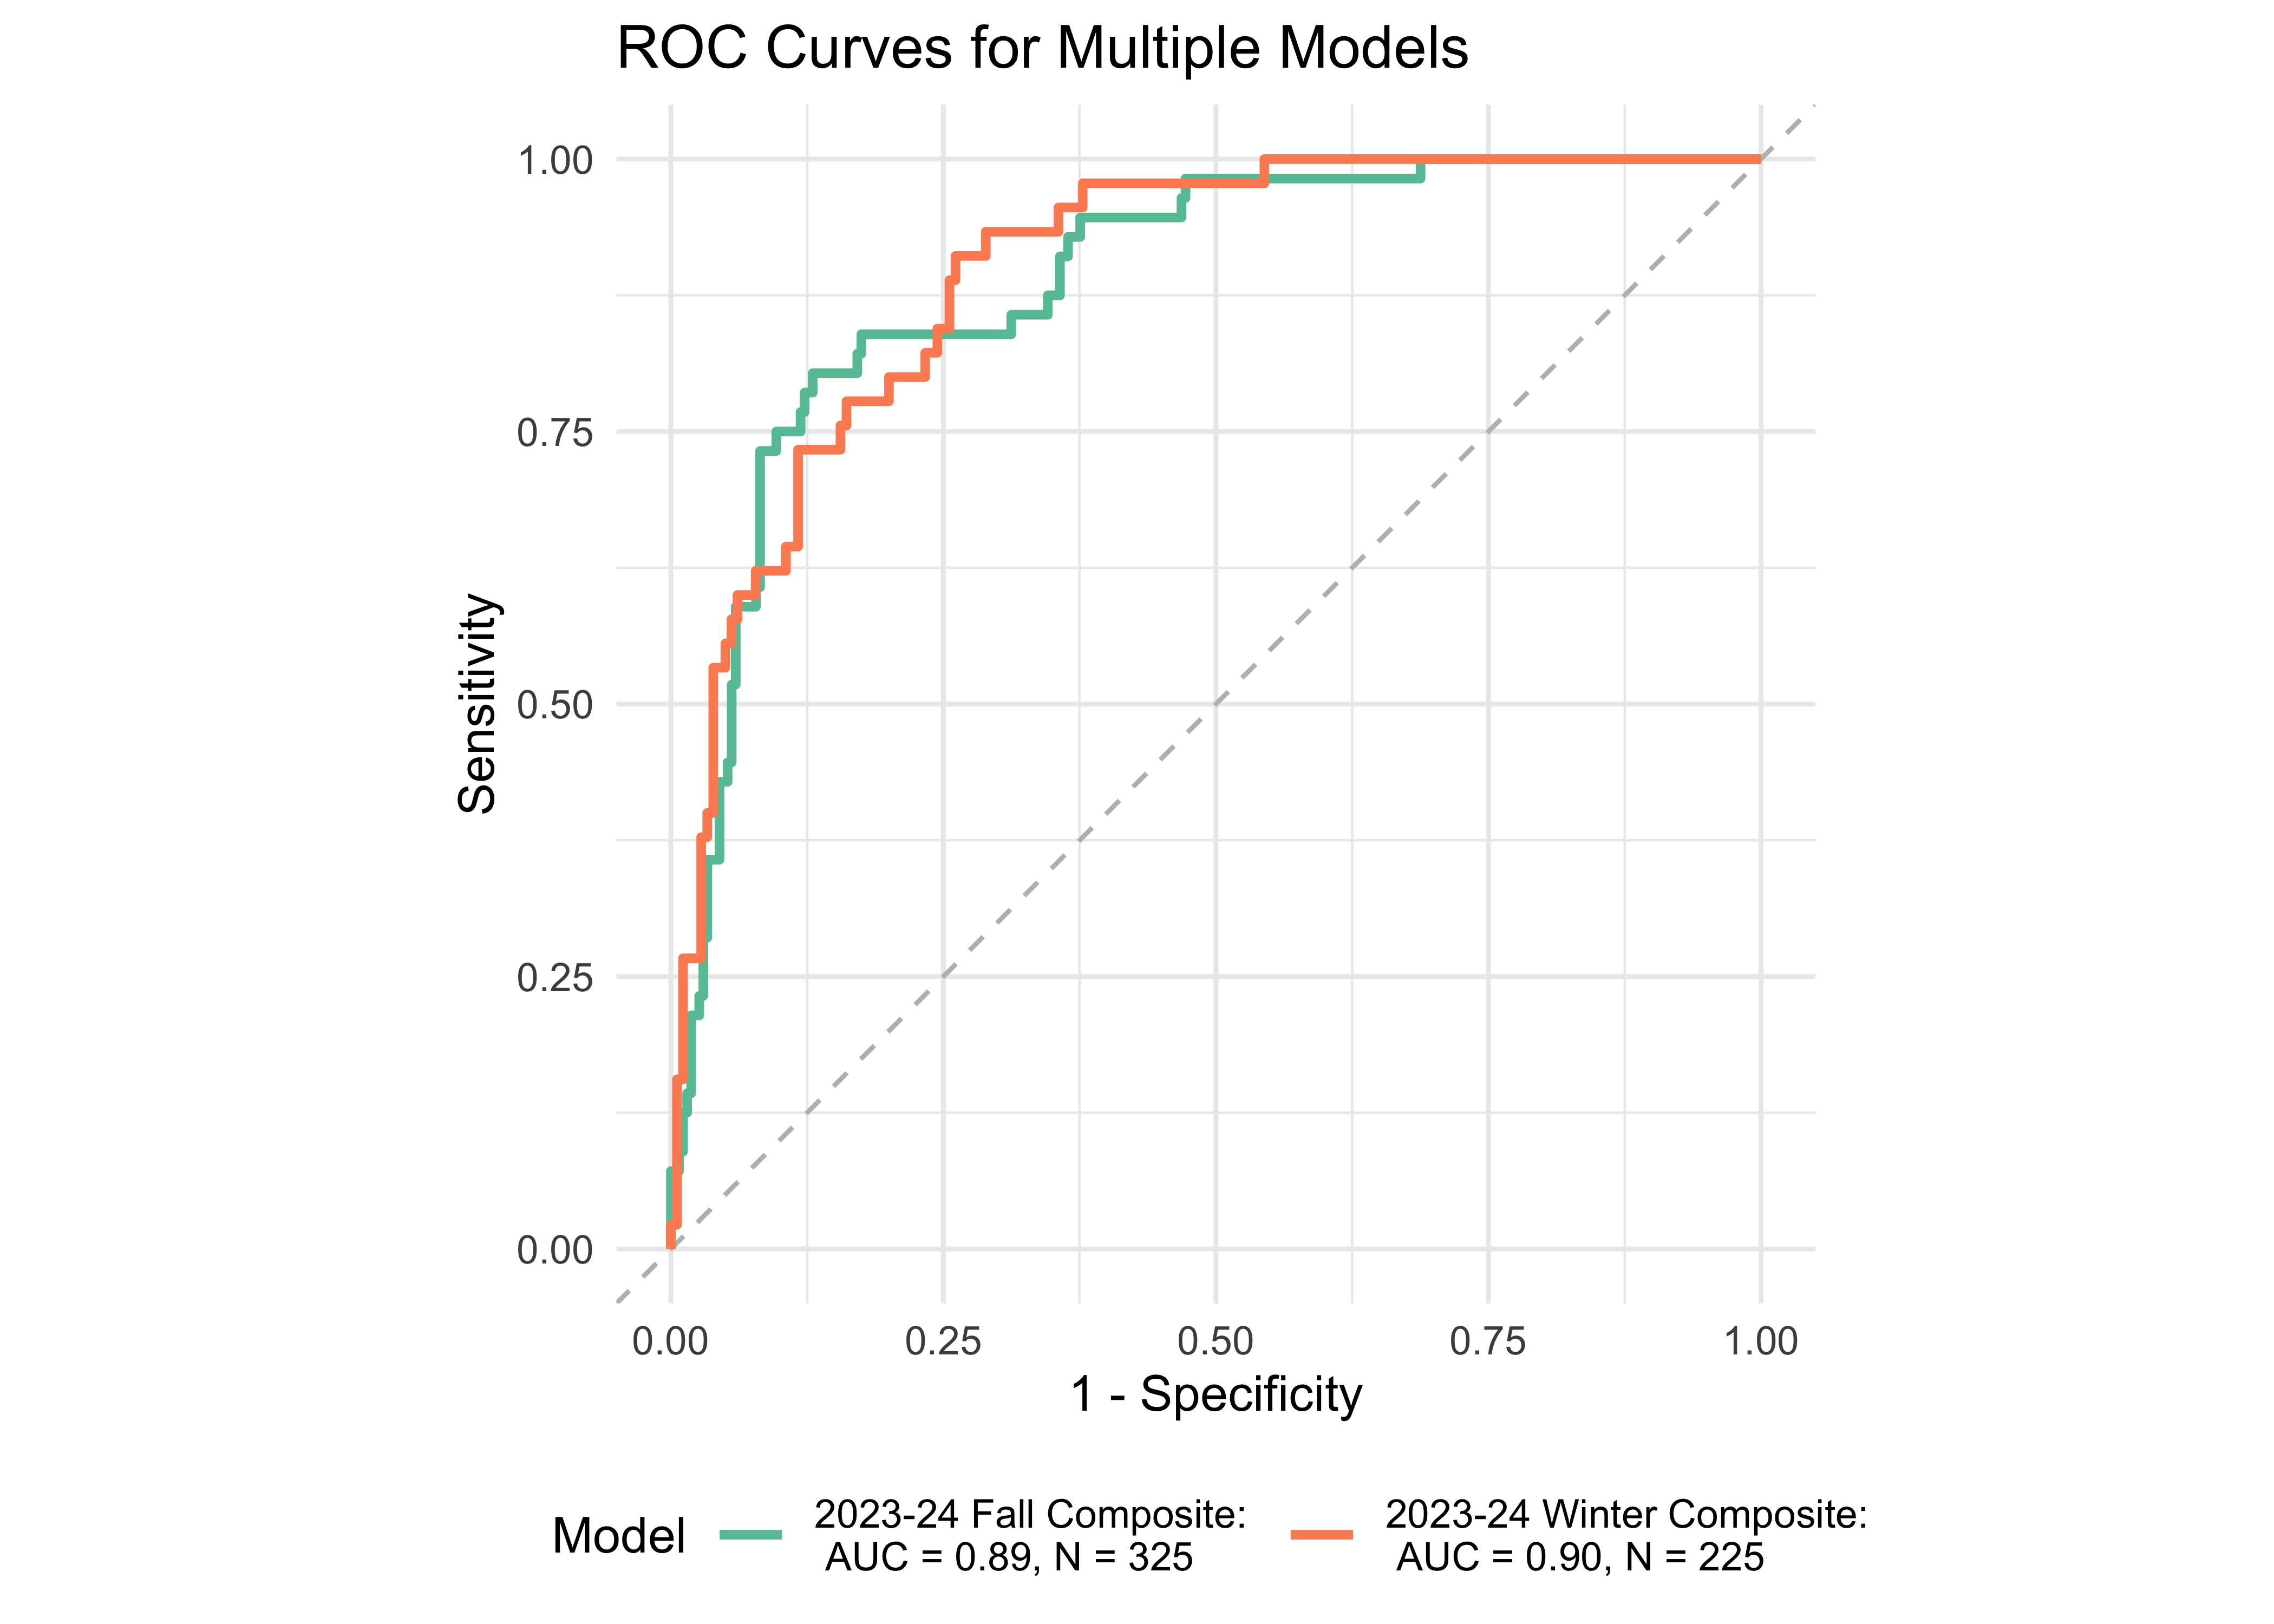
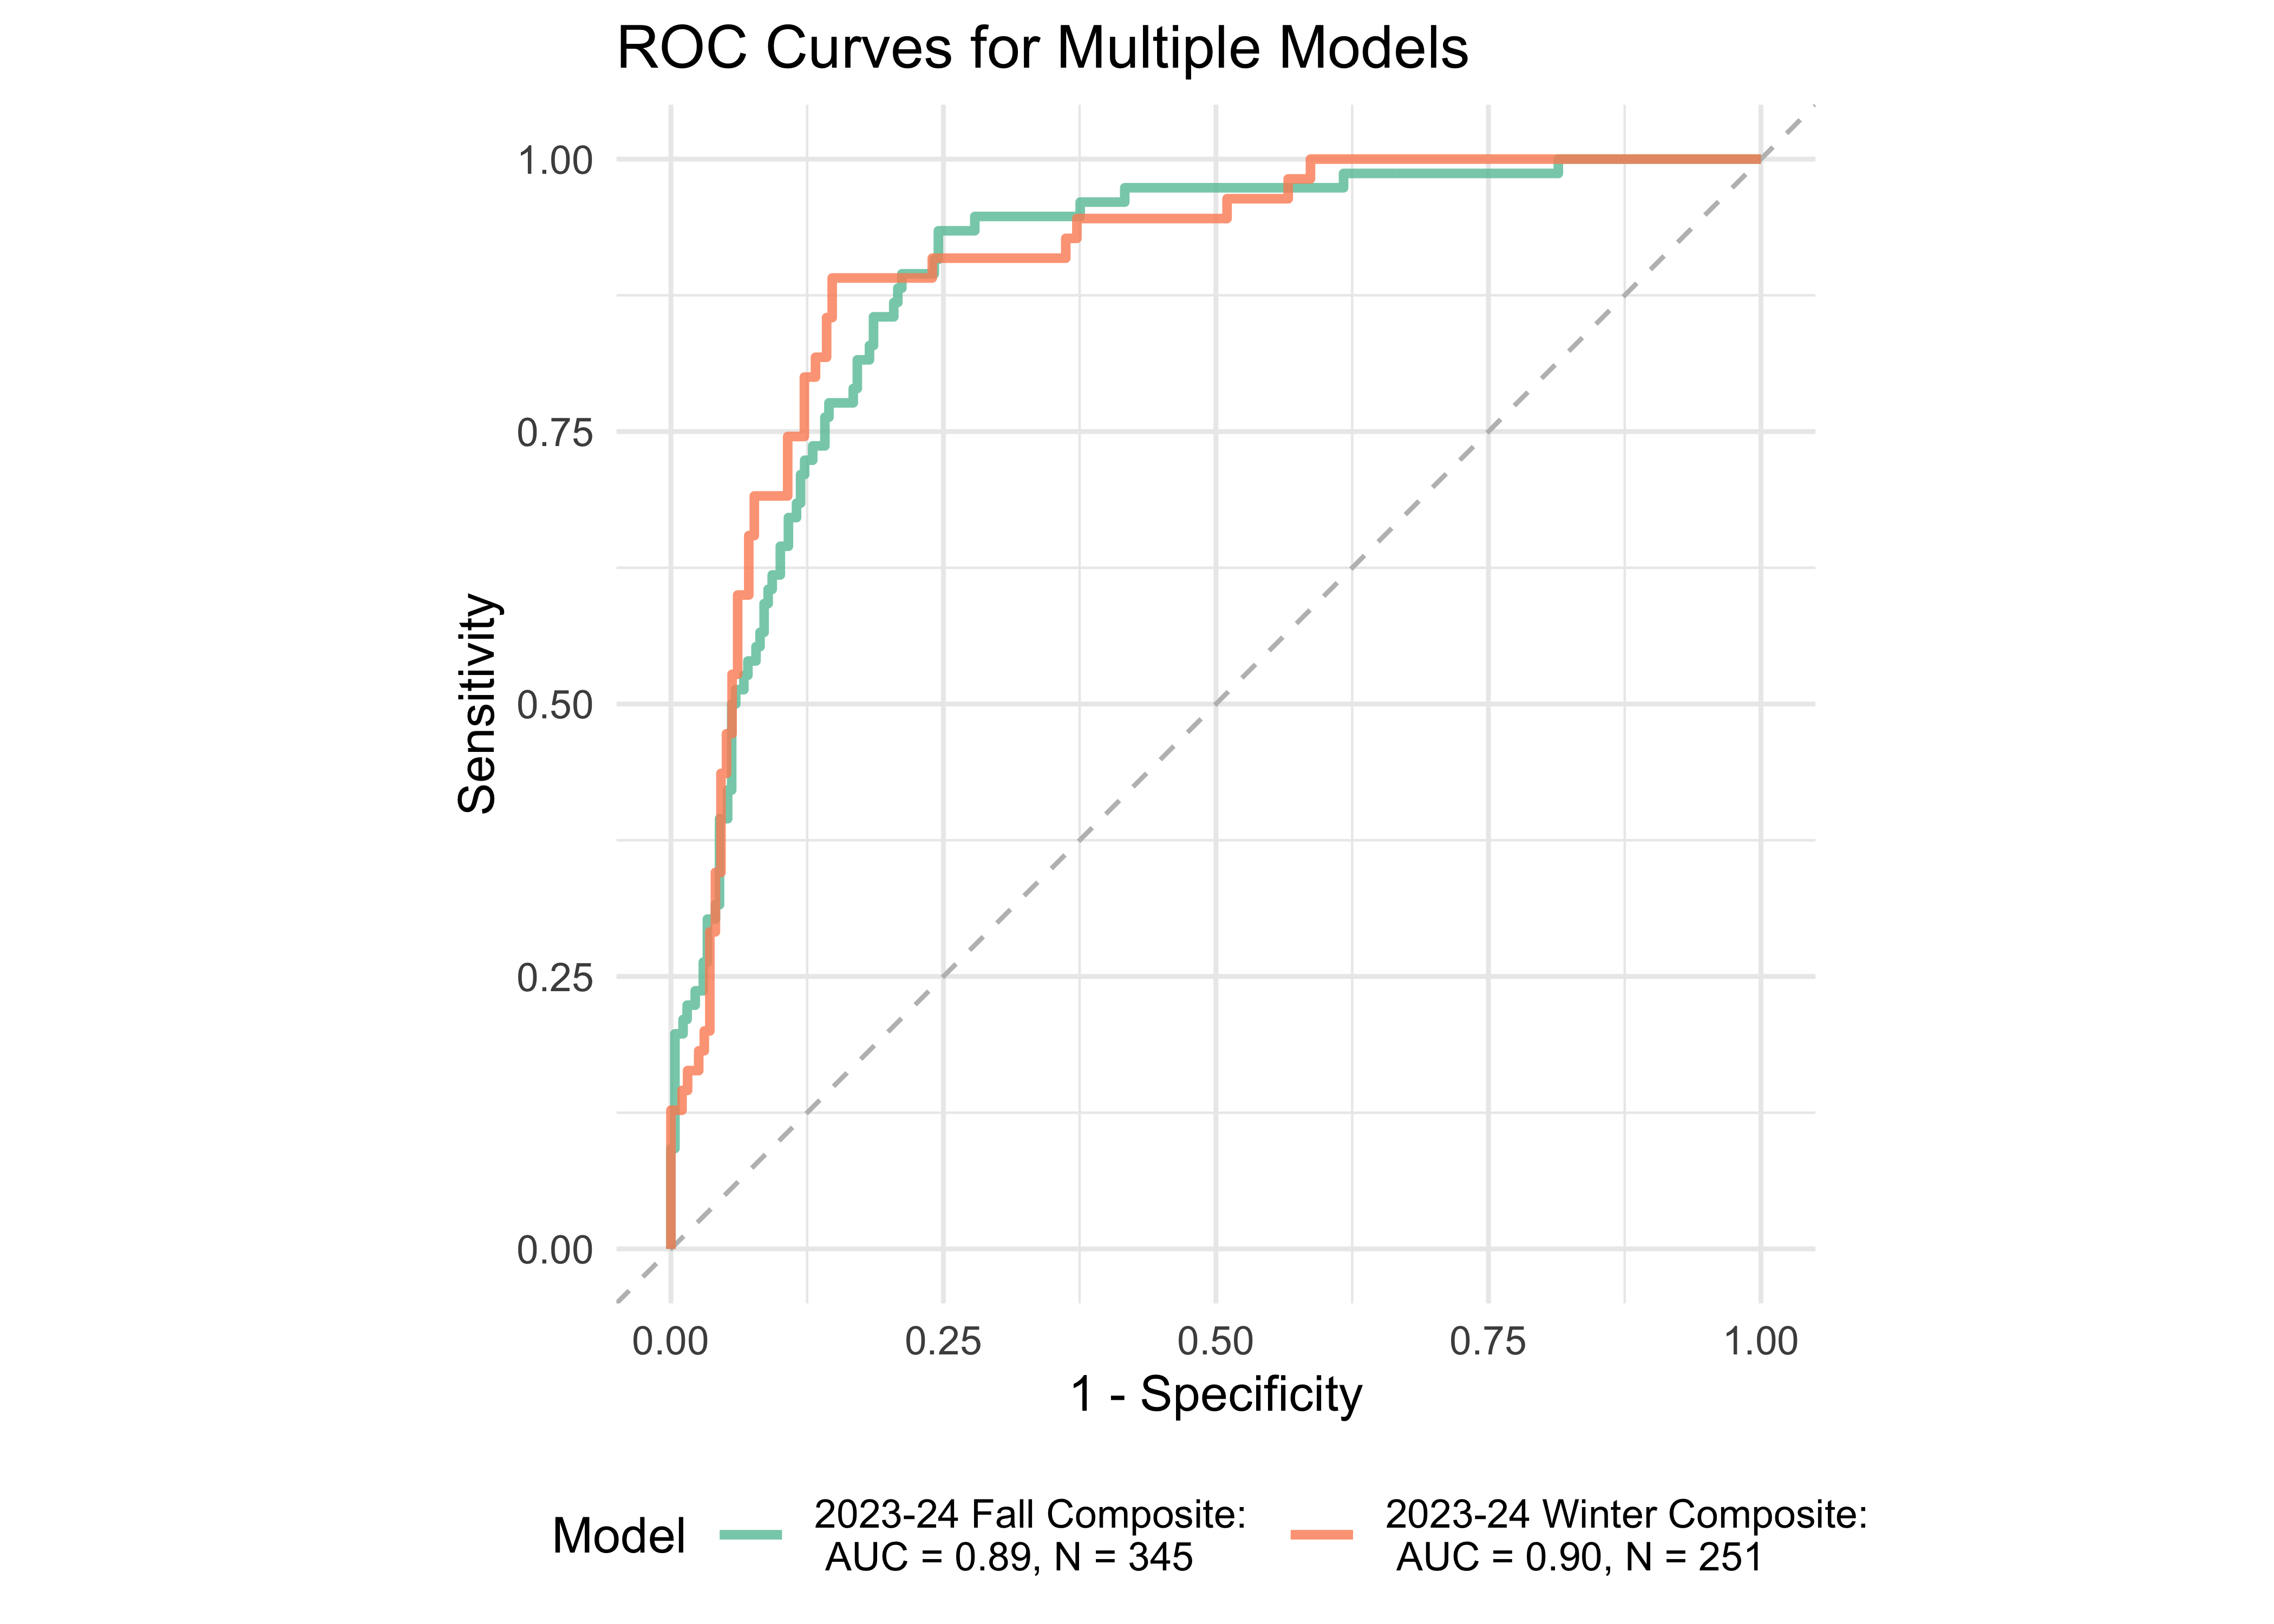
Figure 32.7 shows ROC curves for 1st and 2nd grades computed from a logistic regression model with combinations of ROAR foundational reading skils as predictors of the FAST™ earlyReading “High Risk” category and the FAST™ CBMreading “High Risk” category. The models achieved exceptional accuracy with area under the curve (AUC) greater than 0.87 in both seasons across both 1st and 2nd grade. For 1st graders and 2nd graders, adding ROAR-Sentence in addition to ROAR-Word appears to slightly improve the model in both Fall and Winter for FastBridge CBM Reading. For FastBridge Early Reading, the model performs the best when Phoneme is added in addition to ROAR-Word.
32.2.4 ROAR Composite
The overall ROAR Composite Score is an IRT-based composite using the Letter, Word, and Phoneme measures. We now examine model accuracy based on a logistic regression model. Determining how models perform throughout the school year is an important step in understanding the ability of the ROAR Composite Score to predict students’ reading abilities and FAST™ CBMreading and FAST™ EarlyReading scores.
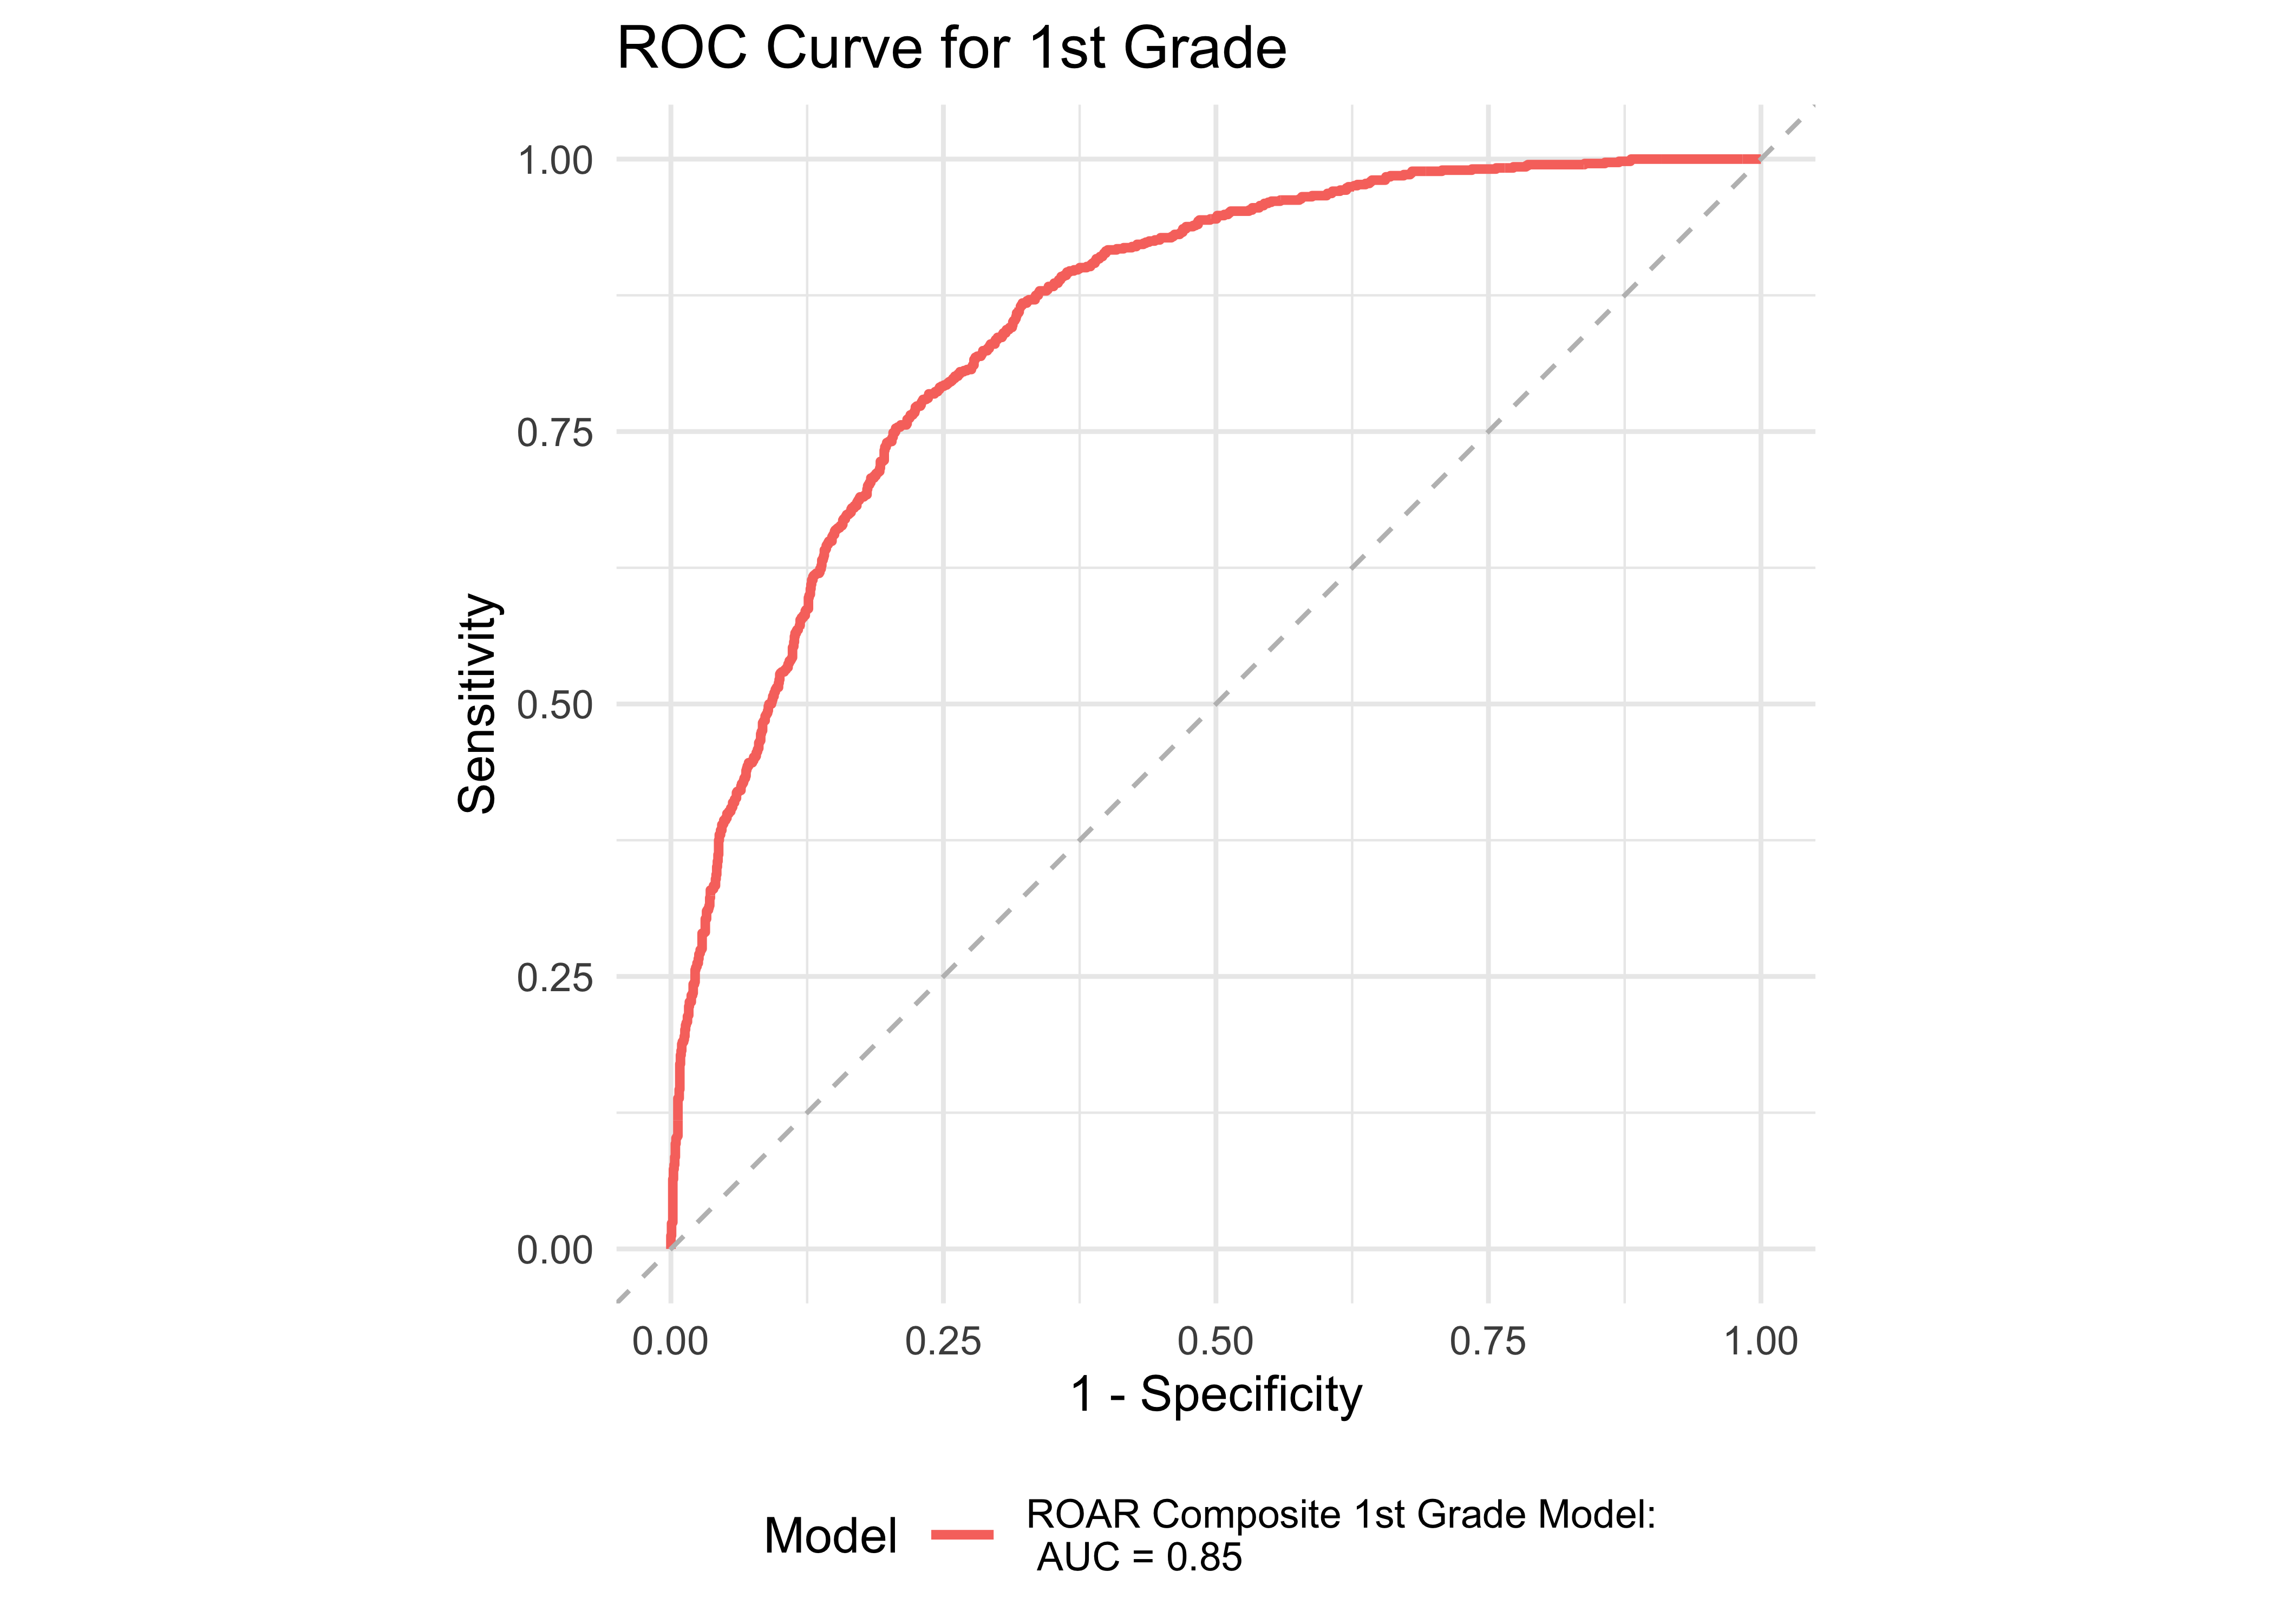
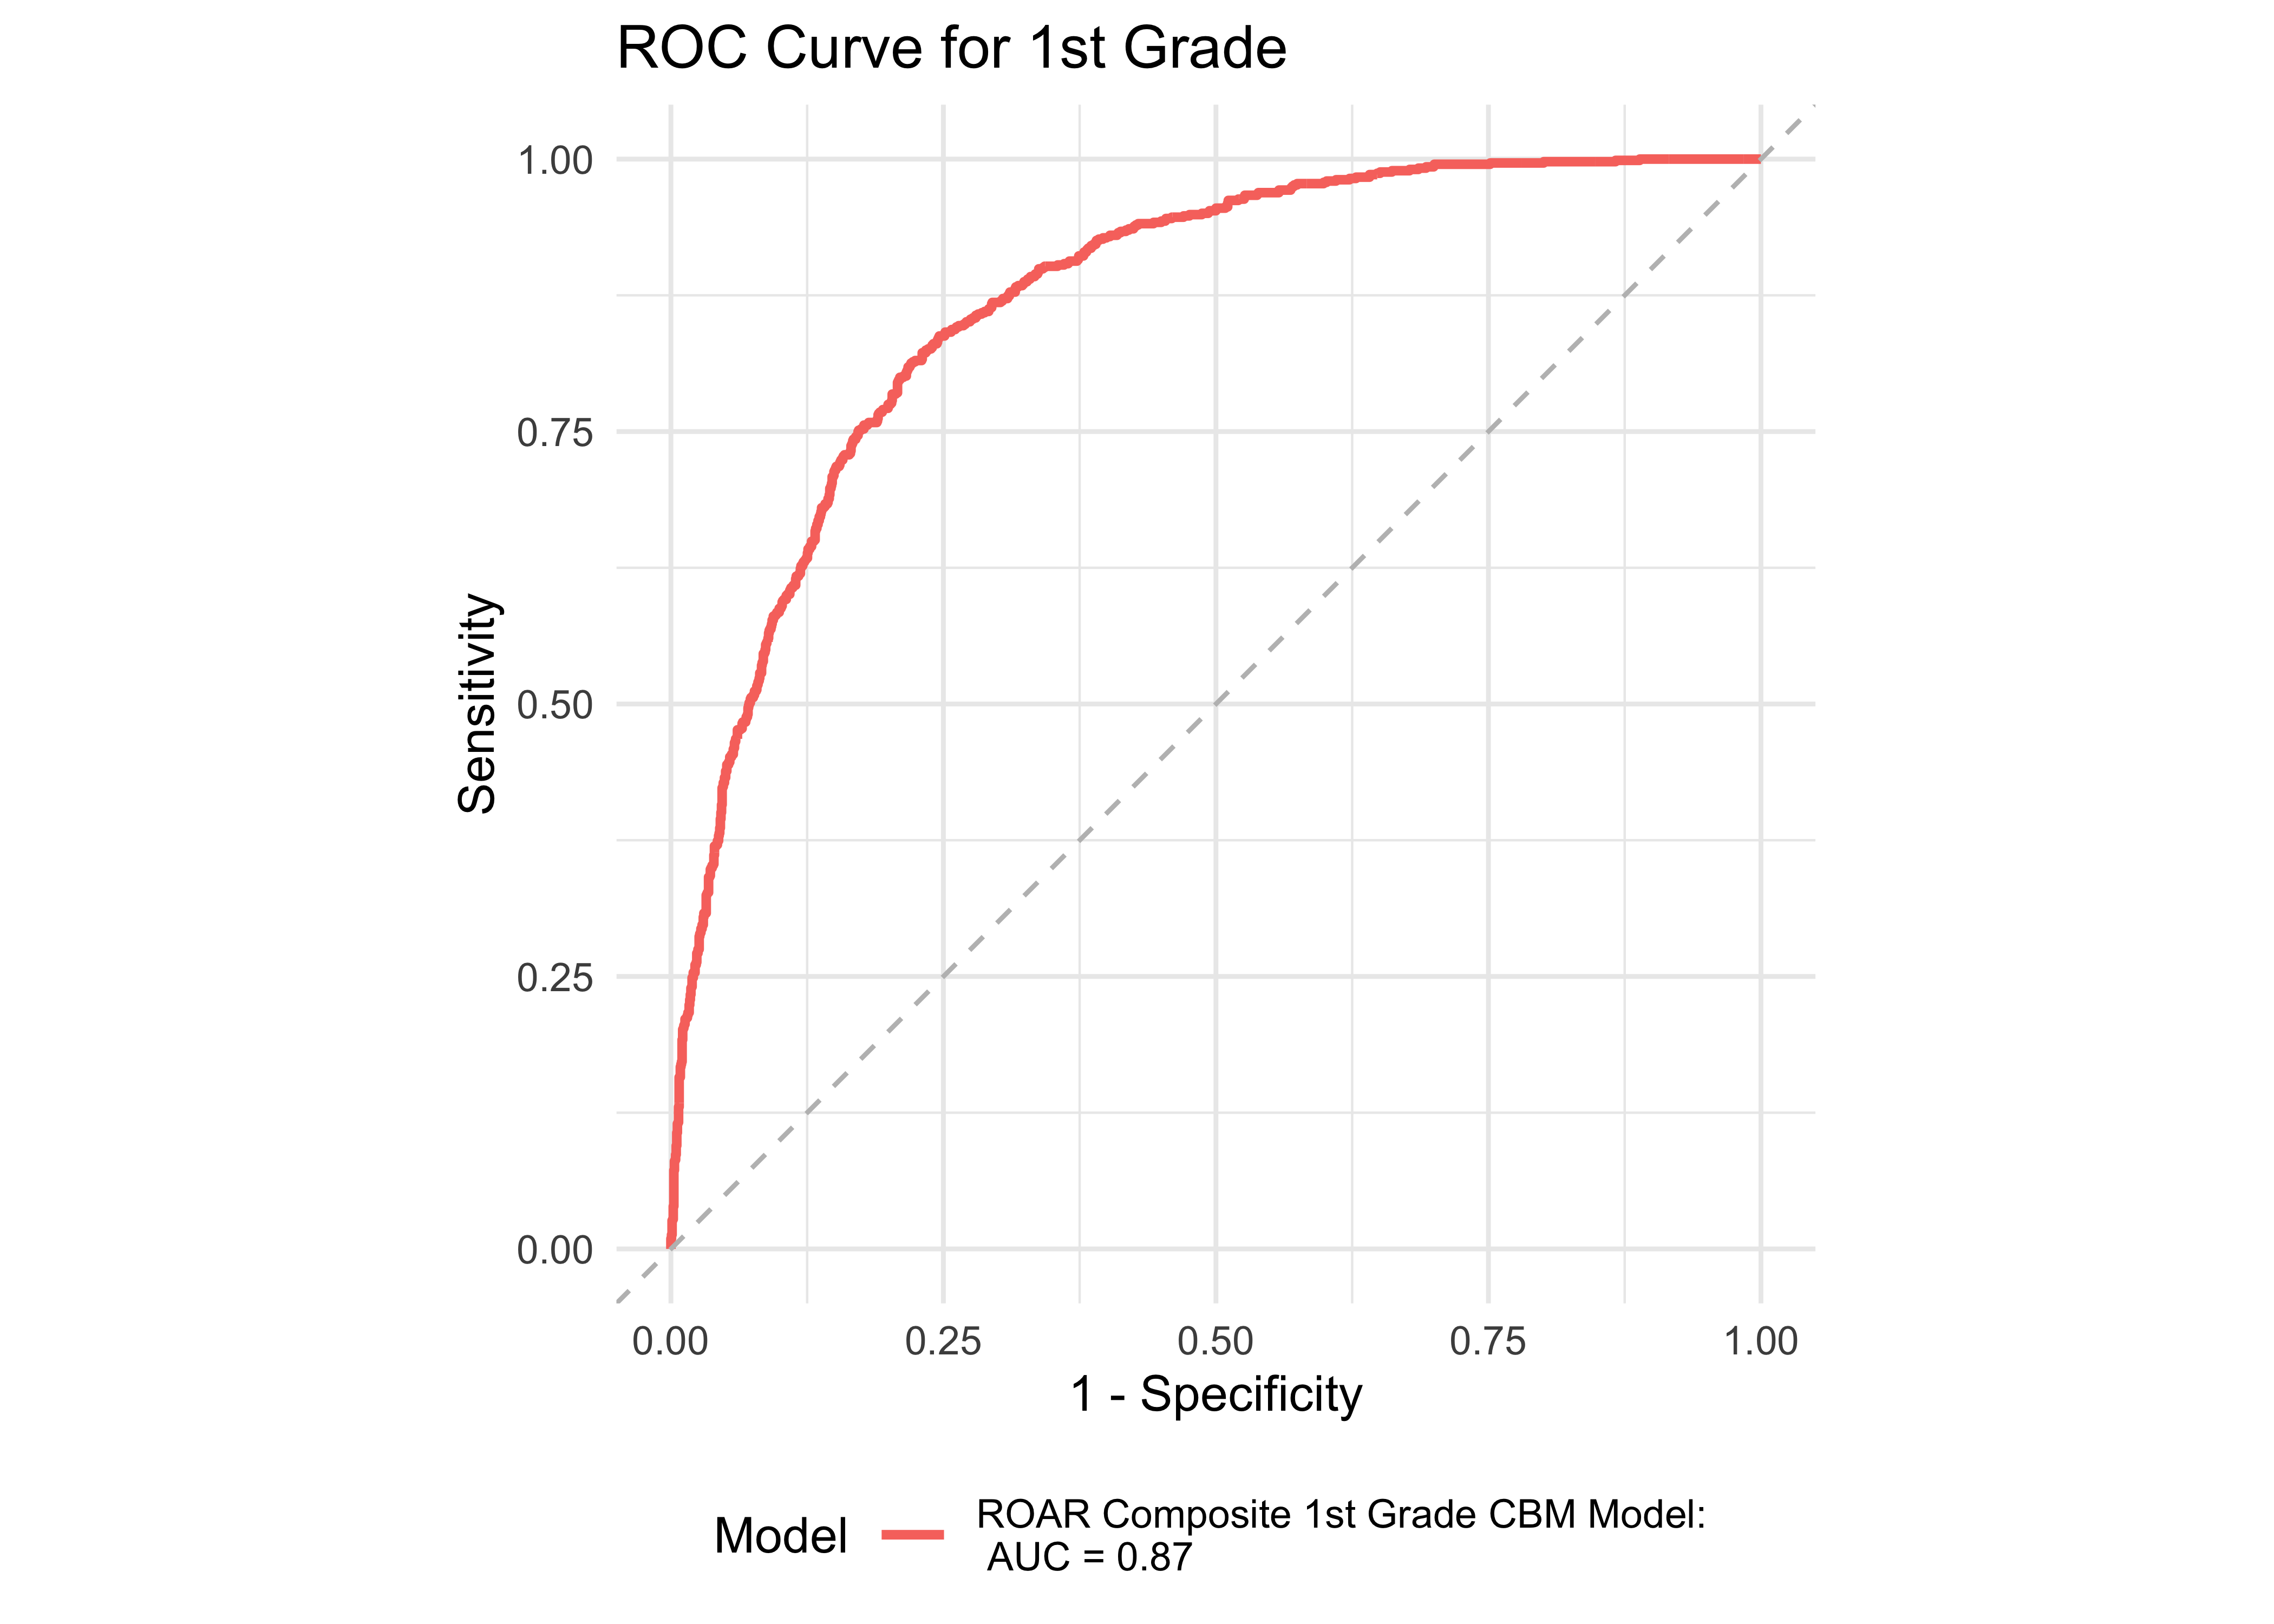
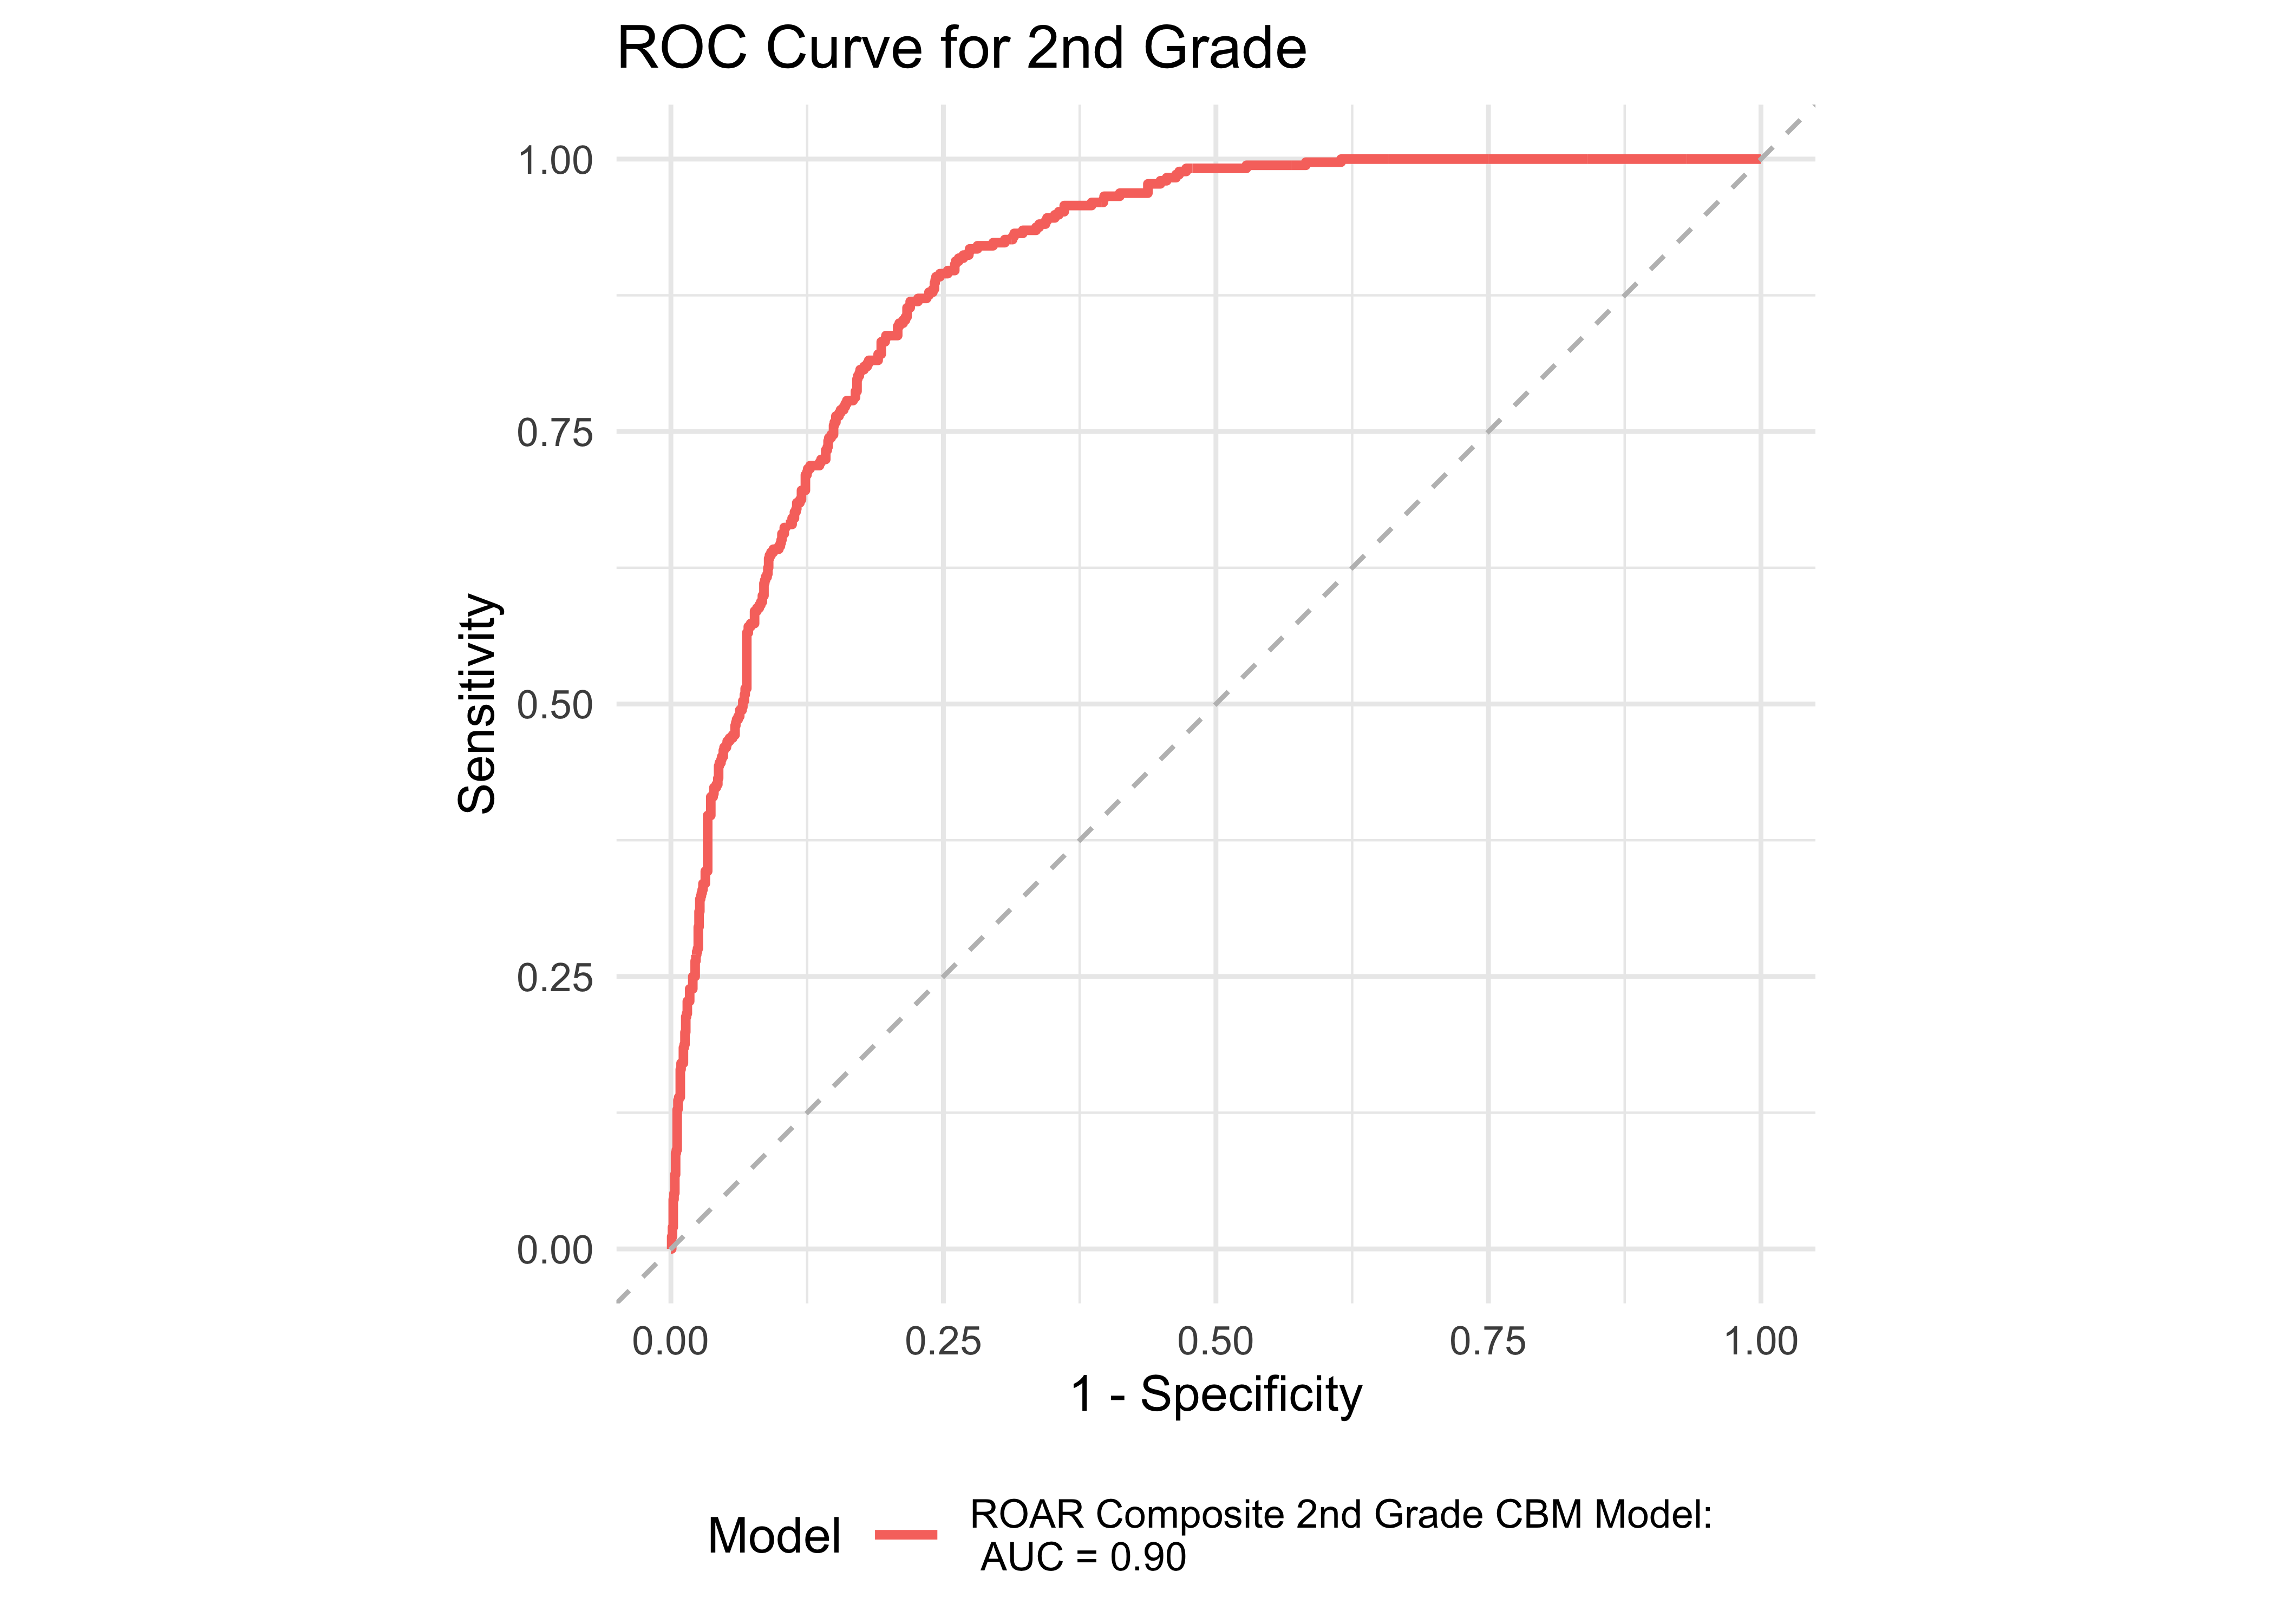
Figure 32.8 shows an ROC curve for Kindergarten and 1st grade computed from a logistic regression model with the ROAR Composite Score as a predictor of the FAST™ earlyReading “High Risk” category. Figure 32.9 shows and ROC curve for 1st and 2nd grades computed from a logistic regression model with ROAR Composite Score as a predictor of the FAST™ CBMreading “High Risk” category. All models in 1st and 2nd grade achieved exceptional accuracy with area under the curve (AUC) greater than 0.85 for both criterion measures. In kindergarten accuracy was lower, which is expected for a model that does not include other screening measures (e.g., Rapid Automatized Naming and Visual Processing). Table 32.7 and Table 32.8 report sensitivity, specificity and accuracy by each demographic for which there were more than 10 participants. Table 32.9 and Table 32.10 report sensitivity, specificity and accuracy by each demographic for which there were more than 10 participants. Best sensitivity and specificity are determined using Youden’s J statistic (Youden 1950). The optimal cut-off is the threshold that maximizes the distance to the identity (diagonal) line. The optimality criterion is: \(max(sensitivities + sensitivities)\)
| Demographic Group | Grade | AUC | Best Specificity | Best Sensitivity | Specificity (Sensitivity at 0.9) | Sensitivity at 0.9 | N |
|---|---|---|---|---|---|---|---|
| English Learner | Kindergarten | 0.79 | 0.75 | 0.83 | 0.38 | 0.92 | 32 |
| Female | Kindergarten | 0.79 | 0.73 | 0.77 | 0.31 | 0.92 | 93 |
| Male | Kindergarten | 0.71 | 0.55 | 0.81 | 0.36 | 0.91 | 98 |
| White | Kindergarten | 0.71 | 0.65 | 0.74 | 0.22 | 0.91 | 108 |
| Hispanic Ethnicity | Kindergarten | 0.76 | 0.45 | 1.00 | 0.45 | 0.92 | 50 |
| Free or Reduced Lunch | Kindergarten | 0.92 | 1.00 | 0.76 | 0.60 | 0.90 | 26 |
| All | Kindergarten | 0.75 | 0.64 | 0.77 | 0.38 | 0.90 | 192 |
| Demographic Group | Grade | AUC | Best Specificity | Best Sensitivity | Specificity (Sensitivity at 0.9) | Sensitivity at 0.9 | N |
|---|---|---|---|---|---|---|---|
| English Learner | 1 | 0.89 | 0.82 | 0.79 | 0.62 | 0.90 | 302 |
| Female | 1 | 0.85 | 0.70 | 0.86 | 0.62 | 0.90 | 1327 |
| Male | 1 | 0.85 | 0.76 | 0.79 | 0.62 | 0.90 | 1362 |
| White | 1 | 0.84 | 0.68 | 0.88 | 0.61 | 0.90 | 906 |
| Hispanic Ethnicity | 1 | 0.89 | 0.86 | 0.77 | 0.62 | 0.90 | 562 |
| Black or African American | 1 | 0.68 | 0.62 | 0.80 | NA | NA | 18 |
| Multiracial | 1 | 0.82 | 0.70 | 0.82 | 0.58 | 0.91 | 305 |
| SPED | 1 | 0.89 | 0.89 | 0.79 | 0.63 | 0.90 | 108 |
| Free or Reduced Lunch | 1 | 0.87 | 0.79 | 0.82 | 0.59 | 0.90 | 438 |
| All | 1 | 0.85 | 0.77 | 0.78 | 0.62 | 0.90 | 2696 |
| Demographic Group | Grade | AUC | Best Specificity | Best Sensitivity | Specificity (Sensitivity at 0.9) | Sensitivity at 0.9 | N |
|---|---|---|---|---|---|---|---|
| English Learner | 1 | 0.91 | 0.82 | 0.89 | 0.80 | 0.90 | 302 |
| Female | 1 | 0.87 | 0.77 | 0.82 | 0.65 | 0.90 | 1327 |
| Male | 1 | 0.87 | 0.76 | 0.84 | 0.64 | 0.90 | 1362 |
| White | 1 | 0.85 | 0.77 | 0.80 | 0.62 | 0.90 | 906 |
| Hispanic Ethnicity | 1 | 0.90 | 0.87 | 0.82 | 0.68 | 0.90 | 562 |
| Asian | 1 | 0.84 | 0.77 | 0.78 | 0.60 | 0.90 | 751 |
| Multiracial | 1 | 0.86 | 0.75 | 0.84 | 0.56 | 0.90 | 305 |
| SPED | 1 | 0.90 | 0.85 | 0.88 | 0.64 | 0.91 | 108 |
| Free or Reduced Lunch | 1 | 0.88 | 0.81 | 0.83 | 0.67 | 0.90 | 438 |
| All | 1 | 0.87 | 0.78 | 0.81 | 0.66 | 0.90 | 2696 |
| Demographic Group | Grade | AUC | Best Specificity | Best Sensitivity | Specificity (Sensitivity at 0.9) | Sensitivity at 0.9 | N |
|---|---|---|---|---|---|---|---|
| English Learner | 2 | 0.82 | 0.65 | 0.86 | 0.60 | 0.90 | 196 |
| Female | 2 | 0.92 | 0.77 | 0.96 | 0.80 | 0.91 | 935 |
| Male | 2 | 0.87 | 0.76 | 0.82 | 0.61 | 0.91 | 806 |
| White | 2 | 0.90 | 0.78 | 0.92 | 0.78 | 0.91 | 462 |
| Hispanic Ethnicity | 2 | 0.89 | 0.88 | 0.80 | 0.63 | 0.90 | 125 |
| Asian | 2 | 0.88 | 0.80 | 0.85 | 0.67 | 0.90 | 535 |
| Multiracial | 2 | 0.86 | 0.80 | 0.80 | 0.54 | 0.91 | 395 |
| SPED | 2 | 0.85 | 0.69 | 0.92 | 0.54 | 0.92 | 26 |
| Free or Reduced Lunch | 2 | 0.91 | 0.72 | 0.97 | 0.75 | 0.90 | 190 |
| All | 2 | 0.90 | 0.78 | 0.87 | 0.74 | 0.90 | 1746 |
32.2.4.1 ROAR Composite within seasons
We now examine model accuracy based on a logistic regression model split across various time periods and administrations with combinations of the ROAR Composite Score as a predictor. Determining how models perform throughout the school year is an important step in understanding ROAR’s ability to predict students’ reading abilities and FAST™ CBMreading and FAST™ EarlyReading scores at the beginning, middle, and end of the school year.
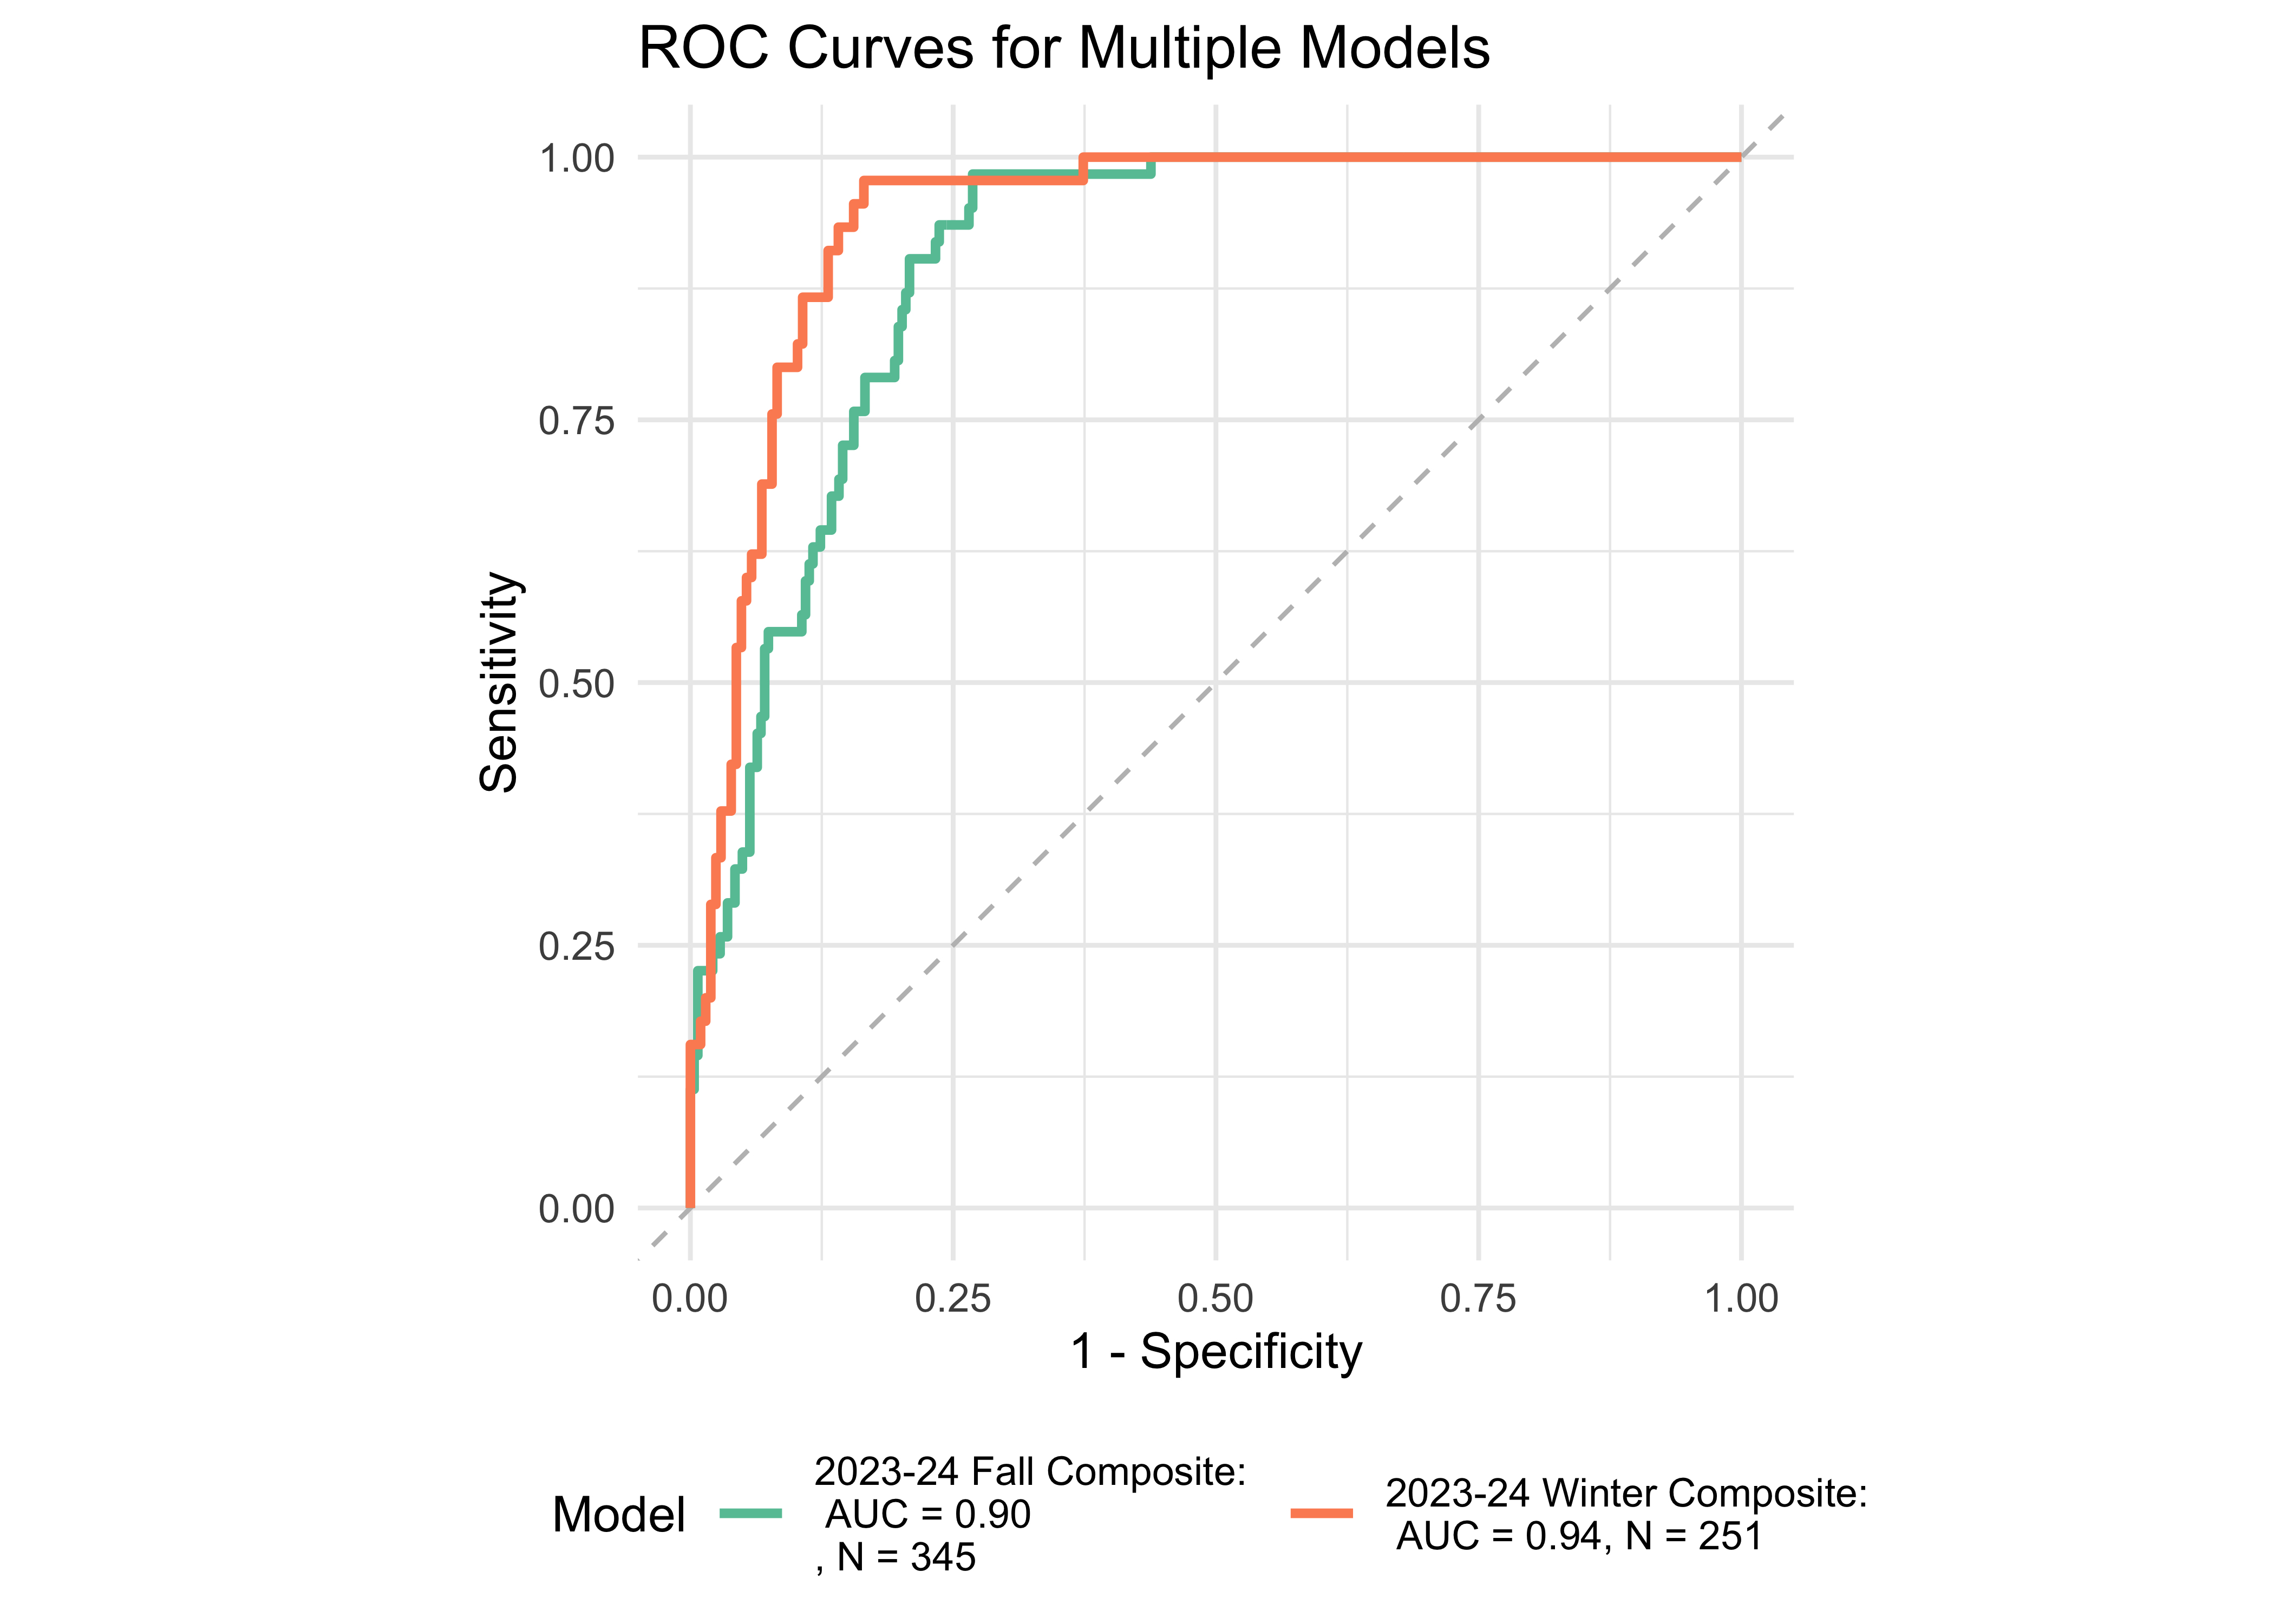
Figure 32.10 shows an ROC curve for 1st and 2nd grades computed from a logistic regression model with the ROAR Composite Score as a predictor of the FAST™ earlyReading “High Risk” category and the FAST™ CBMreading “High Risk” category. The models achieved exceptional accuracy with area under the curve (AUC) greater than 0.89 in both seasons across both 1st and 2nd grade.
32.3 Study 2: Woodcock Johnson Basic Reading Skills (WJ BRS)
A study with participants recruited from schools around the United States that uses the Woodcock Johnson Basic Reading Skills Composite Index (WJ BRS) as the criterion measure. WJ BRS is the most widely used measure in dyslexia research for identifying characteristics of dyslexia and is one of the most widely used measures in special education and clinical practice for diagnosing dyslexia. For this study of criterion validity, we use a threshold of the 25th percentile based on national norms to define students at risk or with indications of dyslexia and we calculate prediction accuracy, sensitivity and specificity of ROAR Foundational Reading Skills relative to this criterion.
32.3.1 Sample demographics
This study included participants recruited from all around the United States for research studies in the Brain Development & Education Lab and through research practice partnerships with multiple school districts. Figure 27.3 shows the age distribution and Table 27.1 shows the demographics of the students that participated in this validation study.
Table 32.11 shows the distribution of students in the sample across Woodcock Johnson Basic Reading Skills (BRS) risk categories. Note that the original risk categories for Woodcock Johnson BRS were not used, rather, we defined the three level risk categories. Low risk included students who were greater than the 50th percentile, some risk included students who were between the 25th and 50th percentiles, and high risk included students who were below the 25th percentile.
| Age Range | WJ Reading Risk | N | Proportion of Risk Level |
|---|---|---|---|
| Kindergarten | High Risk | 56 | 24.3% |
| Kindergarten | Some Risk | 61 | 26.5% |
| Kindergarten | Low Risk | 113 | 49.1% |
| 1st | High Risk | 35 | 13.6% |
| 1st | Some Risk | 50 | 19.5% |
| 1st | Low Risk | 172 | 66.9% |
| 2nd | High Risk | 56 | 16.3% |
| 2nd | Some Risk | 65 | 18.9% |
| 2nd | Low Risk | 223 | 64.8% |
| 3rd-5th | High Risk | 71 | 20.8% |
| 3rd-5th | Some Risk | 66 | 19.4% |
| 3rd-5th | Low Risk | 204 | 59.8% |
| 6th-8th | High Risk | 33 | 39.8% |
| 6th-8th | Some Risk | 19 | 22.9% |
| 6th-8th | Low Risk | 31 | 37.3% |
| 9th-12th | High Risk | 87 | 49.4% |
| 9th-12th | Some Risk | 53 | 30.1% |
| 9th-12th | Low Risk | 36 | 20.5% |
32.3.2 ROAR measures of foundational reading skills
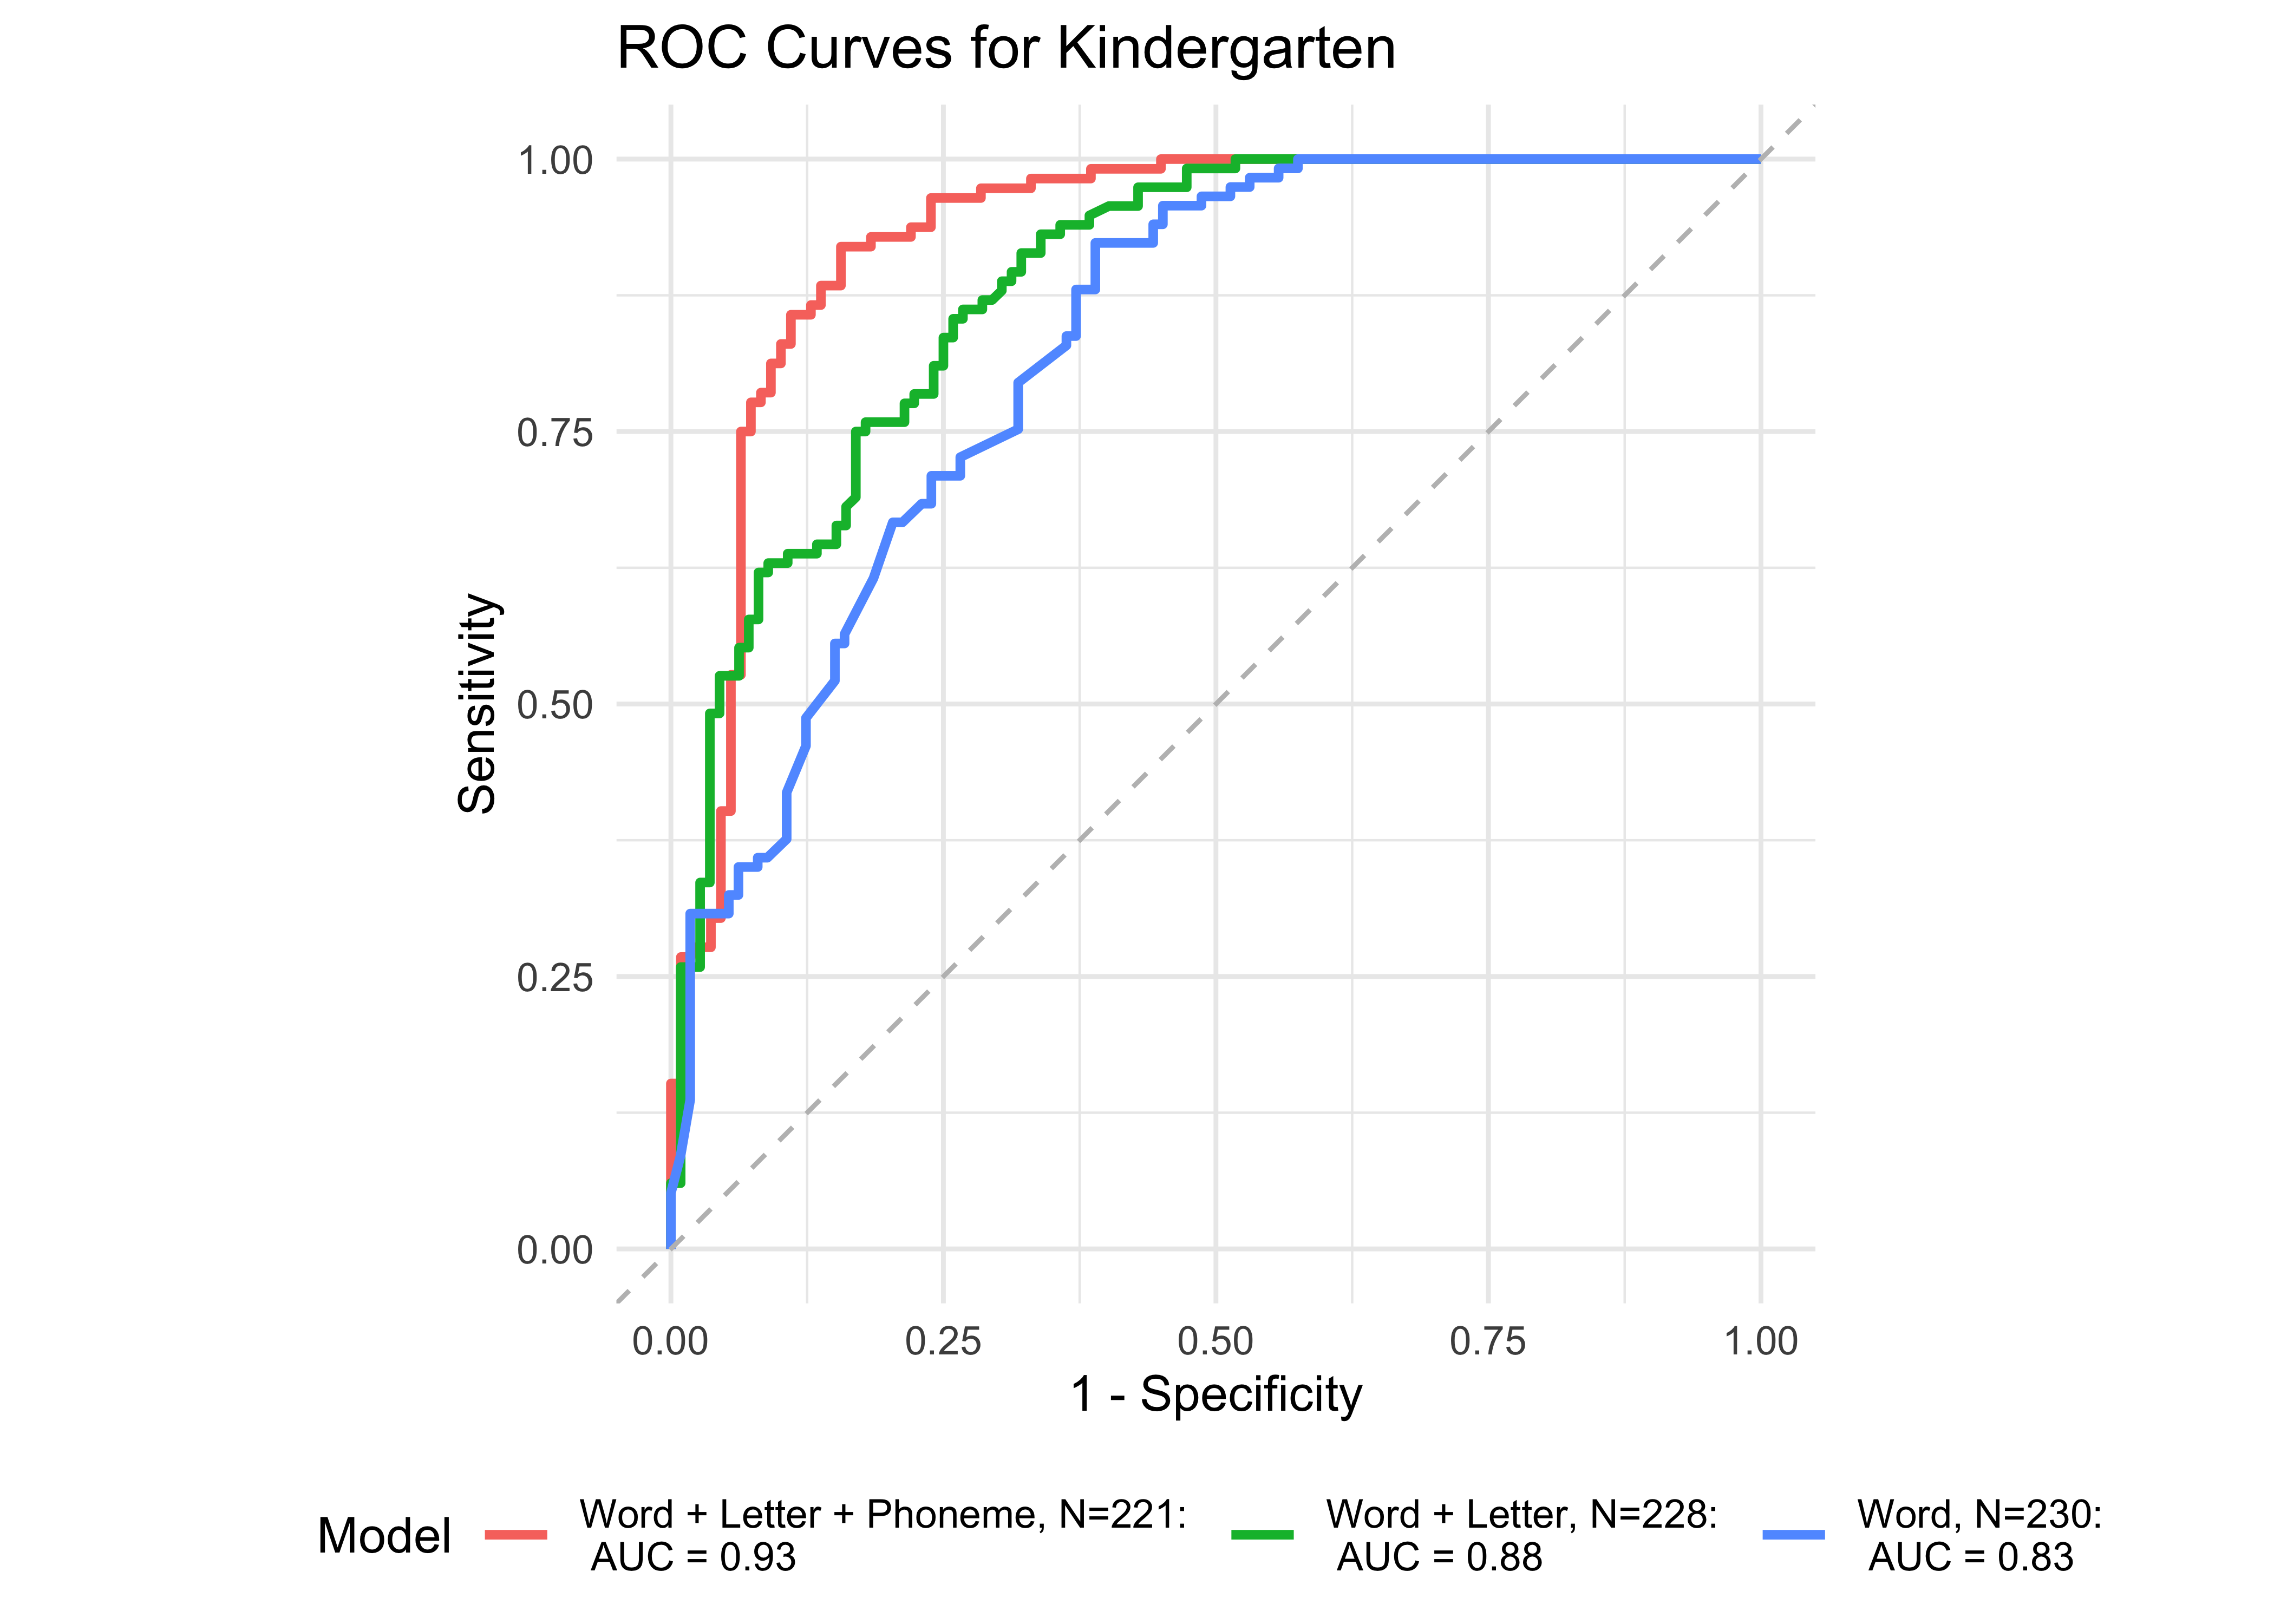
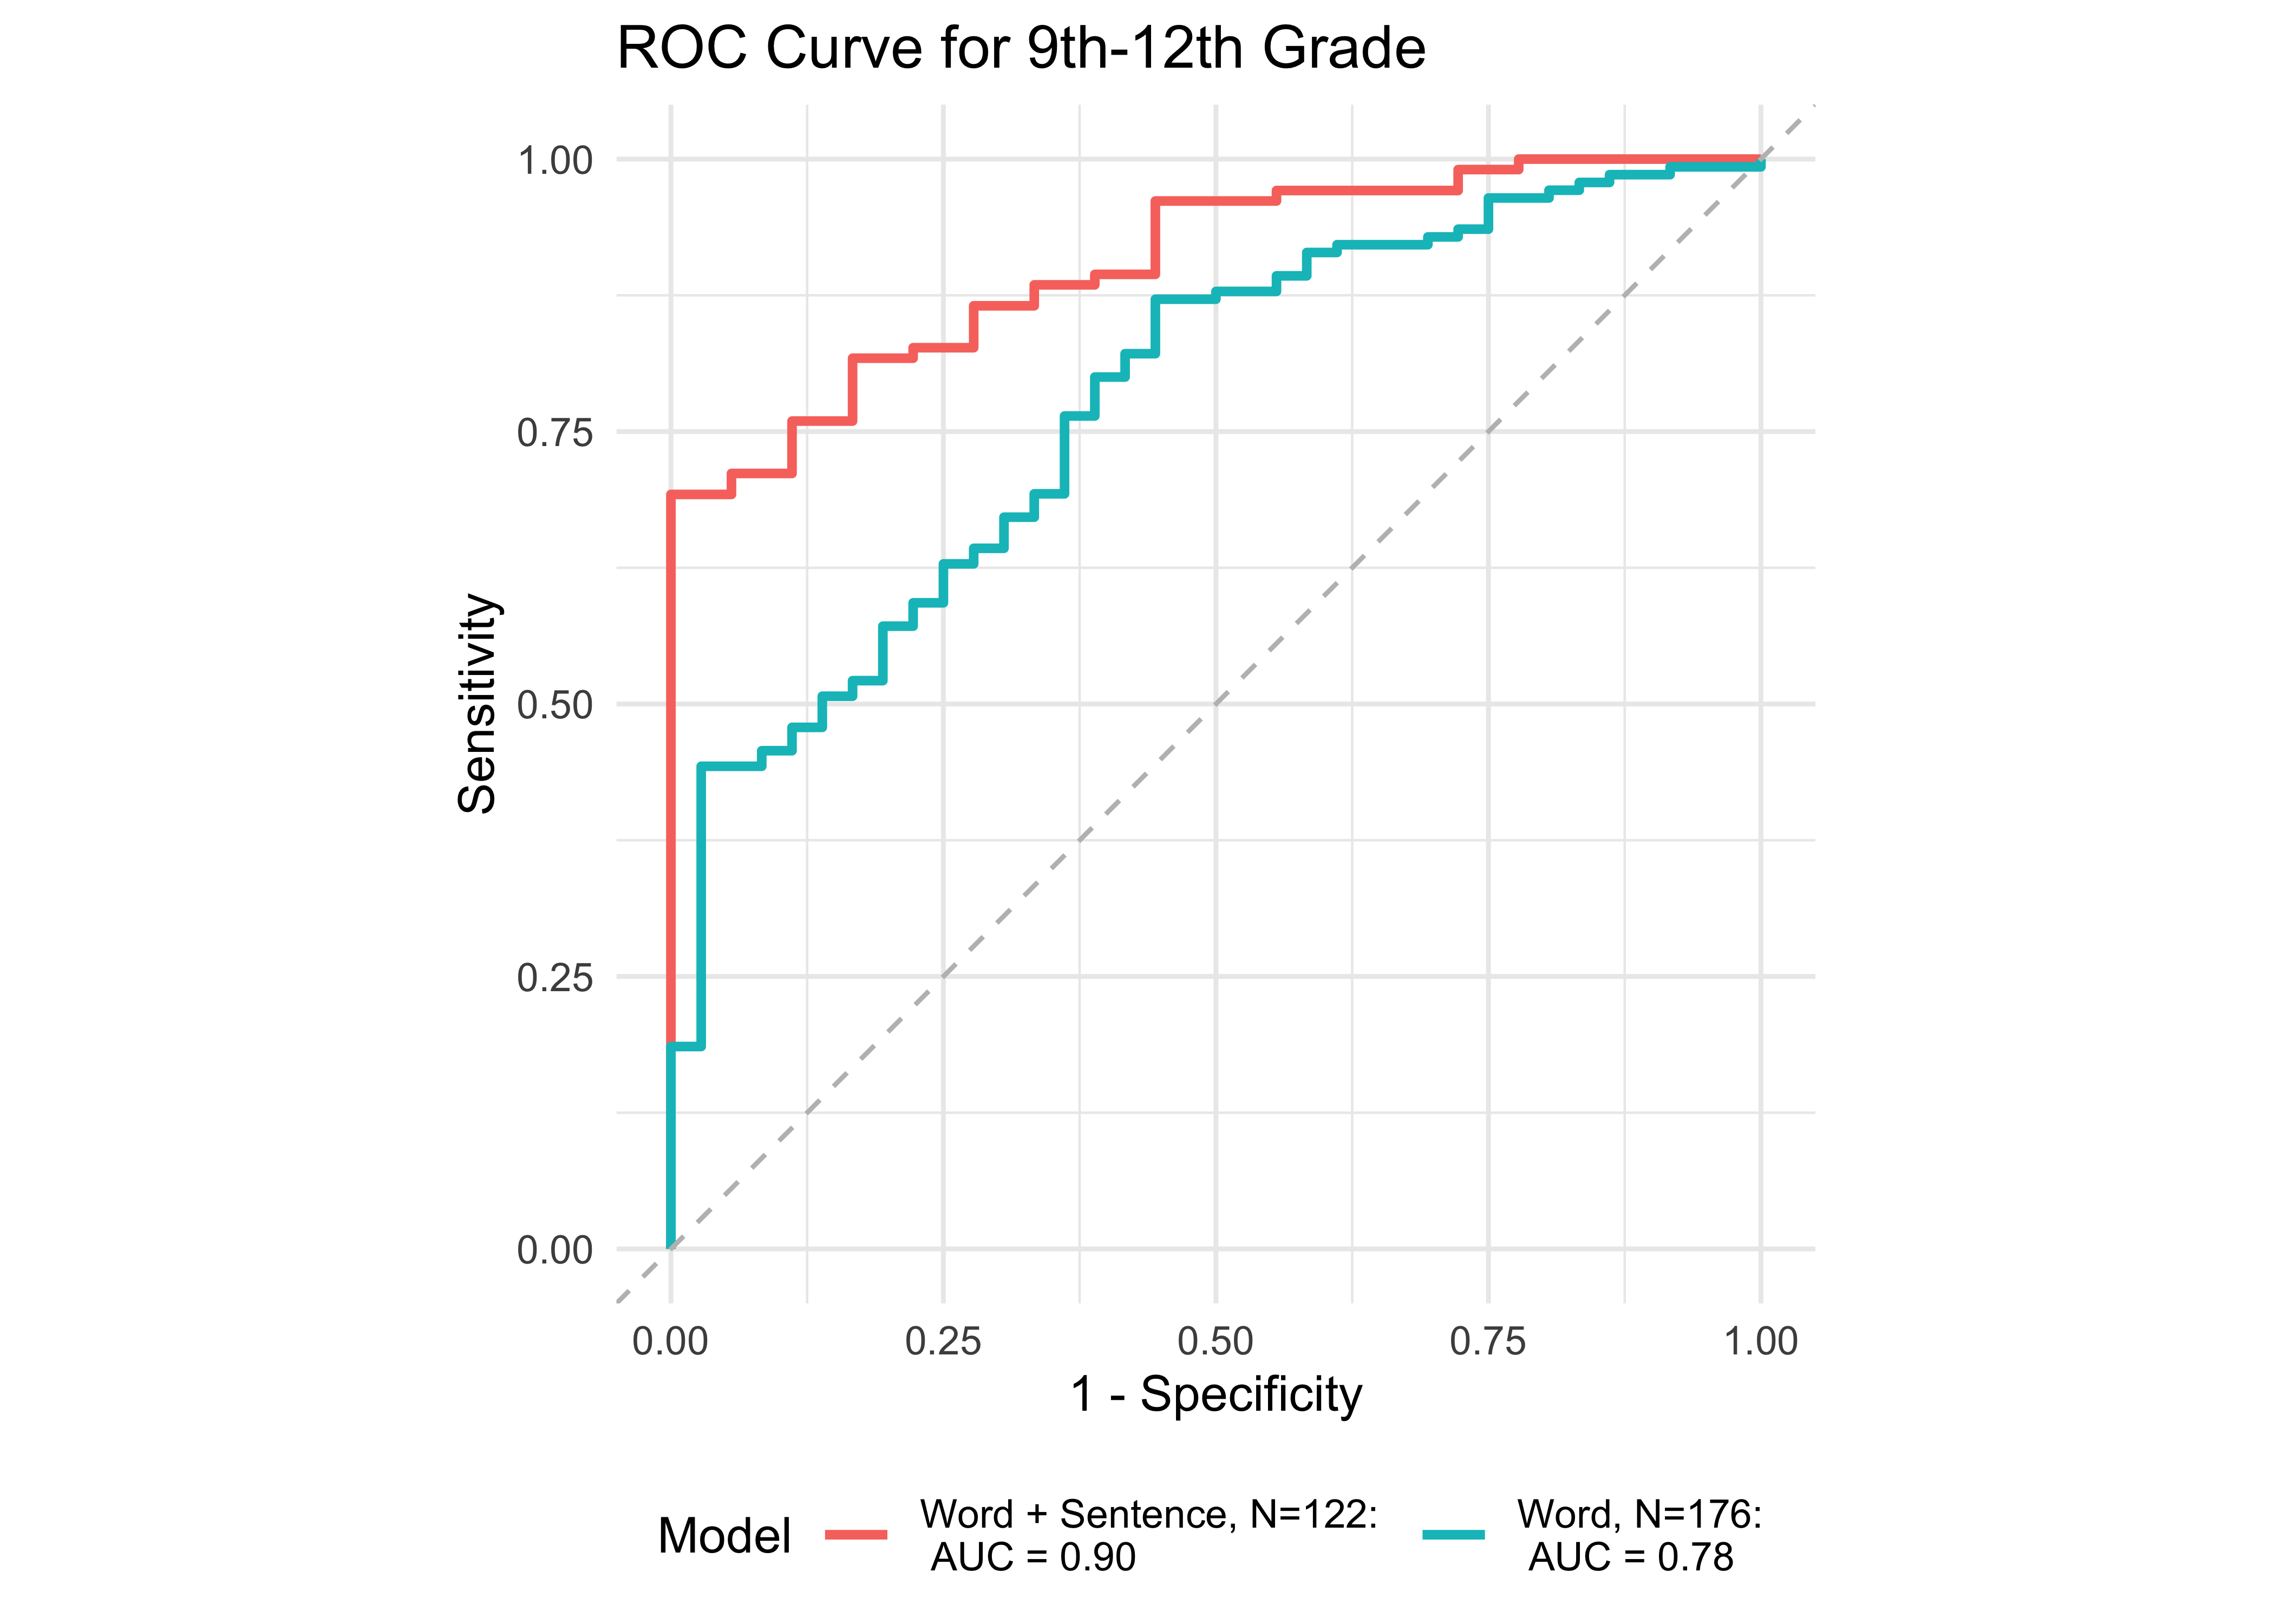
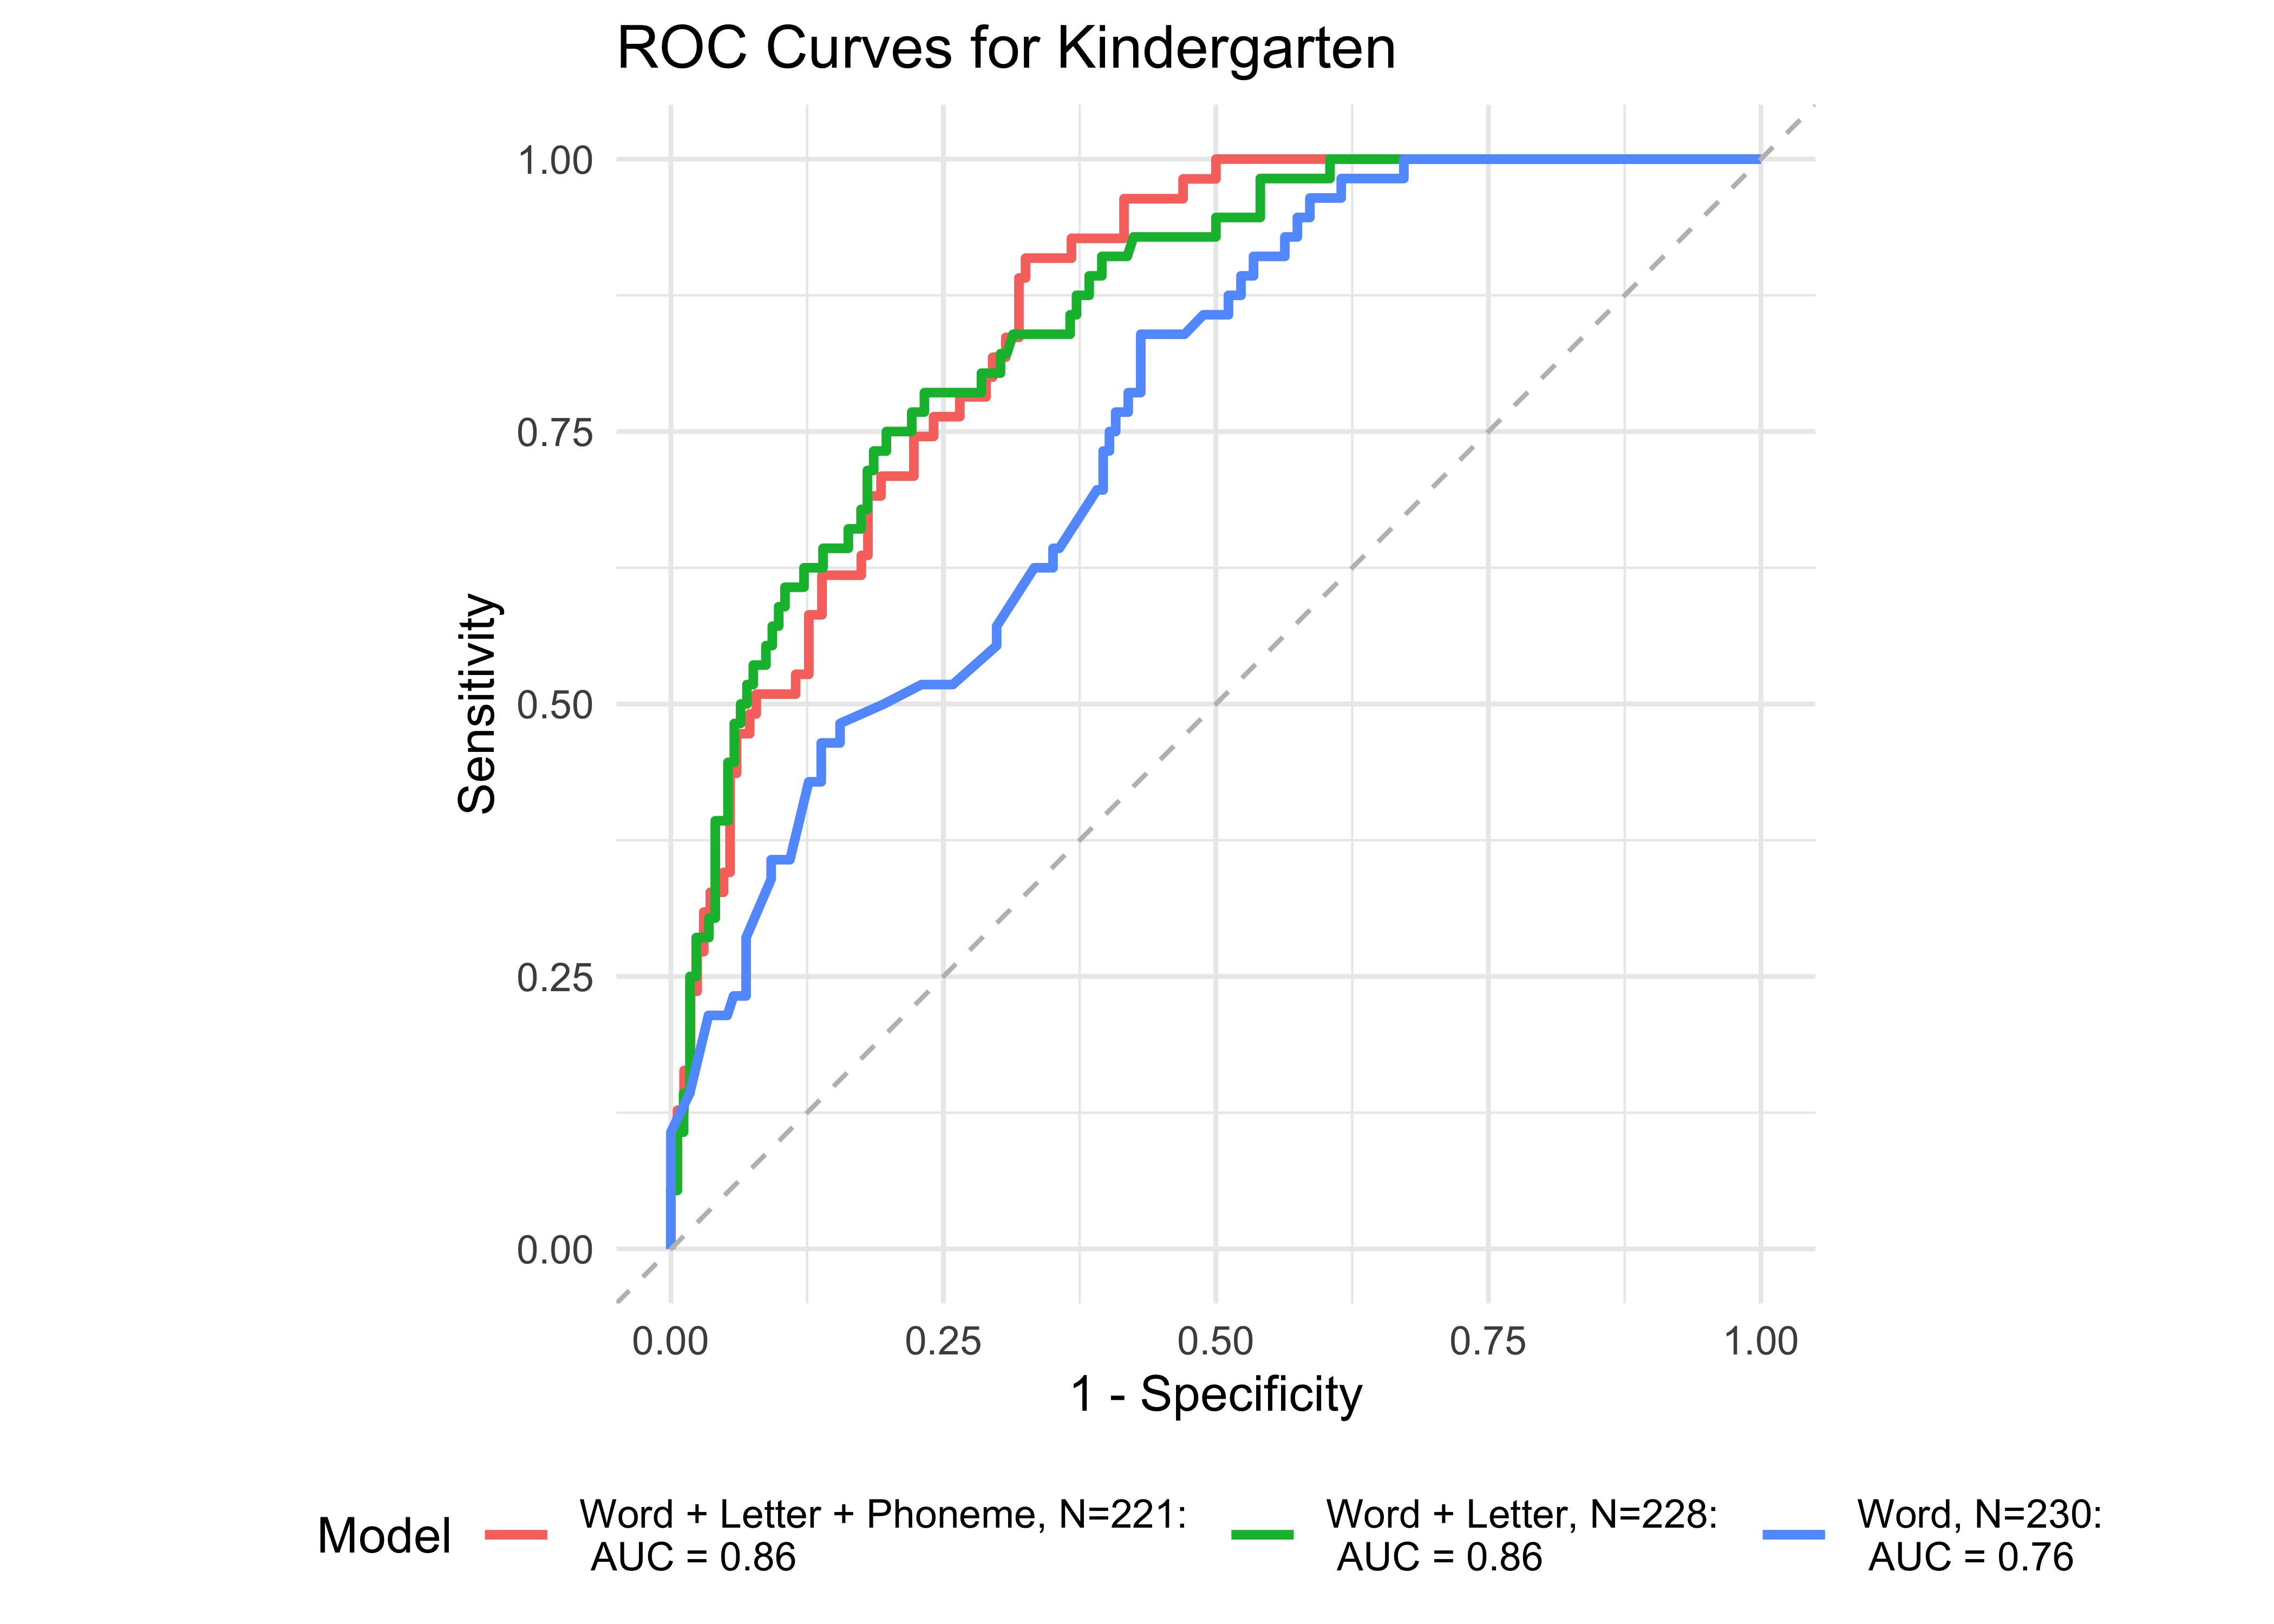
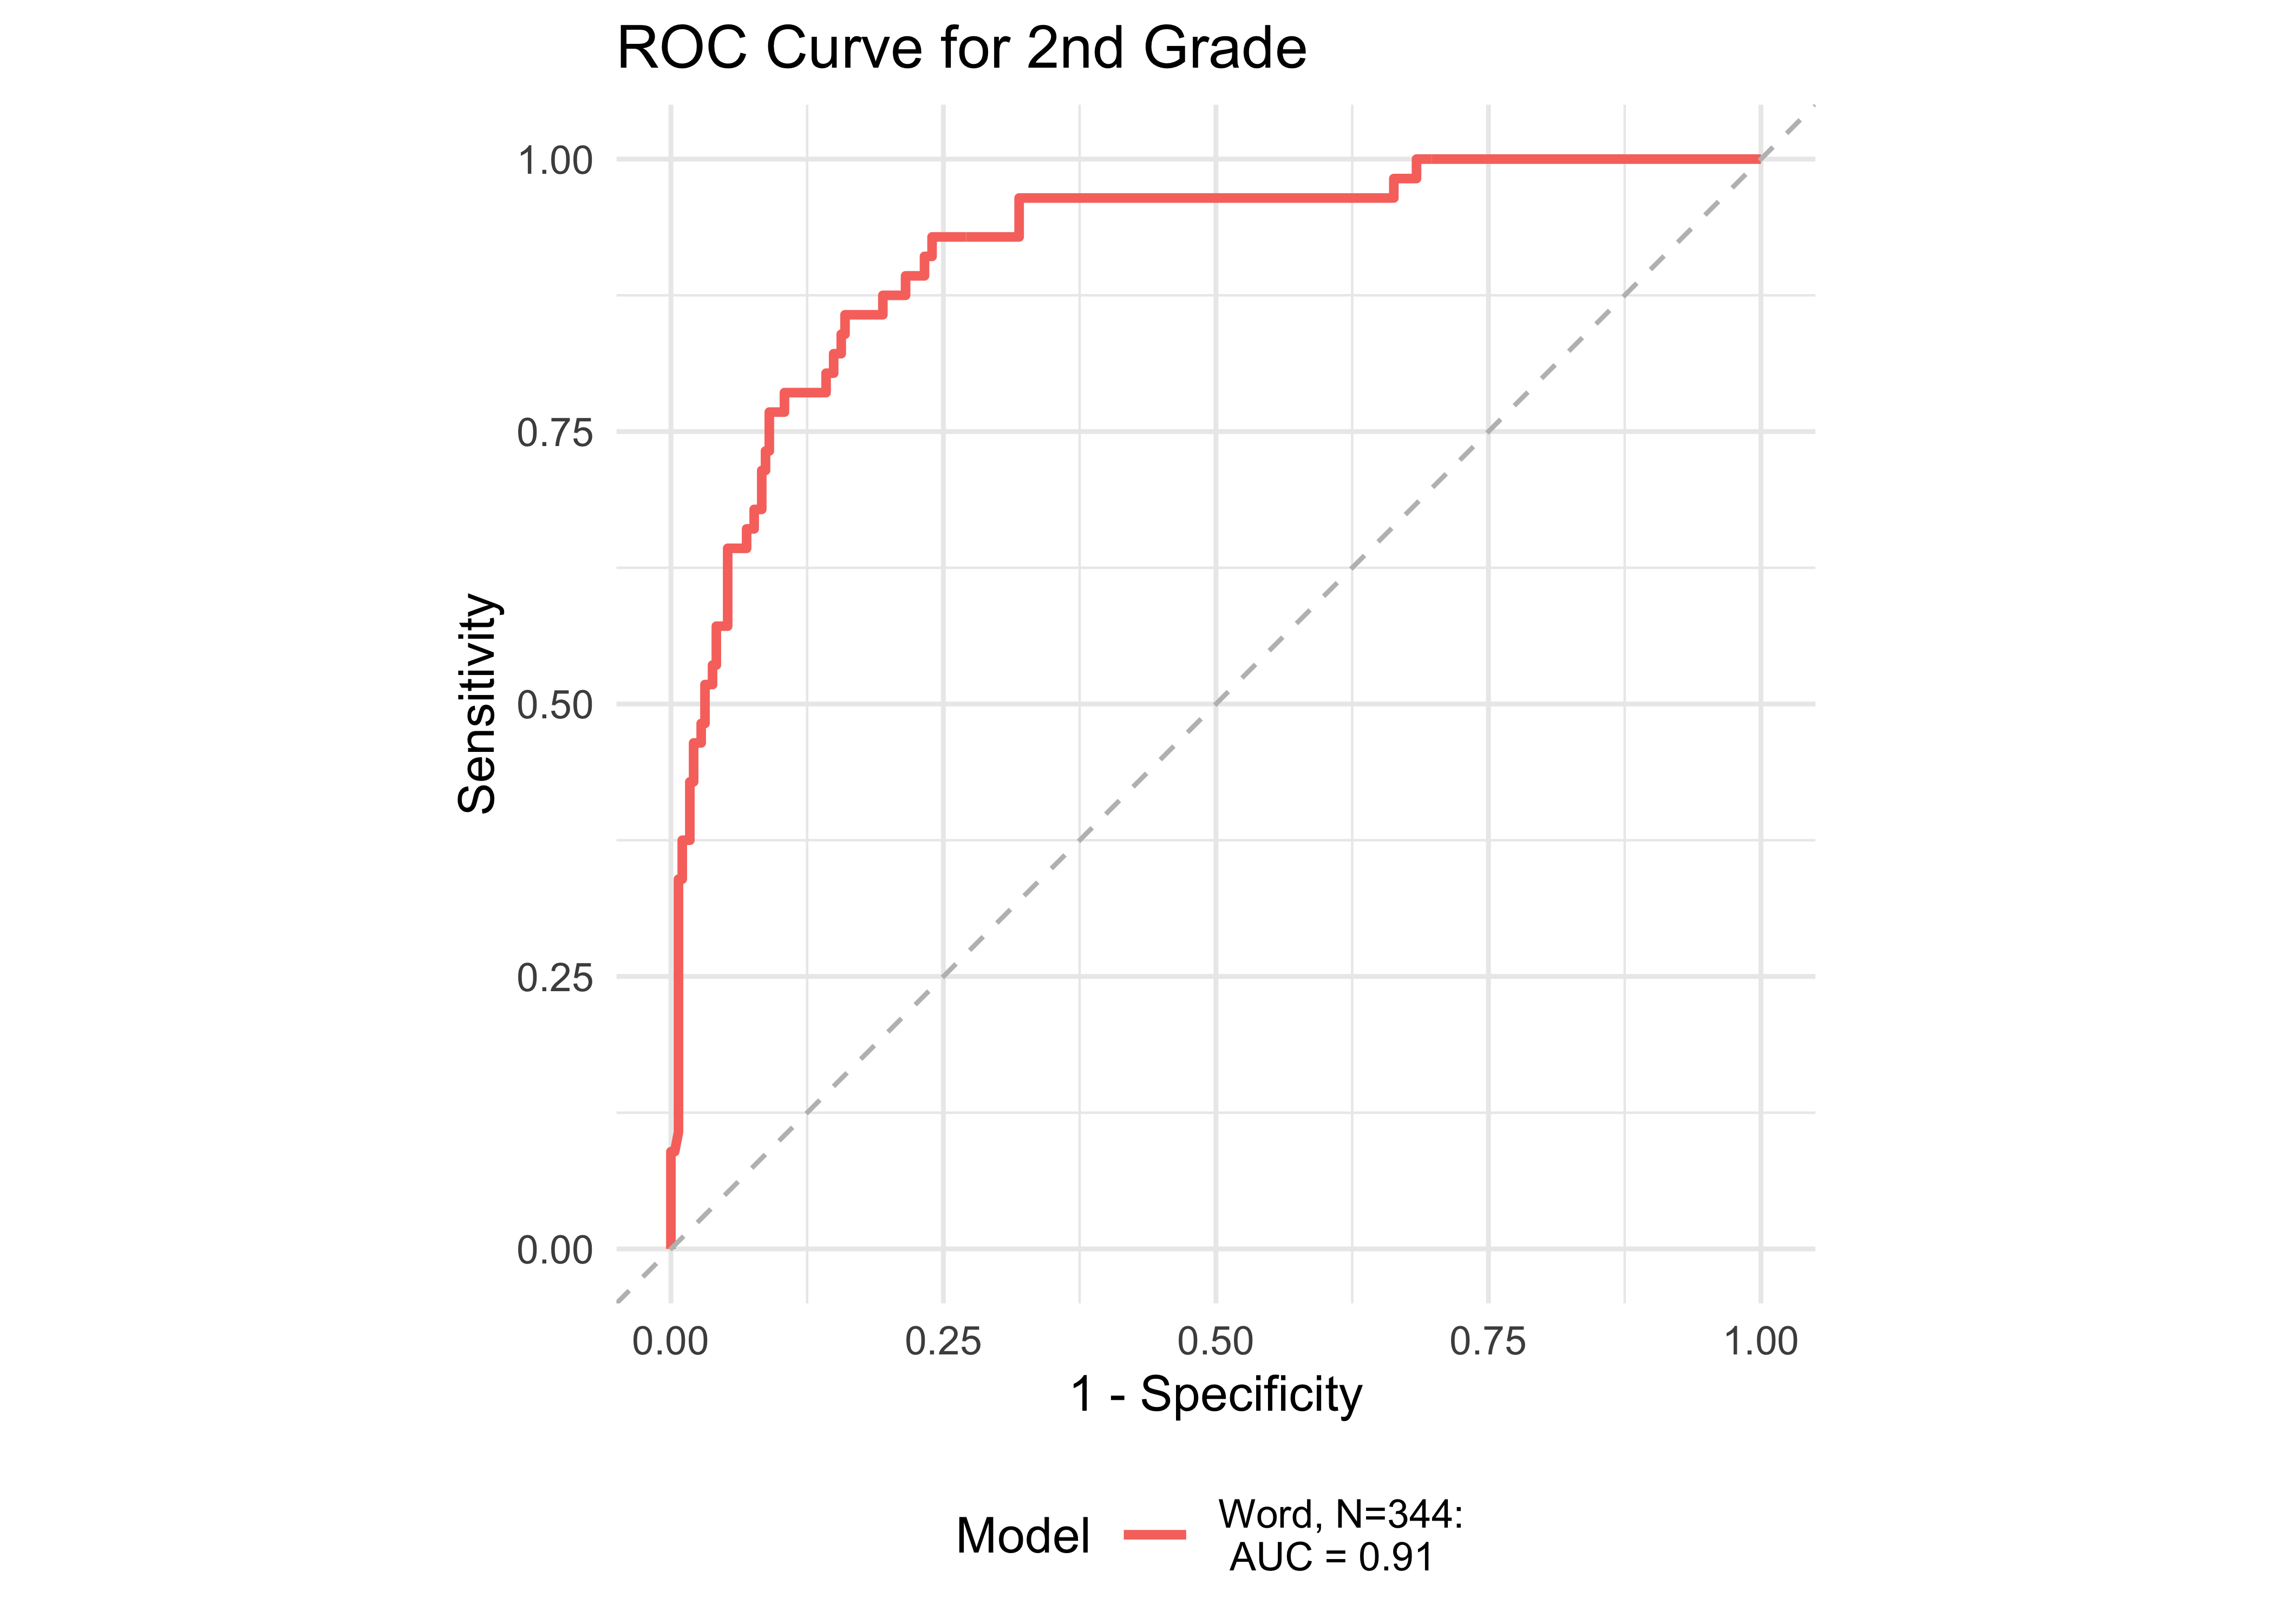
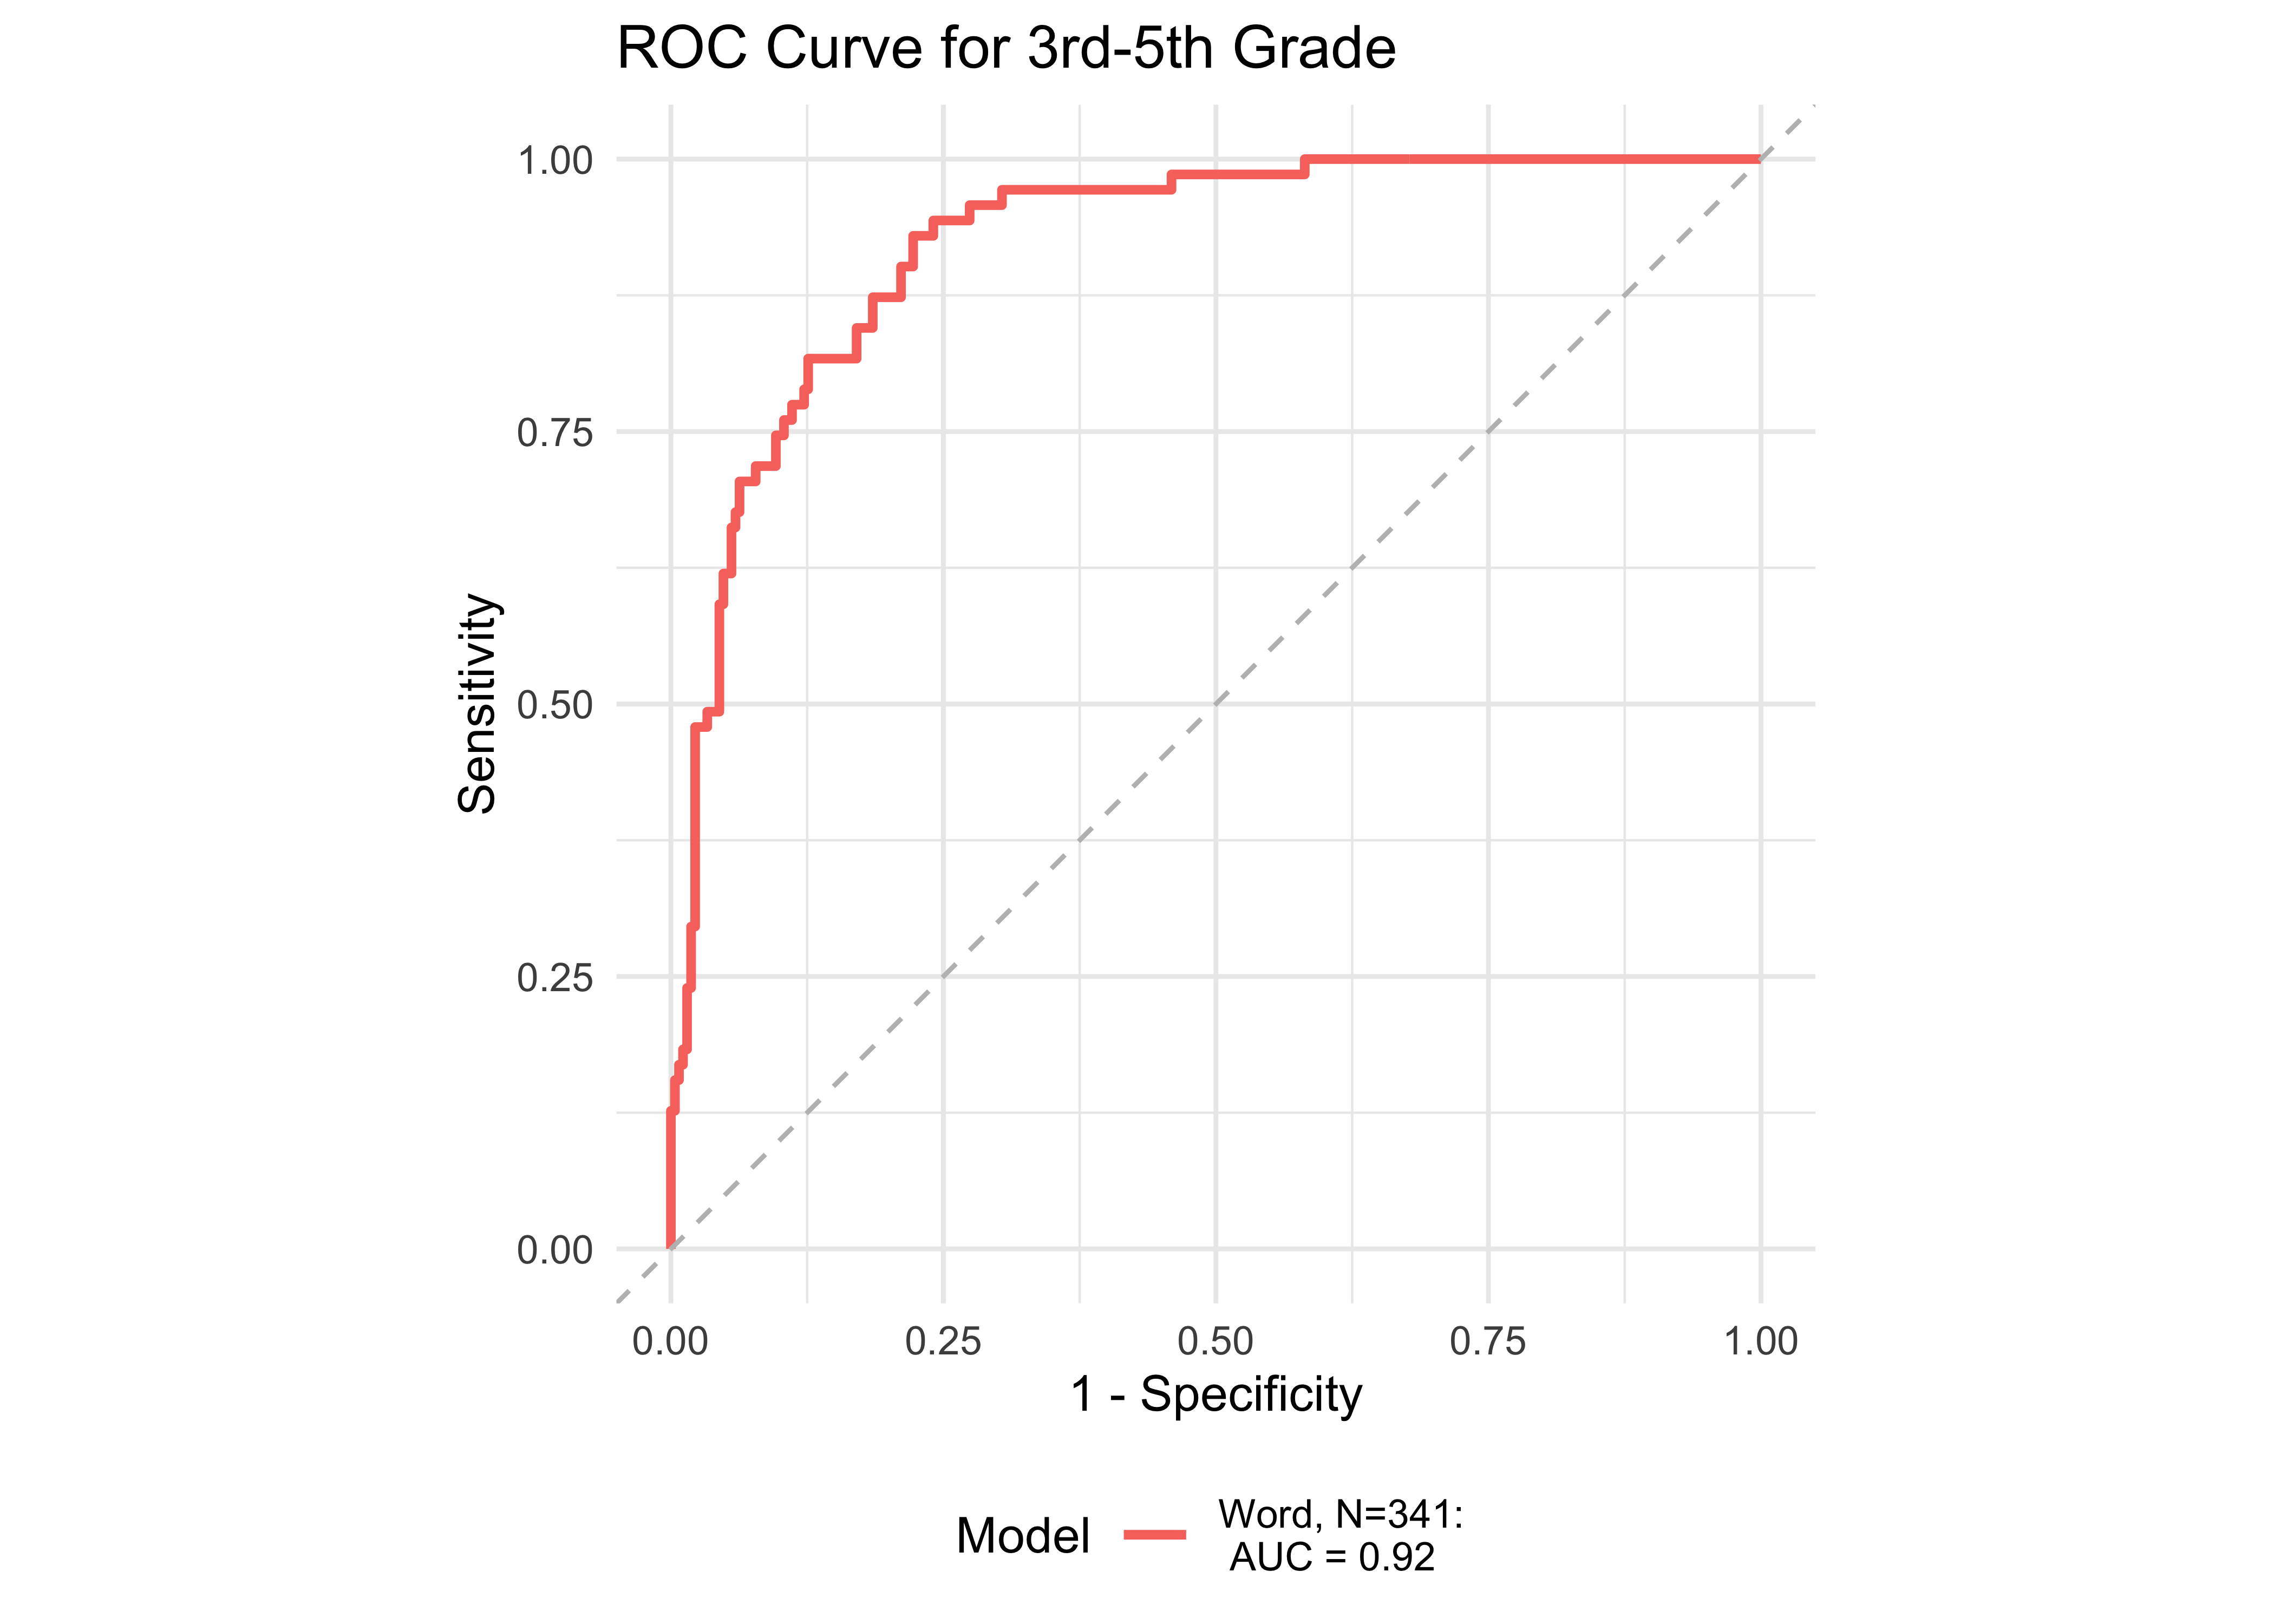
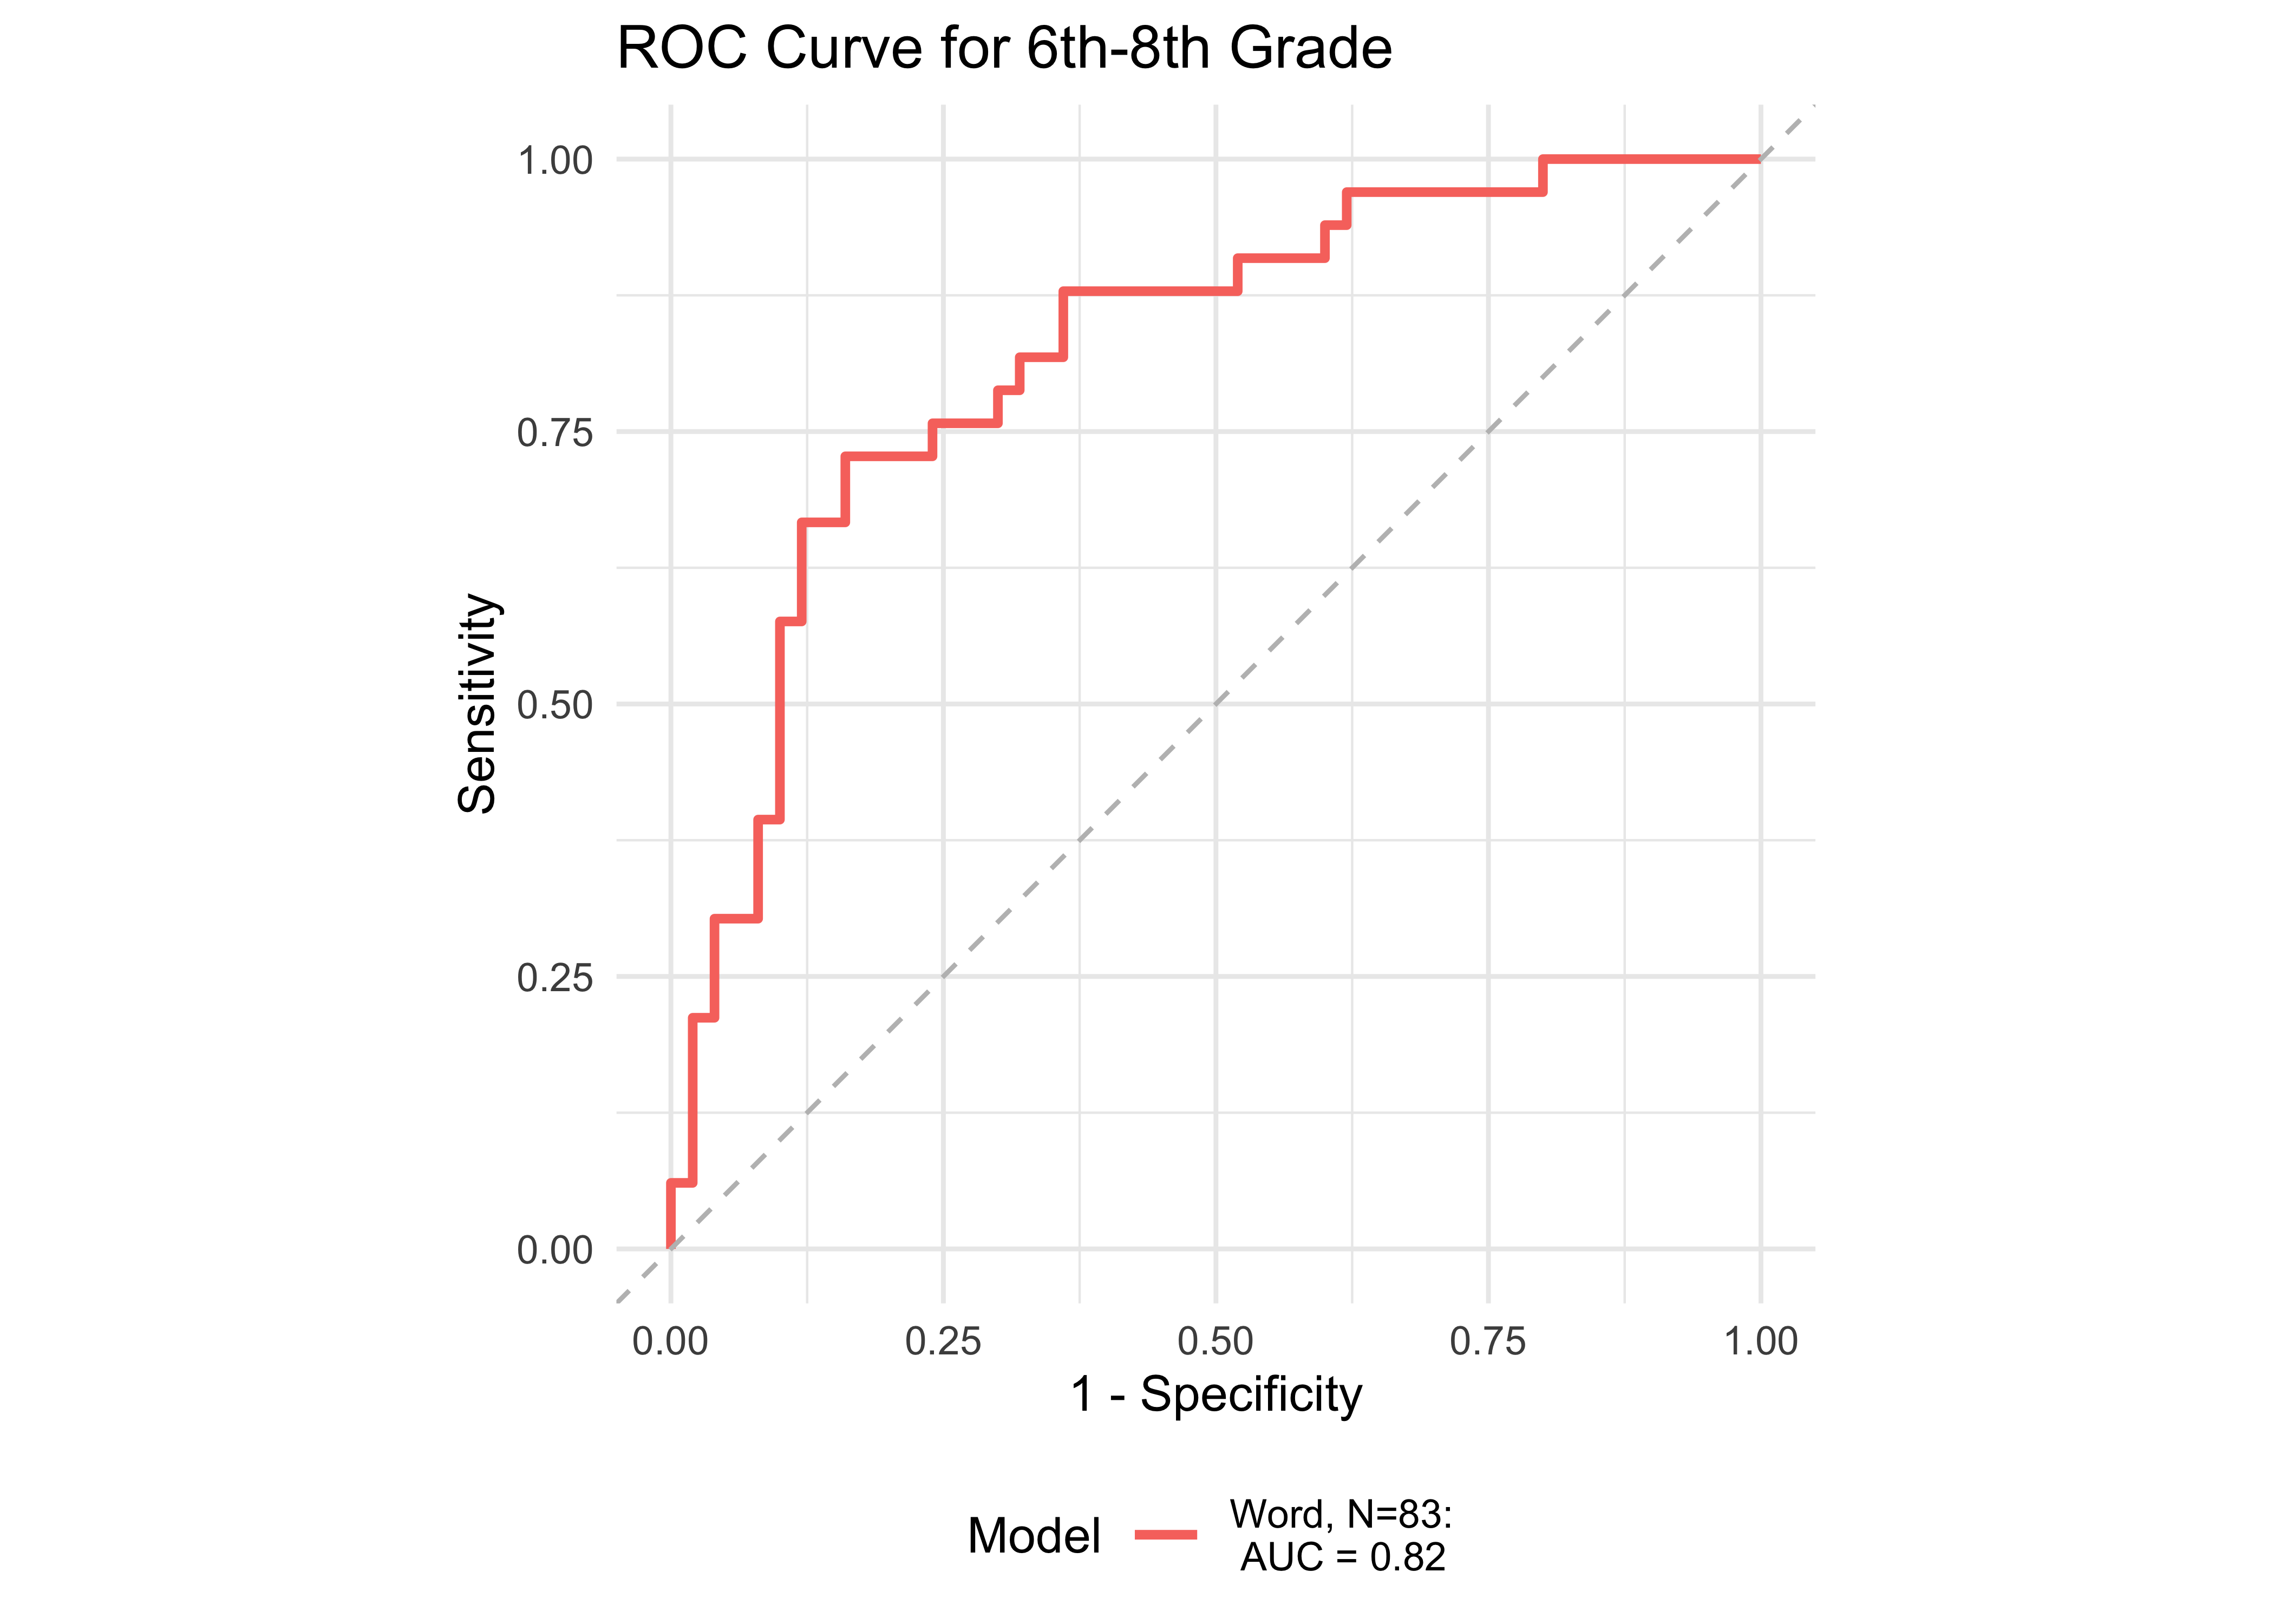
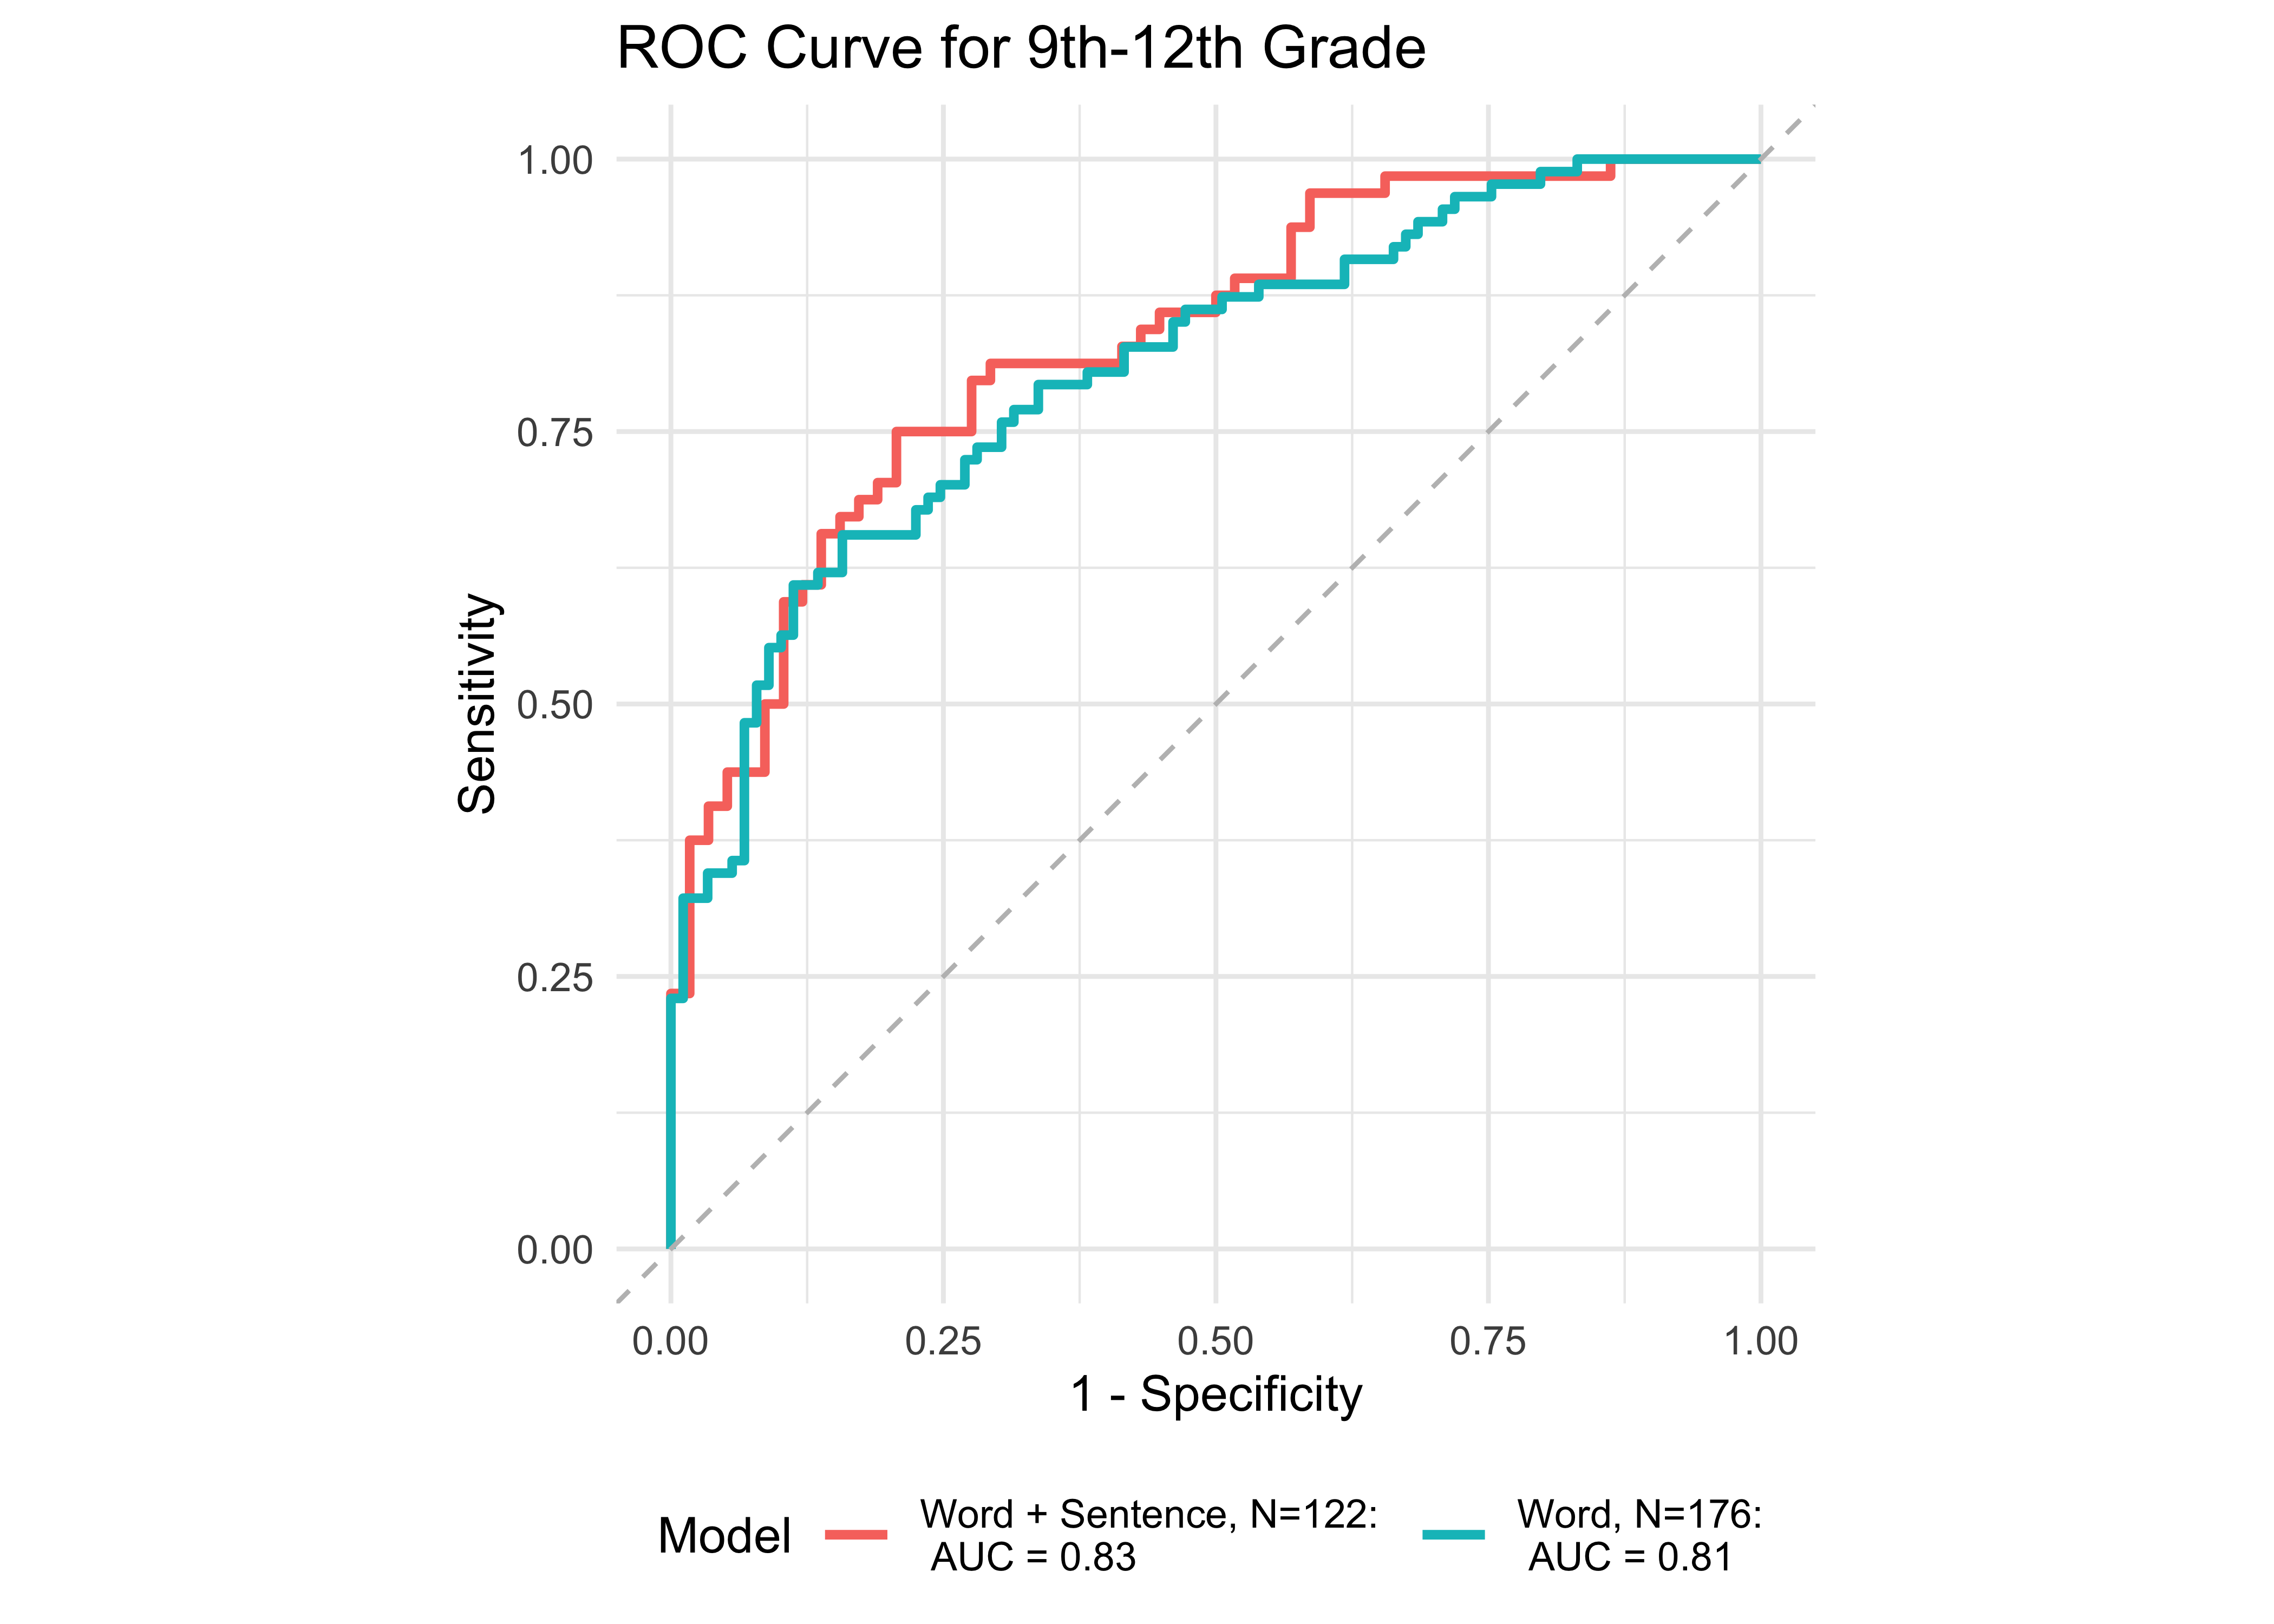
Figure 32.11 shows ROC curves across different grades computed from a generalized additive model (logistic link function) with a combination of ROAR Foundational Reading Skills assessments as predictors of the Woodcock Johnson Basic Reading Skills “Some Risk” category. Figure 32.12 shows an ROC curves for Woodcock Johnson Basic Reading Skills “High Risk” category.
In kindergarten, ROAR-Word as a single predictor achieved acceptable classification accuracy (AUC = 0.83) and the addition of ROAR-Letter and ROAR-Phoneme achieved exceptional accuracy (AUC = 0.93). In grades 1-5, ROAR-Word achieved excellent classification accuracy on its own (AUG > 0.9). For older grades accuracy was lower, and this reflects the psychometric properties of the criterion measure in older students. Many middle school and high school students are at the ceiling of the Woodcock Johnson Basic Reading Skills index (for example see Table 27.3 which shows the decline in reliability of WJ in older grades). Despite the lower reliability of the criterion measure, accuracy was still good in middle school for ROAR-Word on its own (AUC = 0.81) and in high school ROAR-Word and ROAR-Sentence together achieved excellent classification accuracy (AUC = 0.90).


| Age Range | AUC | Best Specificity | Best Sensitivity | Specificity (Sensitivity at 0.9) | Sensitivity at 0.9 | N |
|---|---|---|---|---|---|---|
| Kindergarten | 0.93 | 0.84 | 0.92 | 0.84 | 0.90 | 221 |
| 1st | 0.93 | 0.84 | 0.93 | 0.85 | 0.91 | 257 |
| 2nd | 0.92 | 0.78 | 0.94 | 0.81 | 0.90 | 344 |
| 3rd-5th | 0.91 | 0.84 | 0.82 | 0.75 | 0.91 | 341 |
| 6th-8th | 0.81 | 0.77 | 0.79 | 0.42 | 0.90 | 83 |
| 9th-12th | 0.90 | 1.00 | 0.69 | 0.56 | 0.90 | 122 |

| Age Range | AUC | Best Specificity | Best Sensitivity | Specificity (Sensitivity at 0.9) | Sensitivity at 0.9 | N |
|---|---|---|---|---|---|---|
| Kindergarten | 0.86 | 0.67 | 0.91 | 0.63 | 0.91 | 221 |
| 1st | 0.93 | 0.89 | 0.89 | 0.77 | 0.91 | 257 |
| 2nd | 0.91 | 0.84 | 0.86 | 0.76 | 0.91 | 344 |
| 3rd-5th | 0.92 | 0.78 | 0.93 | 0.78 | 0.90 | 341 |
| 6th-8th | 0.82 | 0.84 | 0.73 | 0.40 | 0.91 | 83 |
| 9th-12th | 0.83 | 0.79 | 0.75 | 0.43 | 0.91 | 122 |
32.3.3 ROAR Composite
As mentioned previously, the overall ROAR Composite Score is an IRT-based composite using the Letter, Word, and Phoneme measures. We now examine model accuracy based on a logistic regression model split across various time periods and administrations. Determining how models perform throughout the school year is an important step in understanding the ability of the ROAR Composite Score to predict students’ reading abilities and Woodcock Johnson Basic Reading Skills scores at the beginning, middle, and end of the school year.
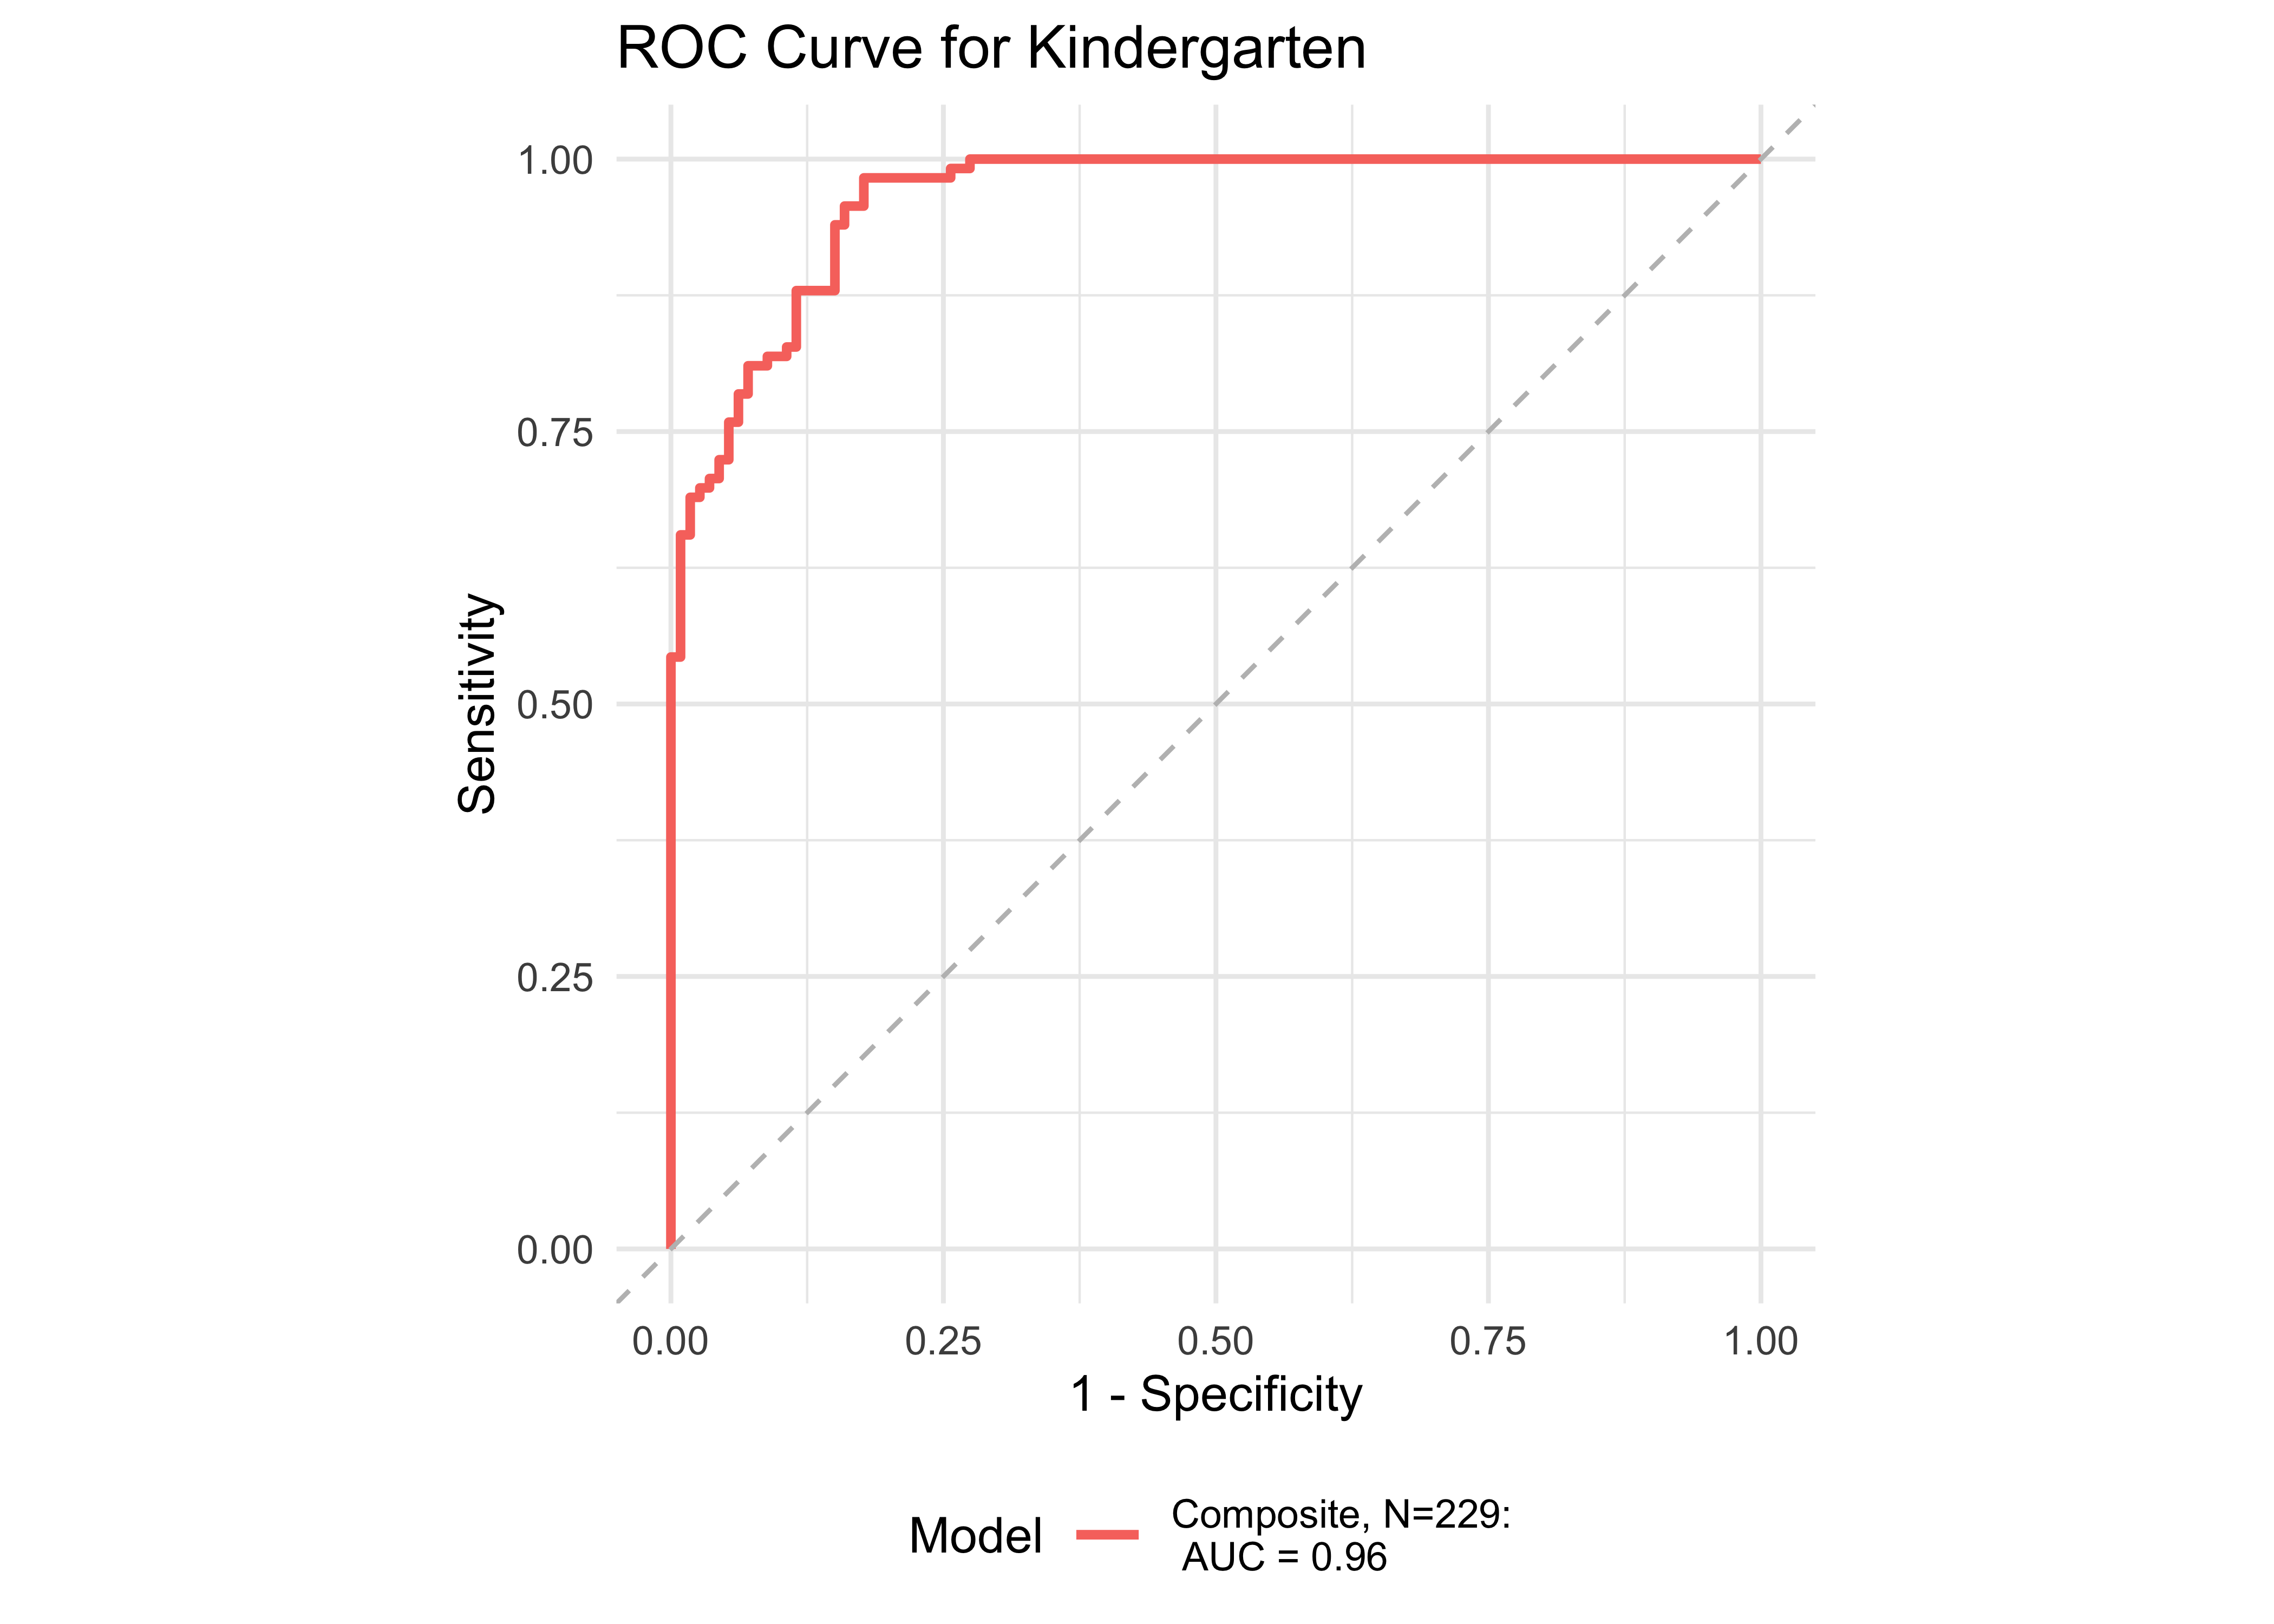
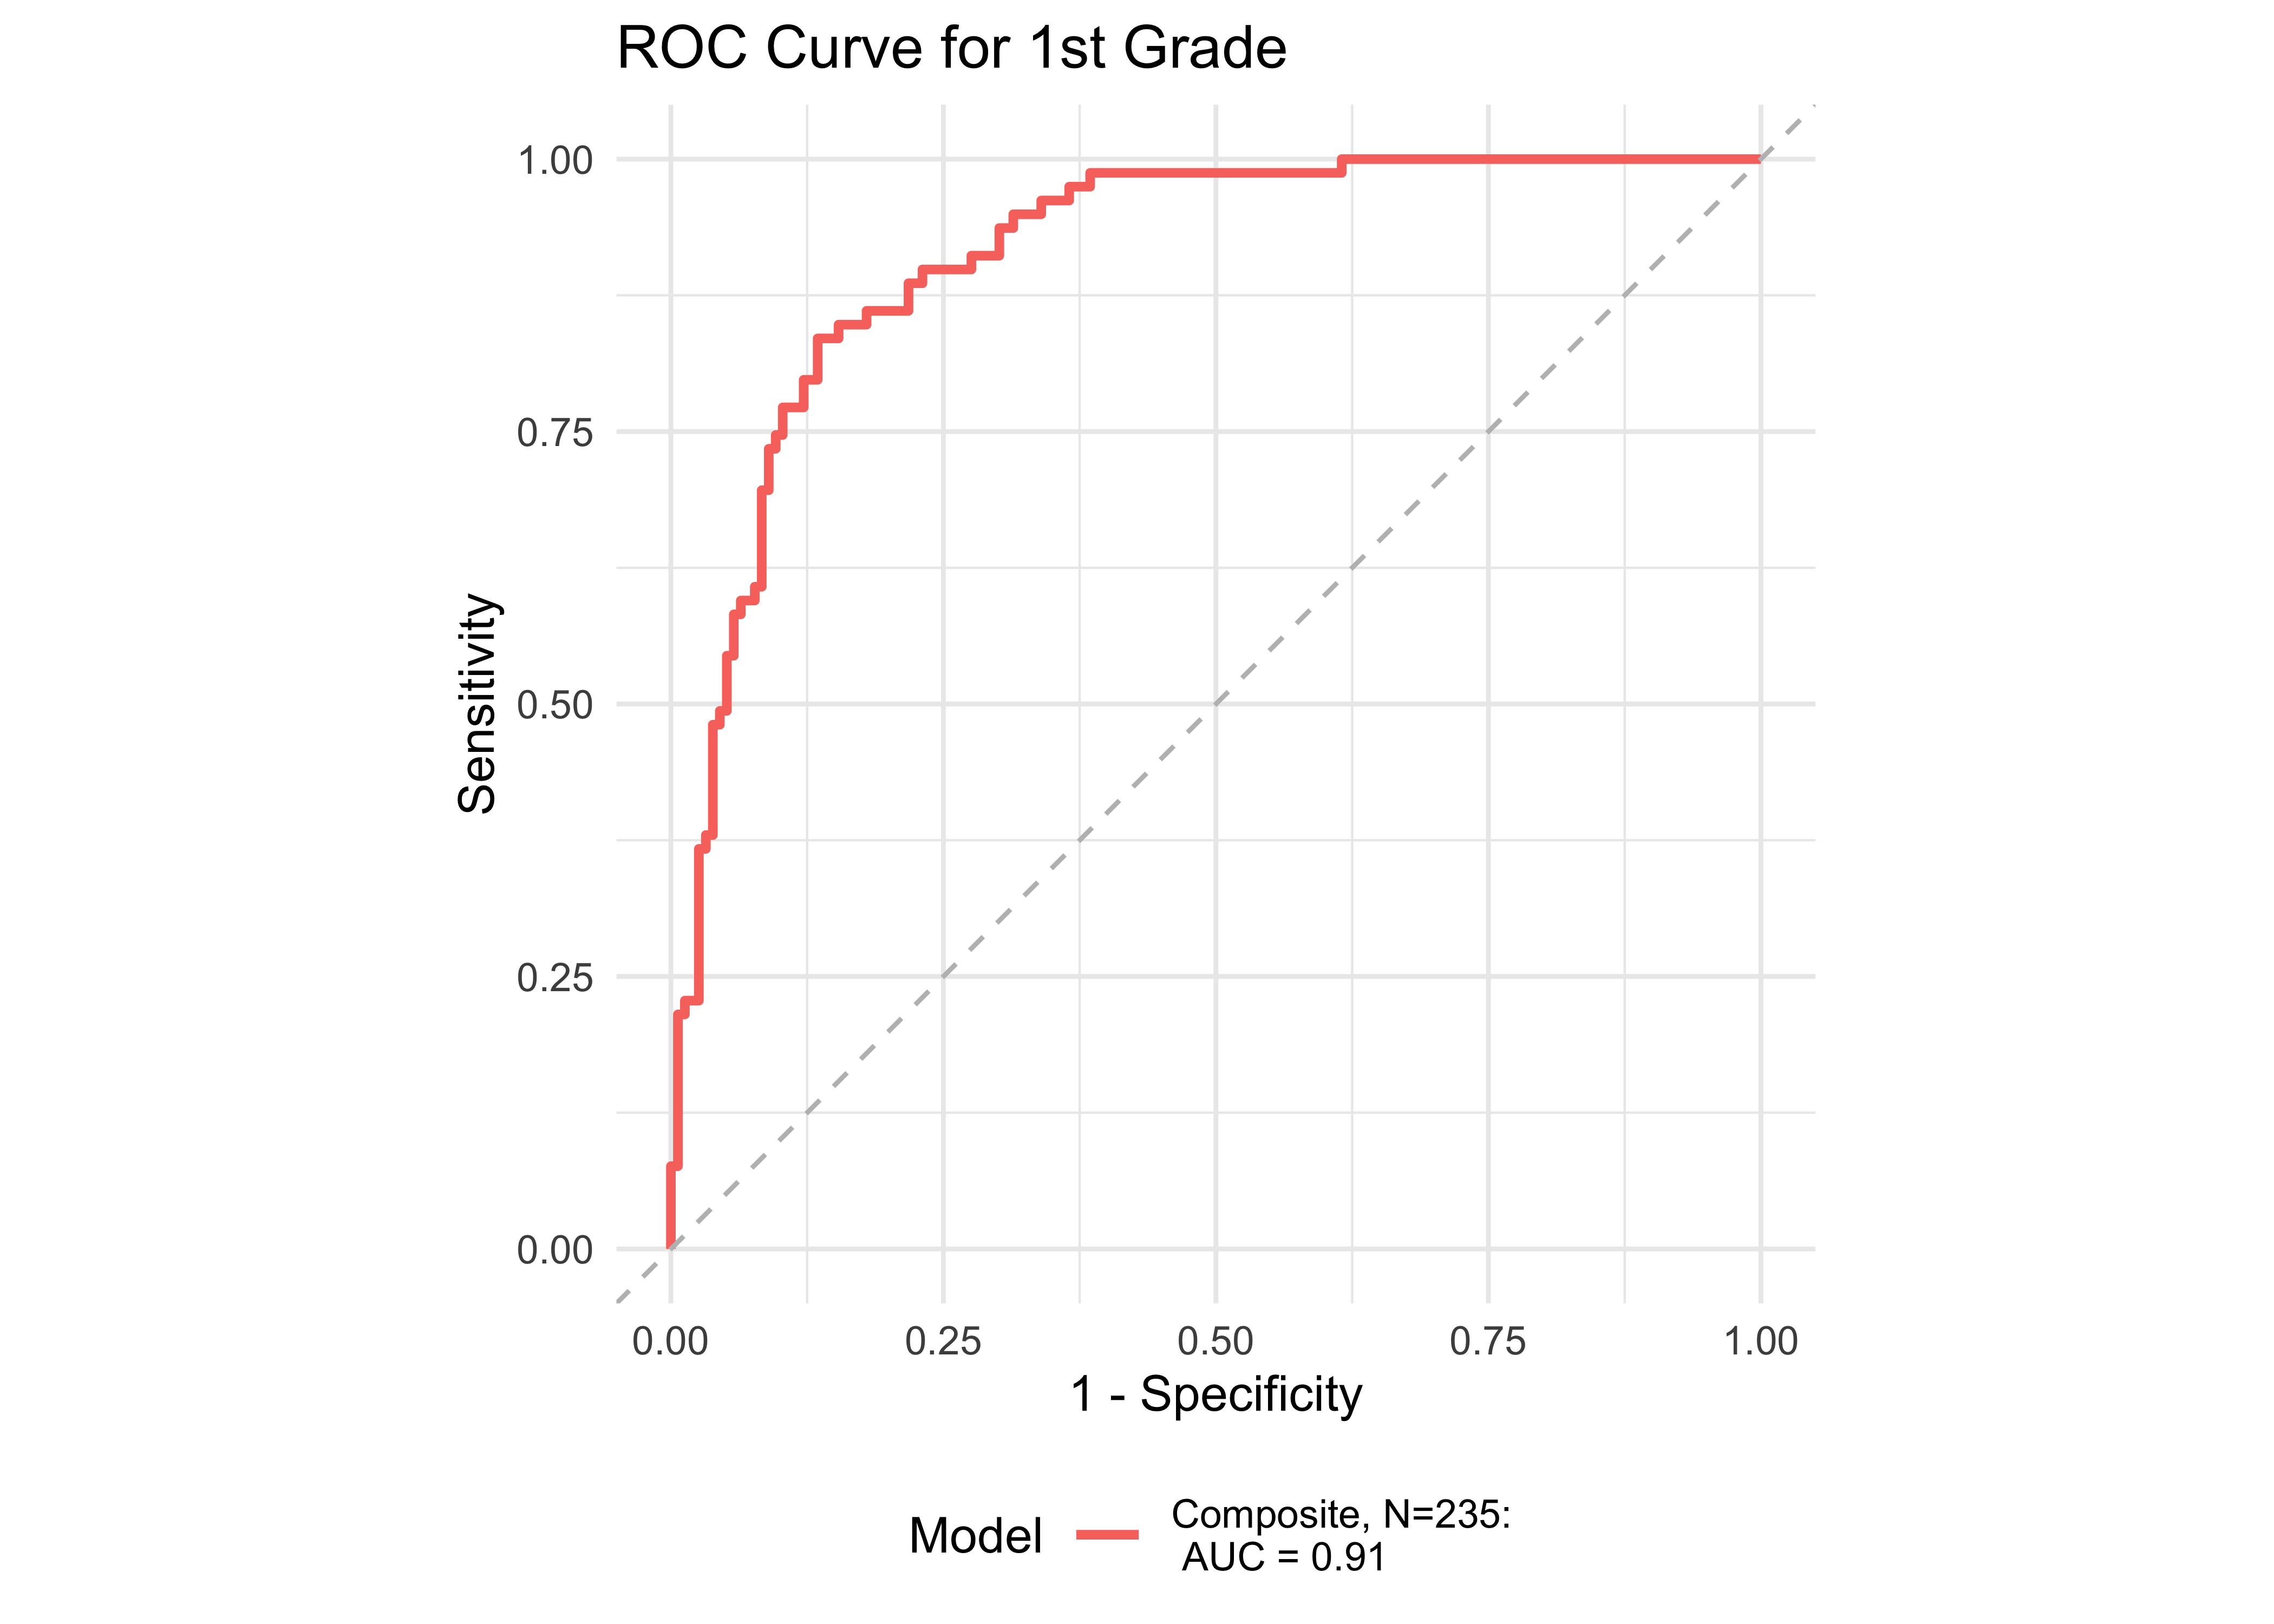
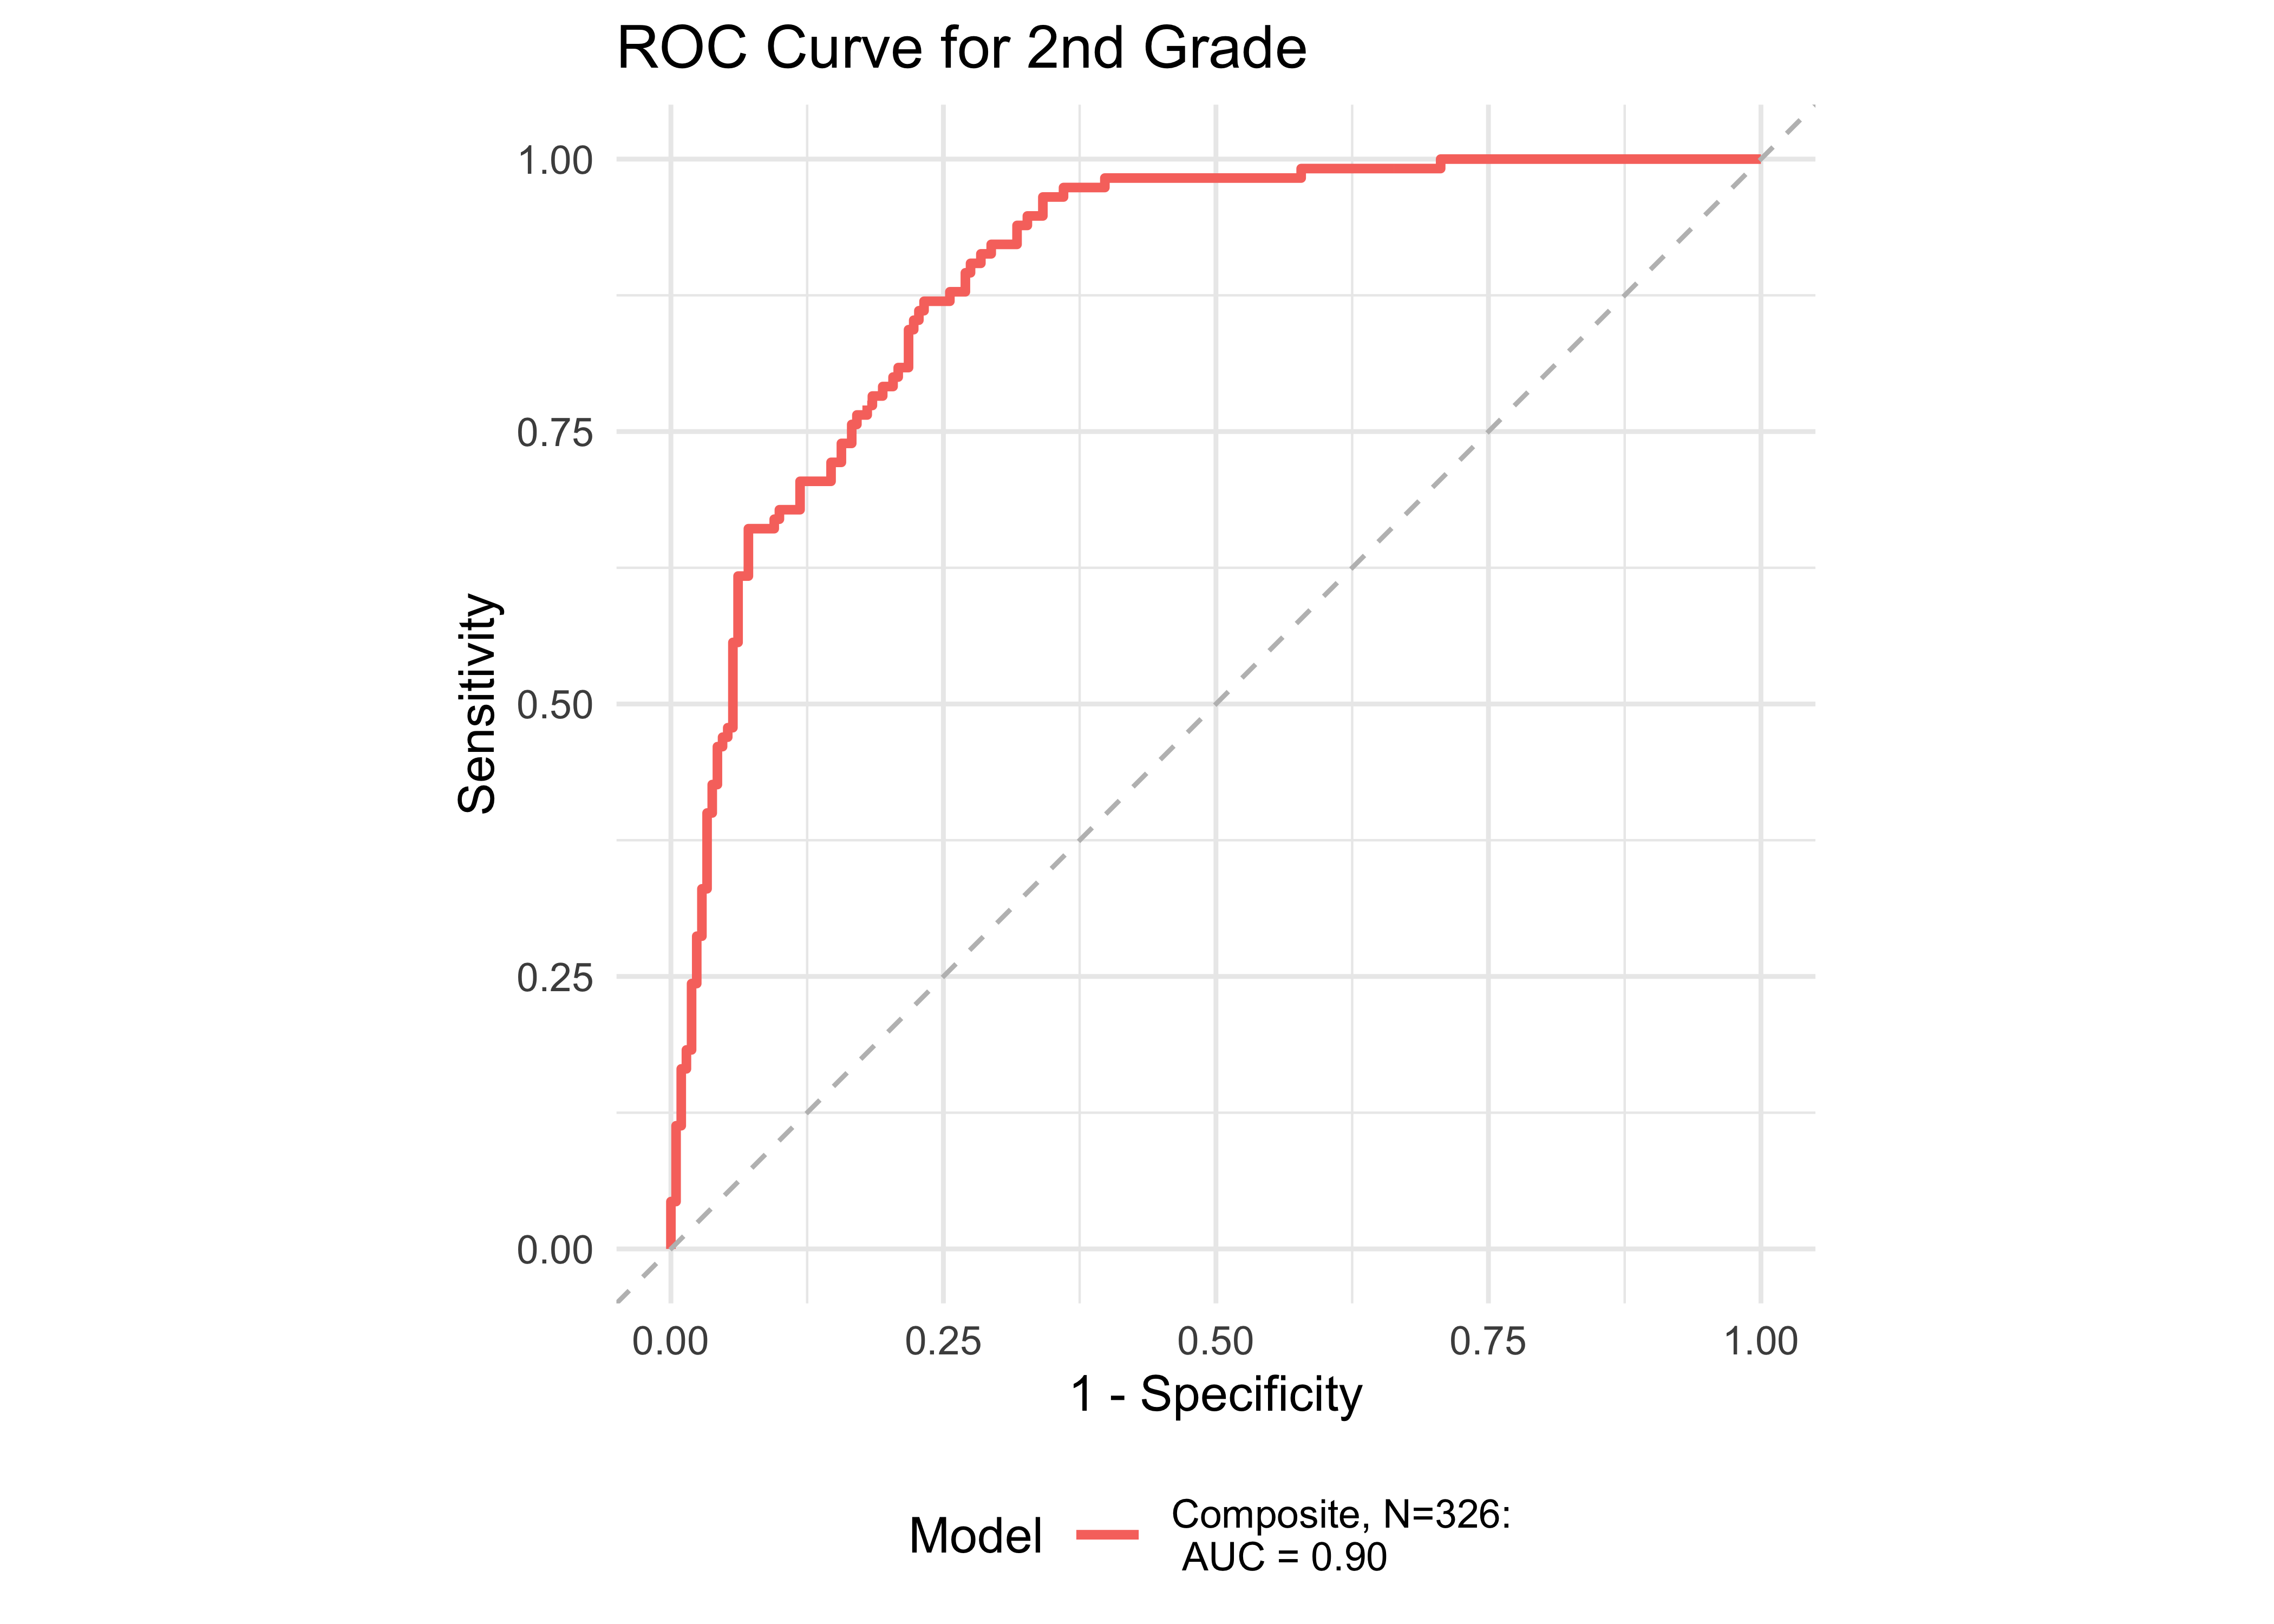
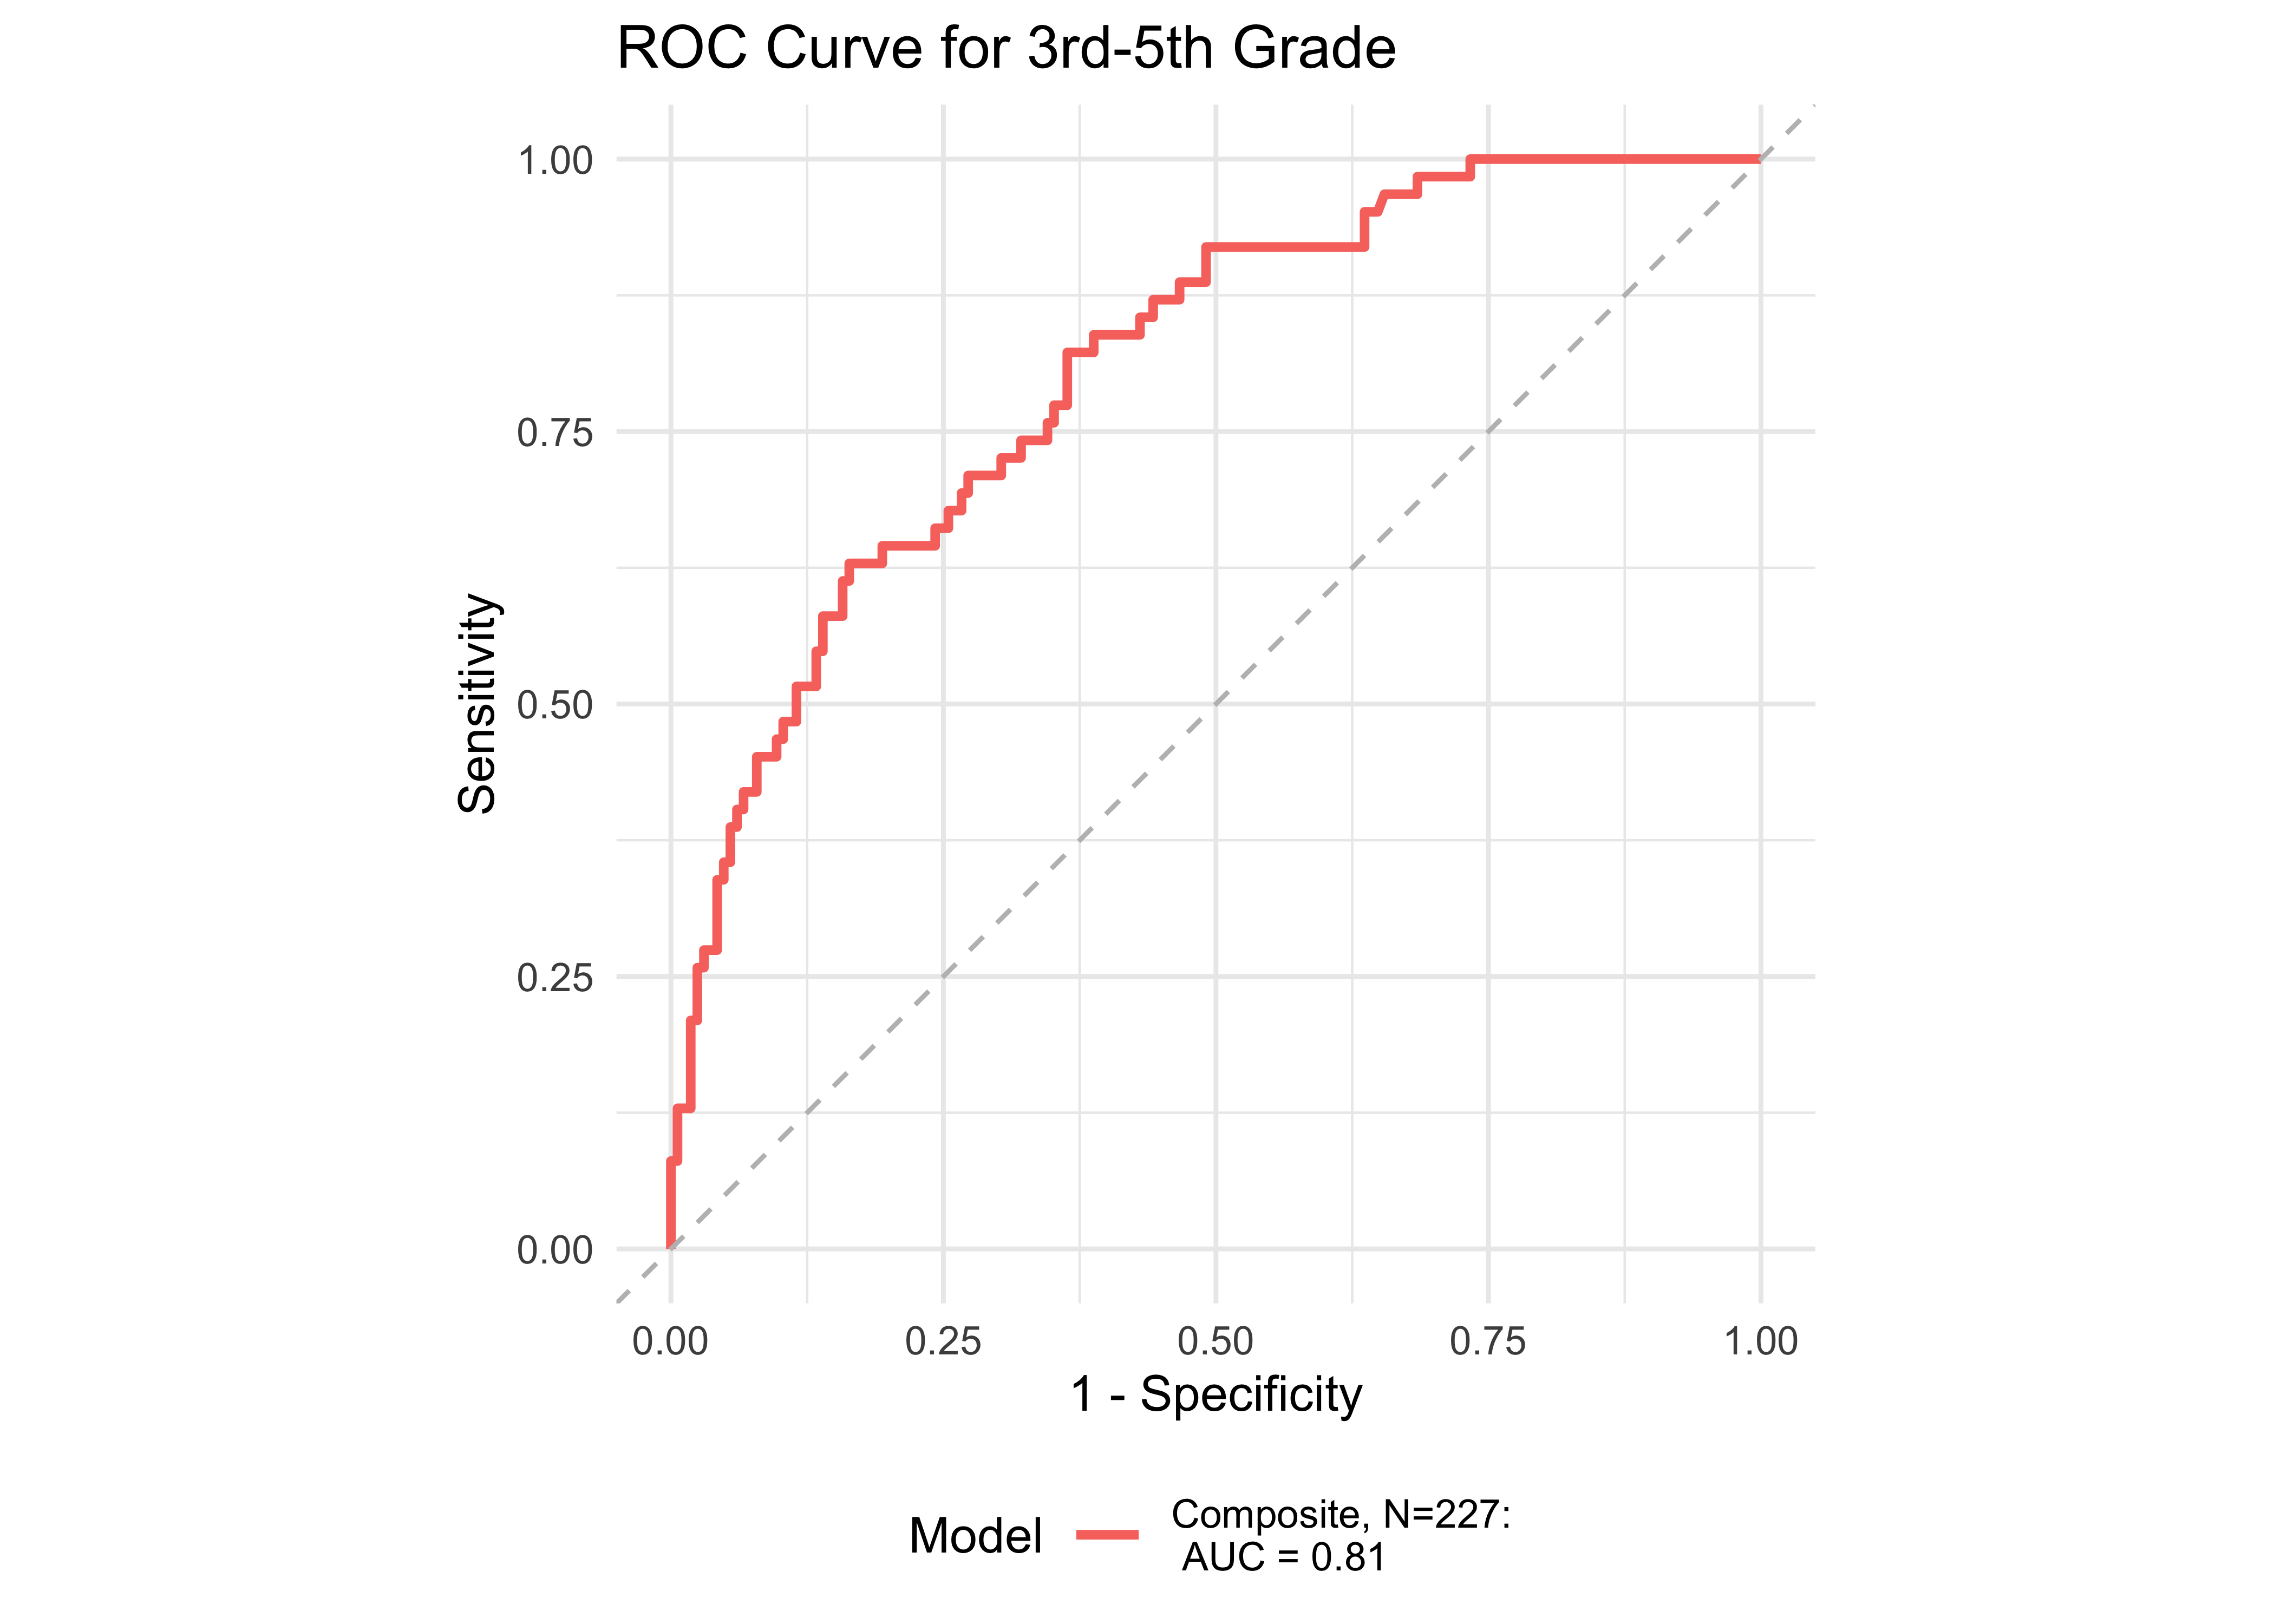
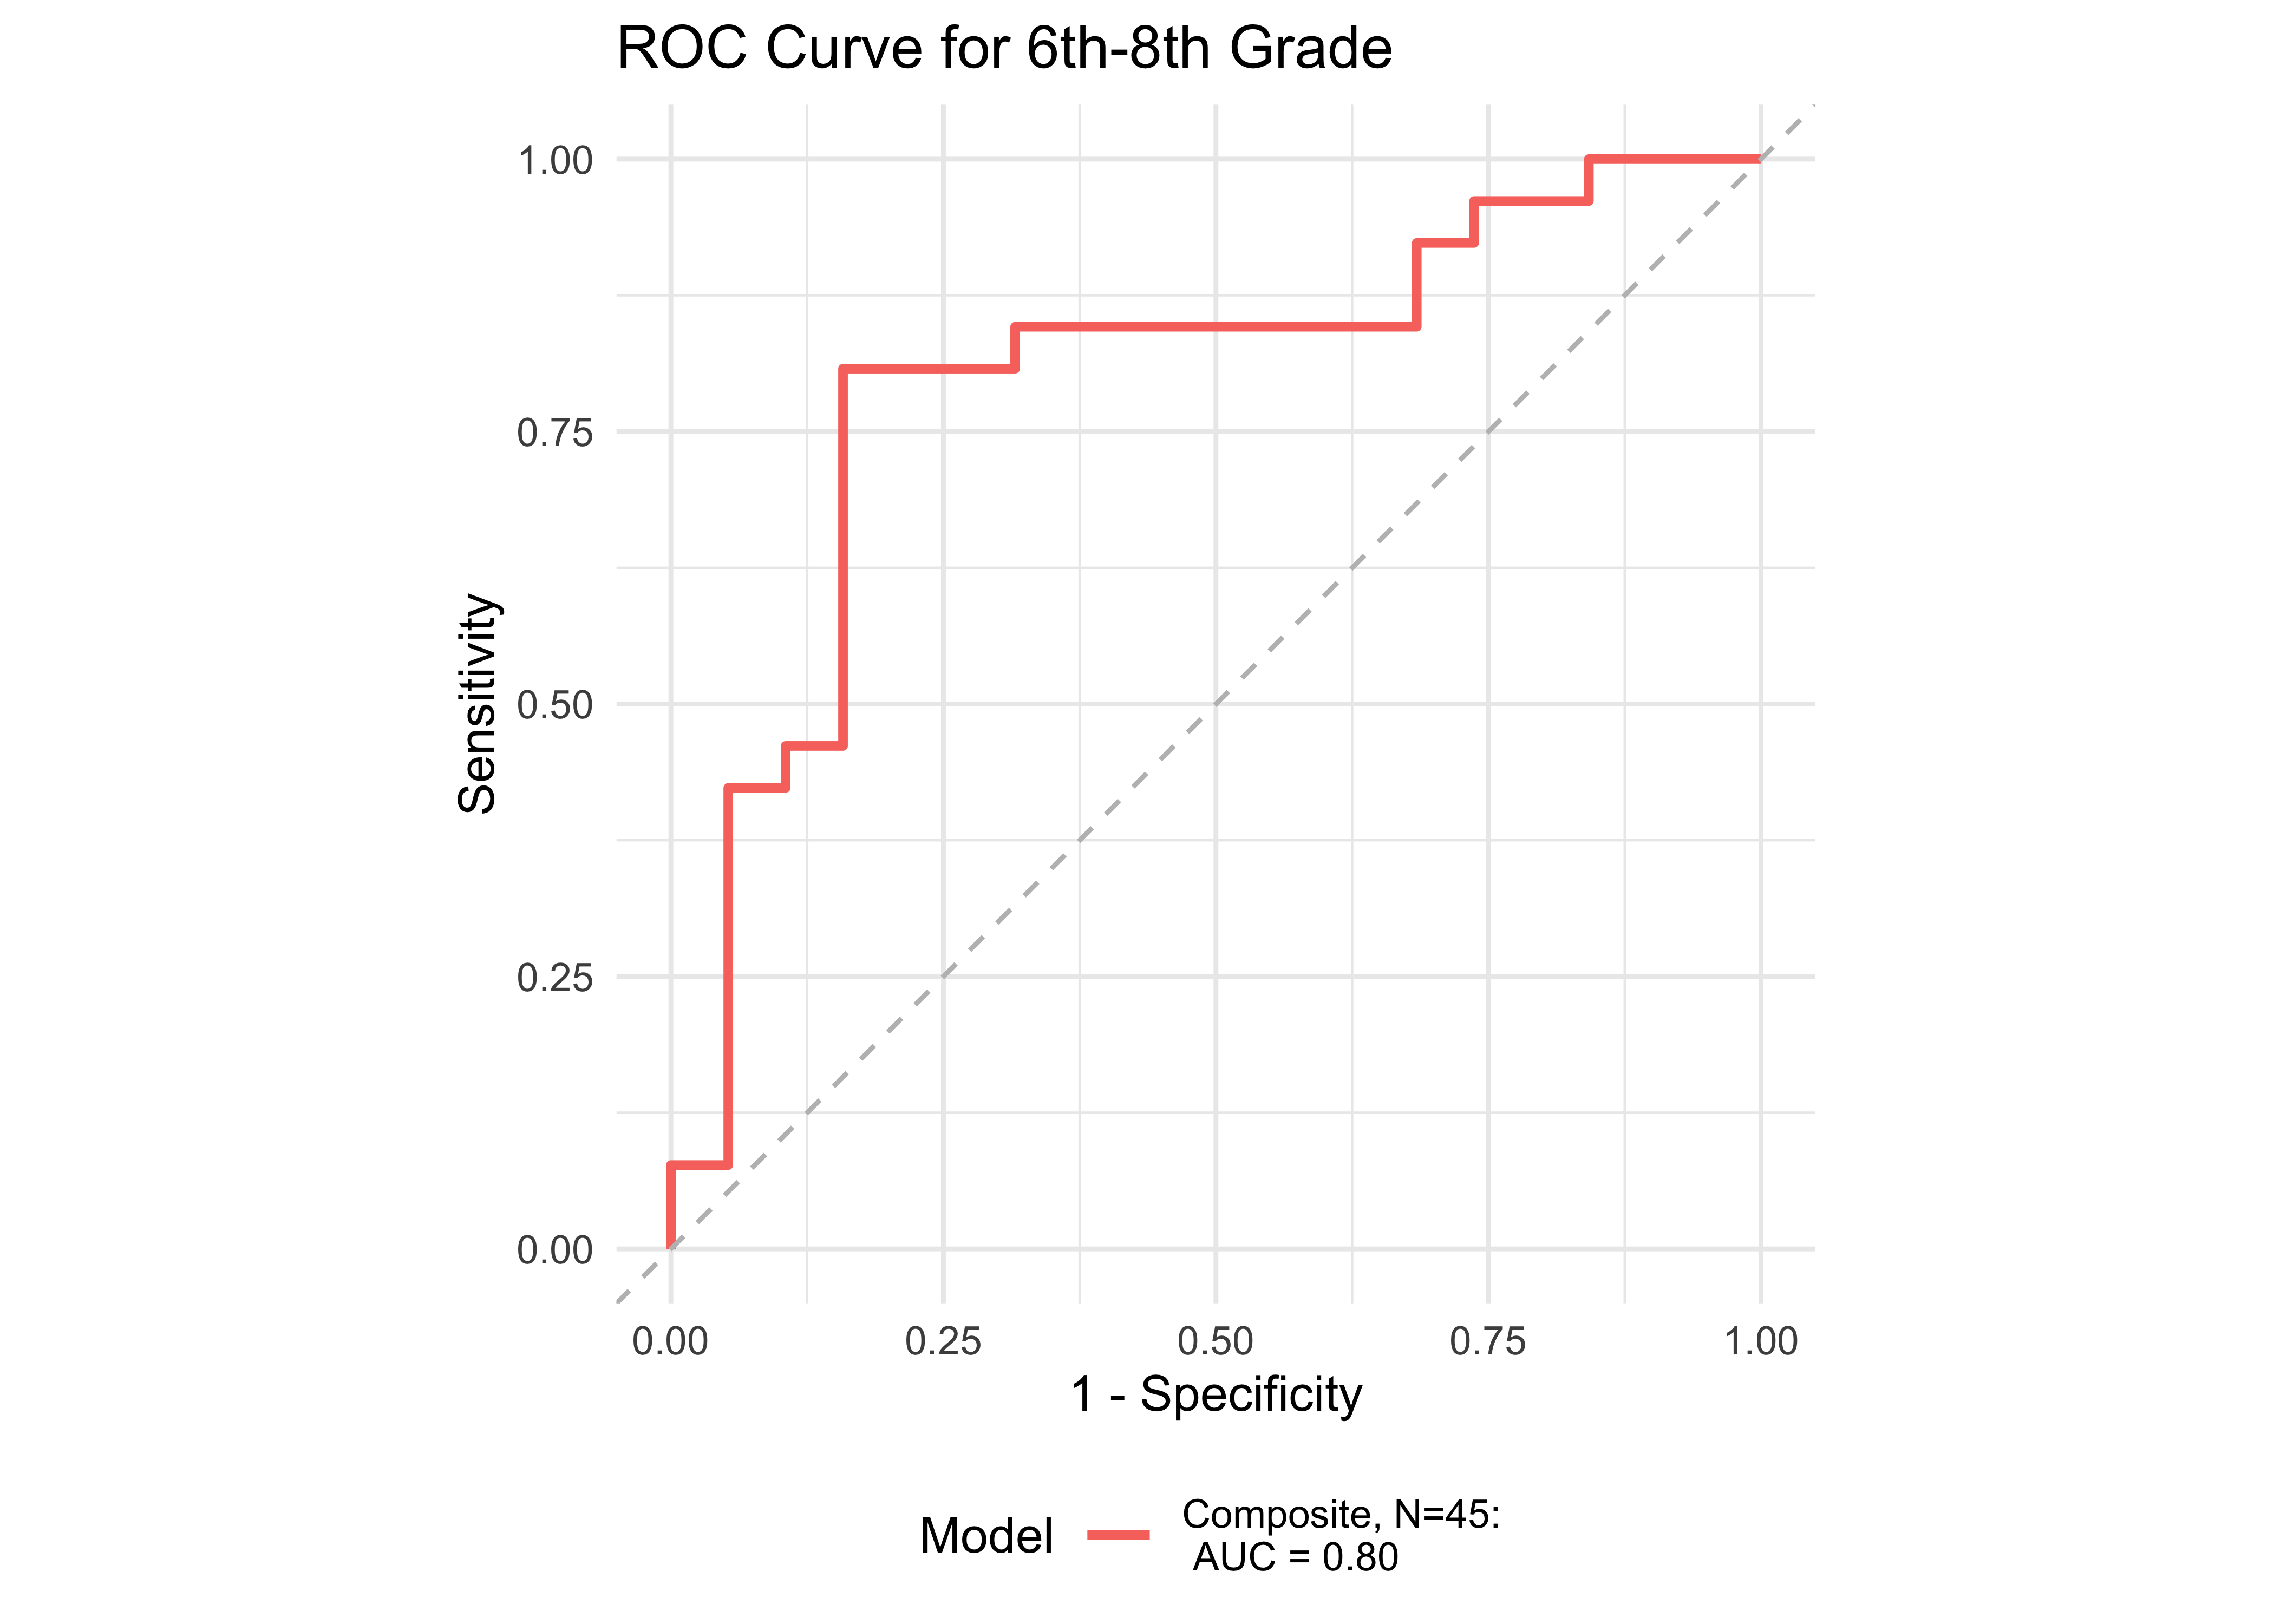
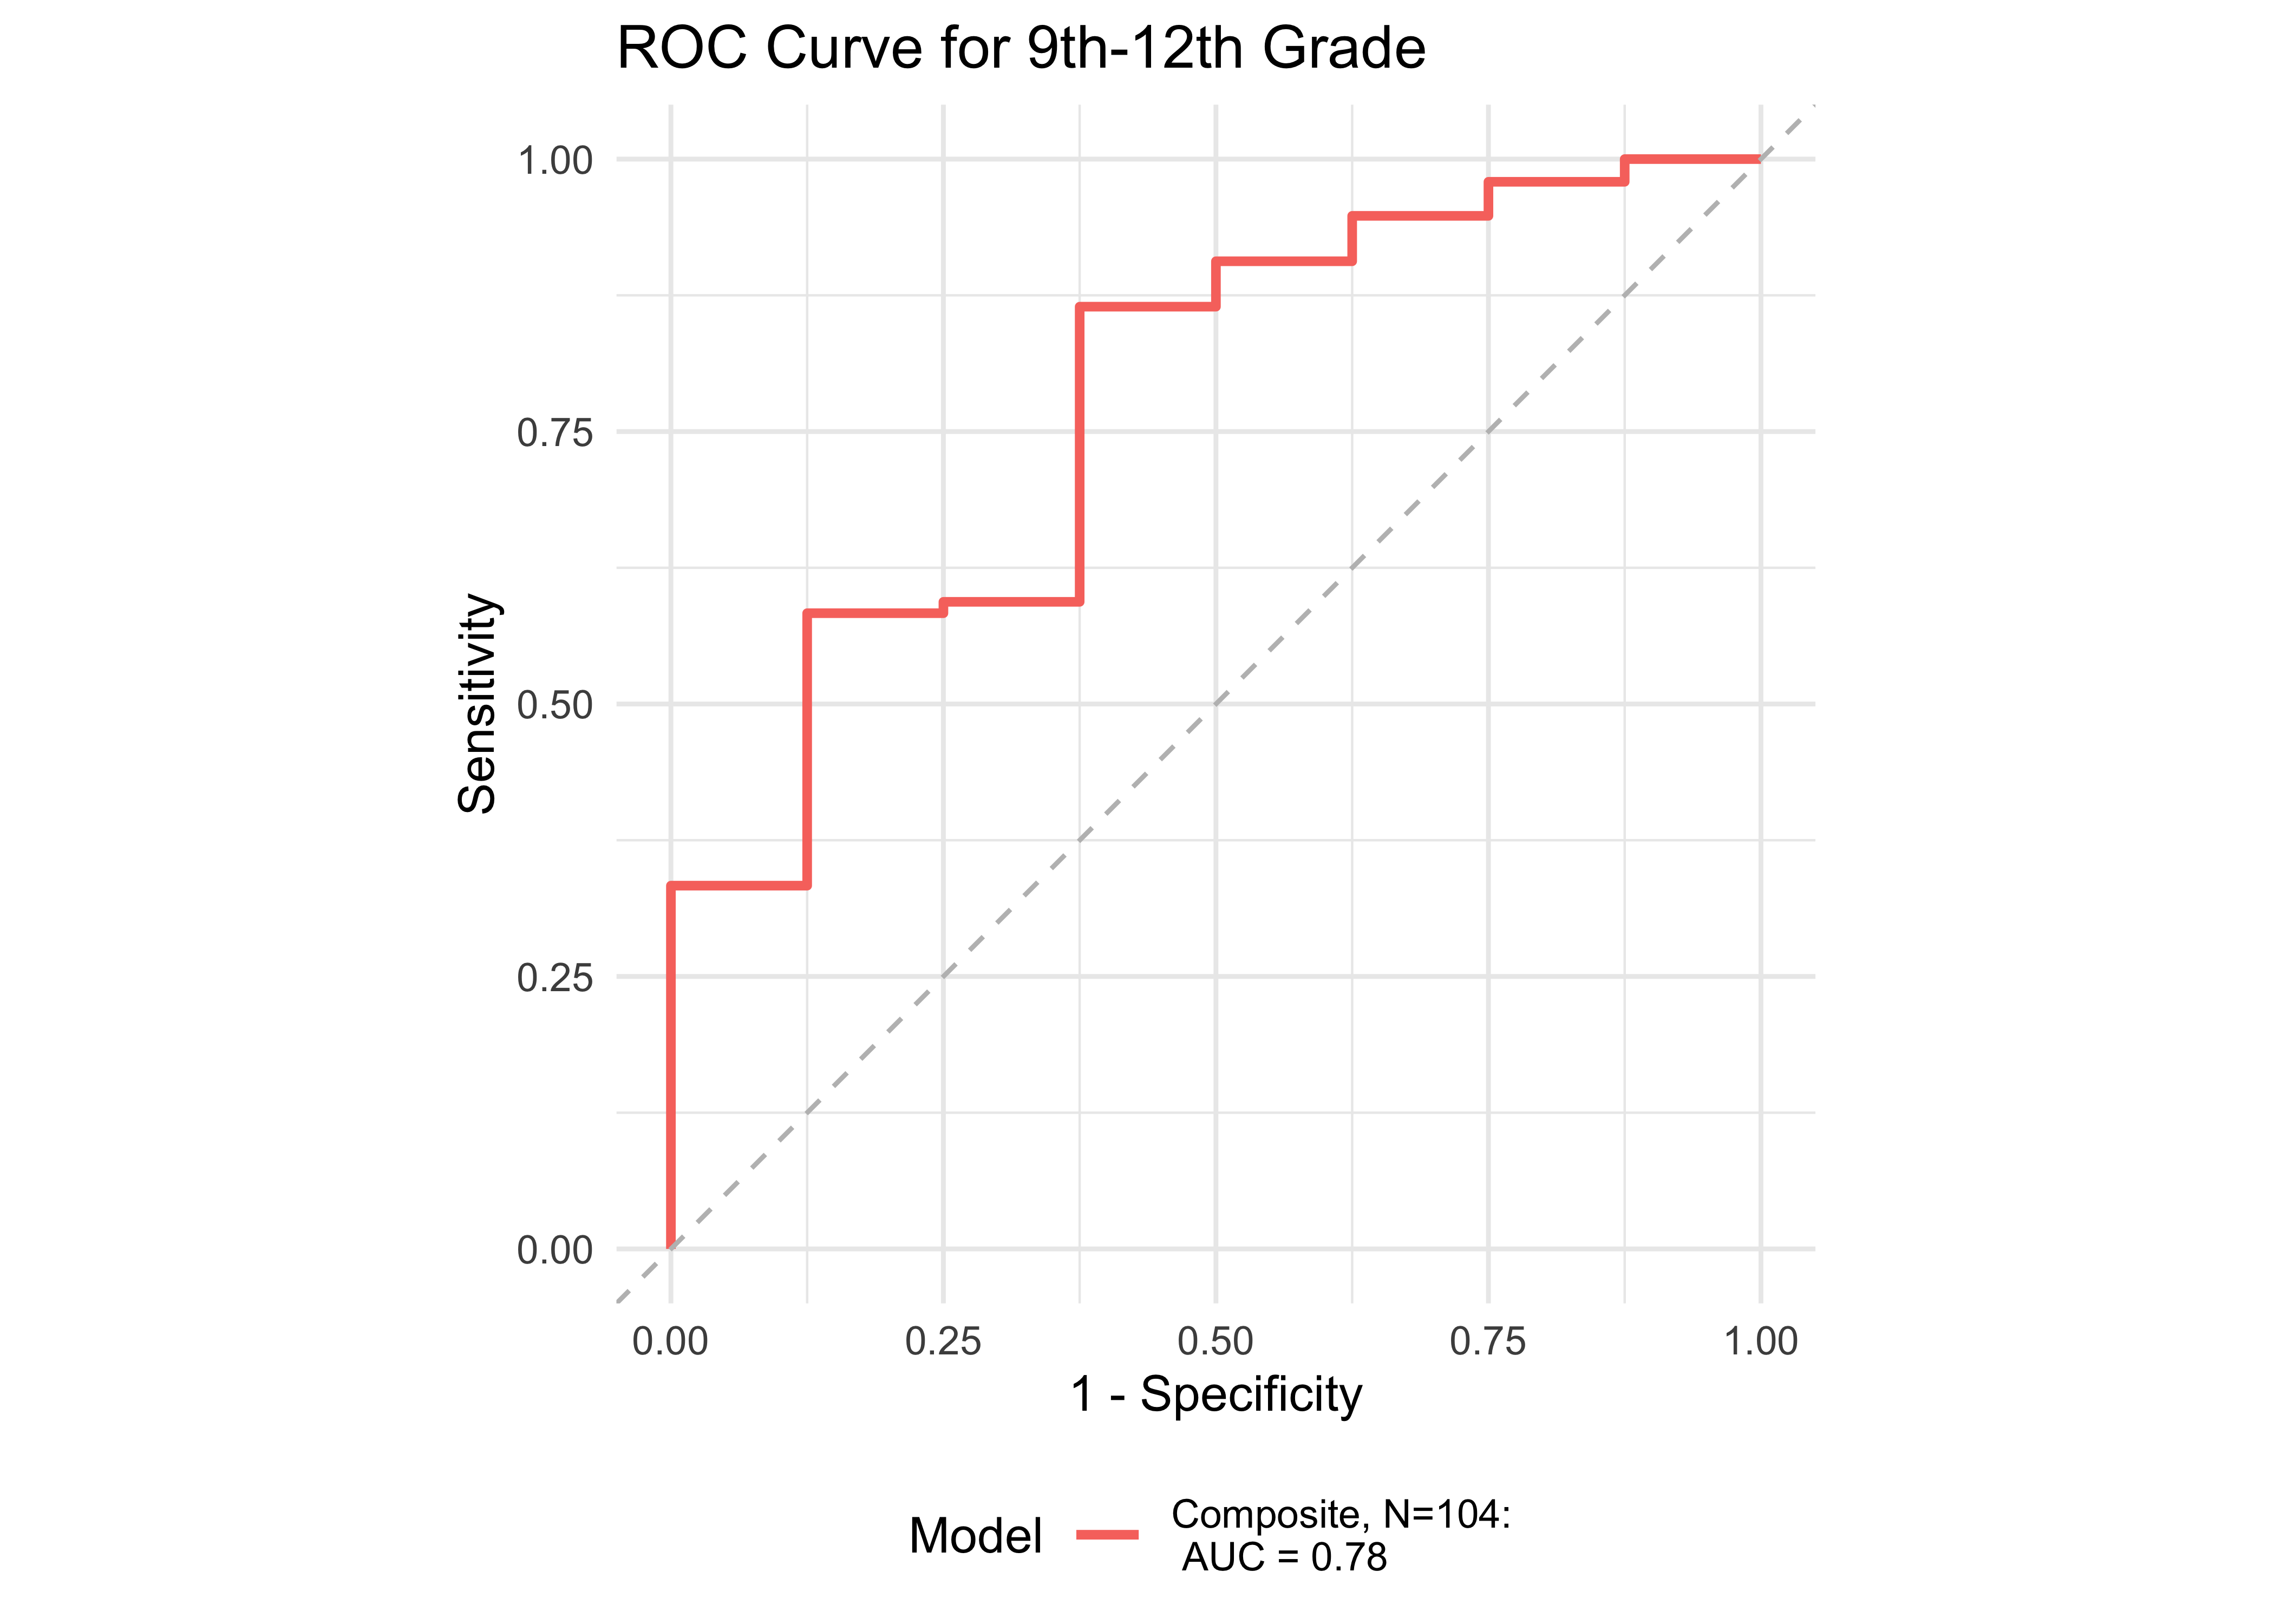
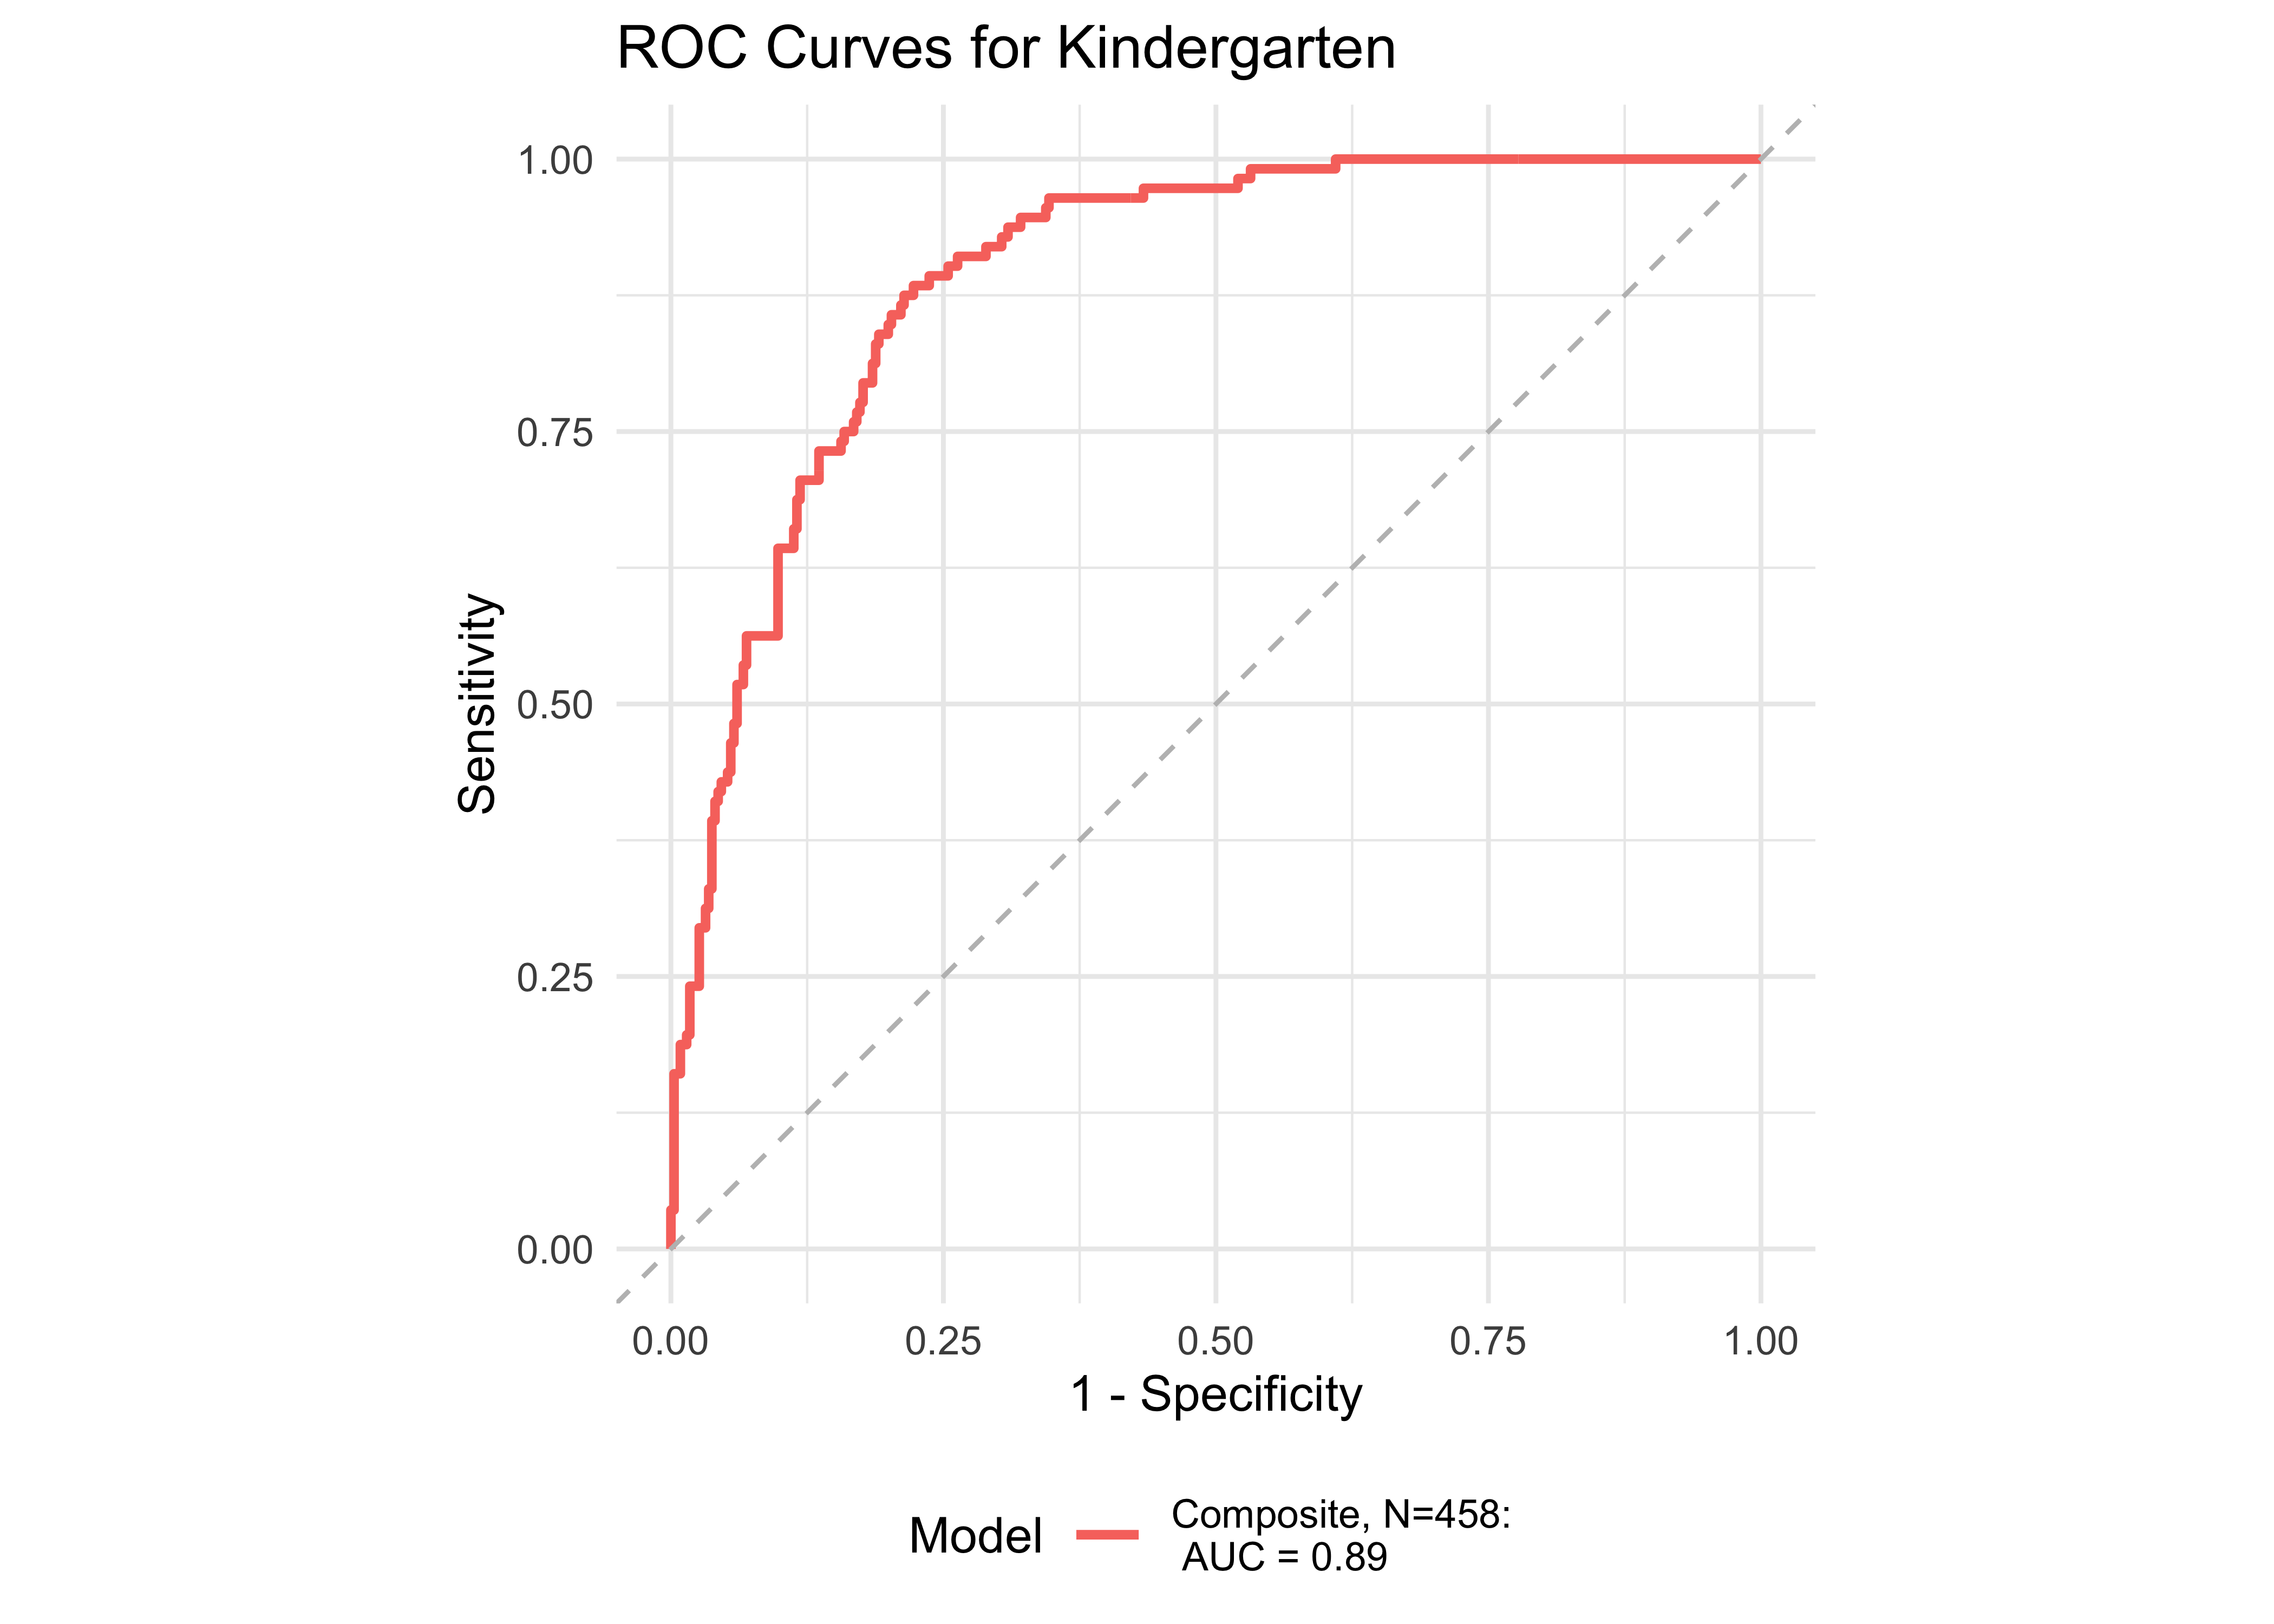
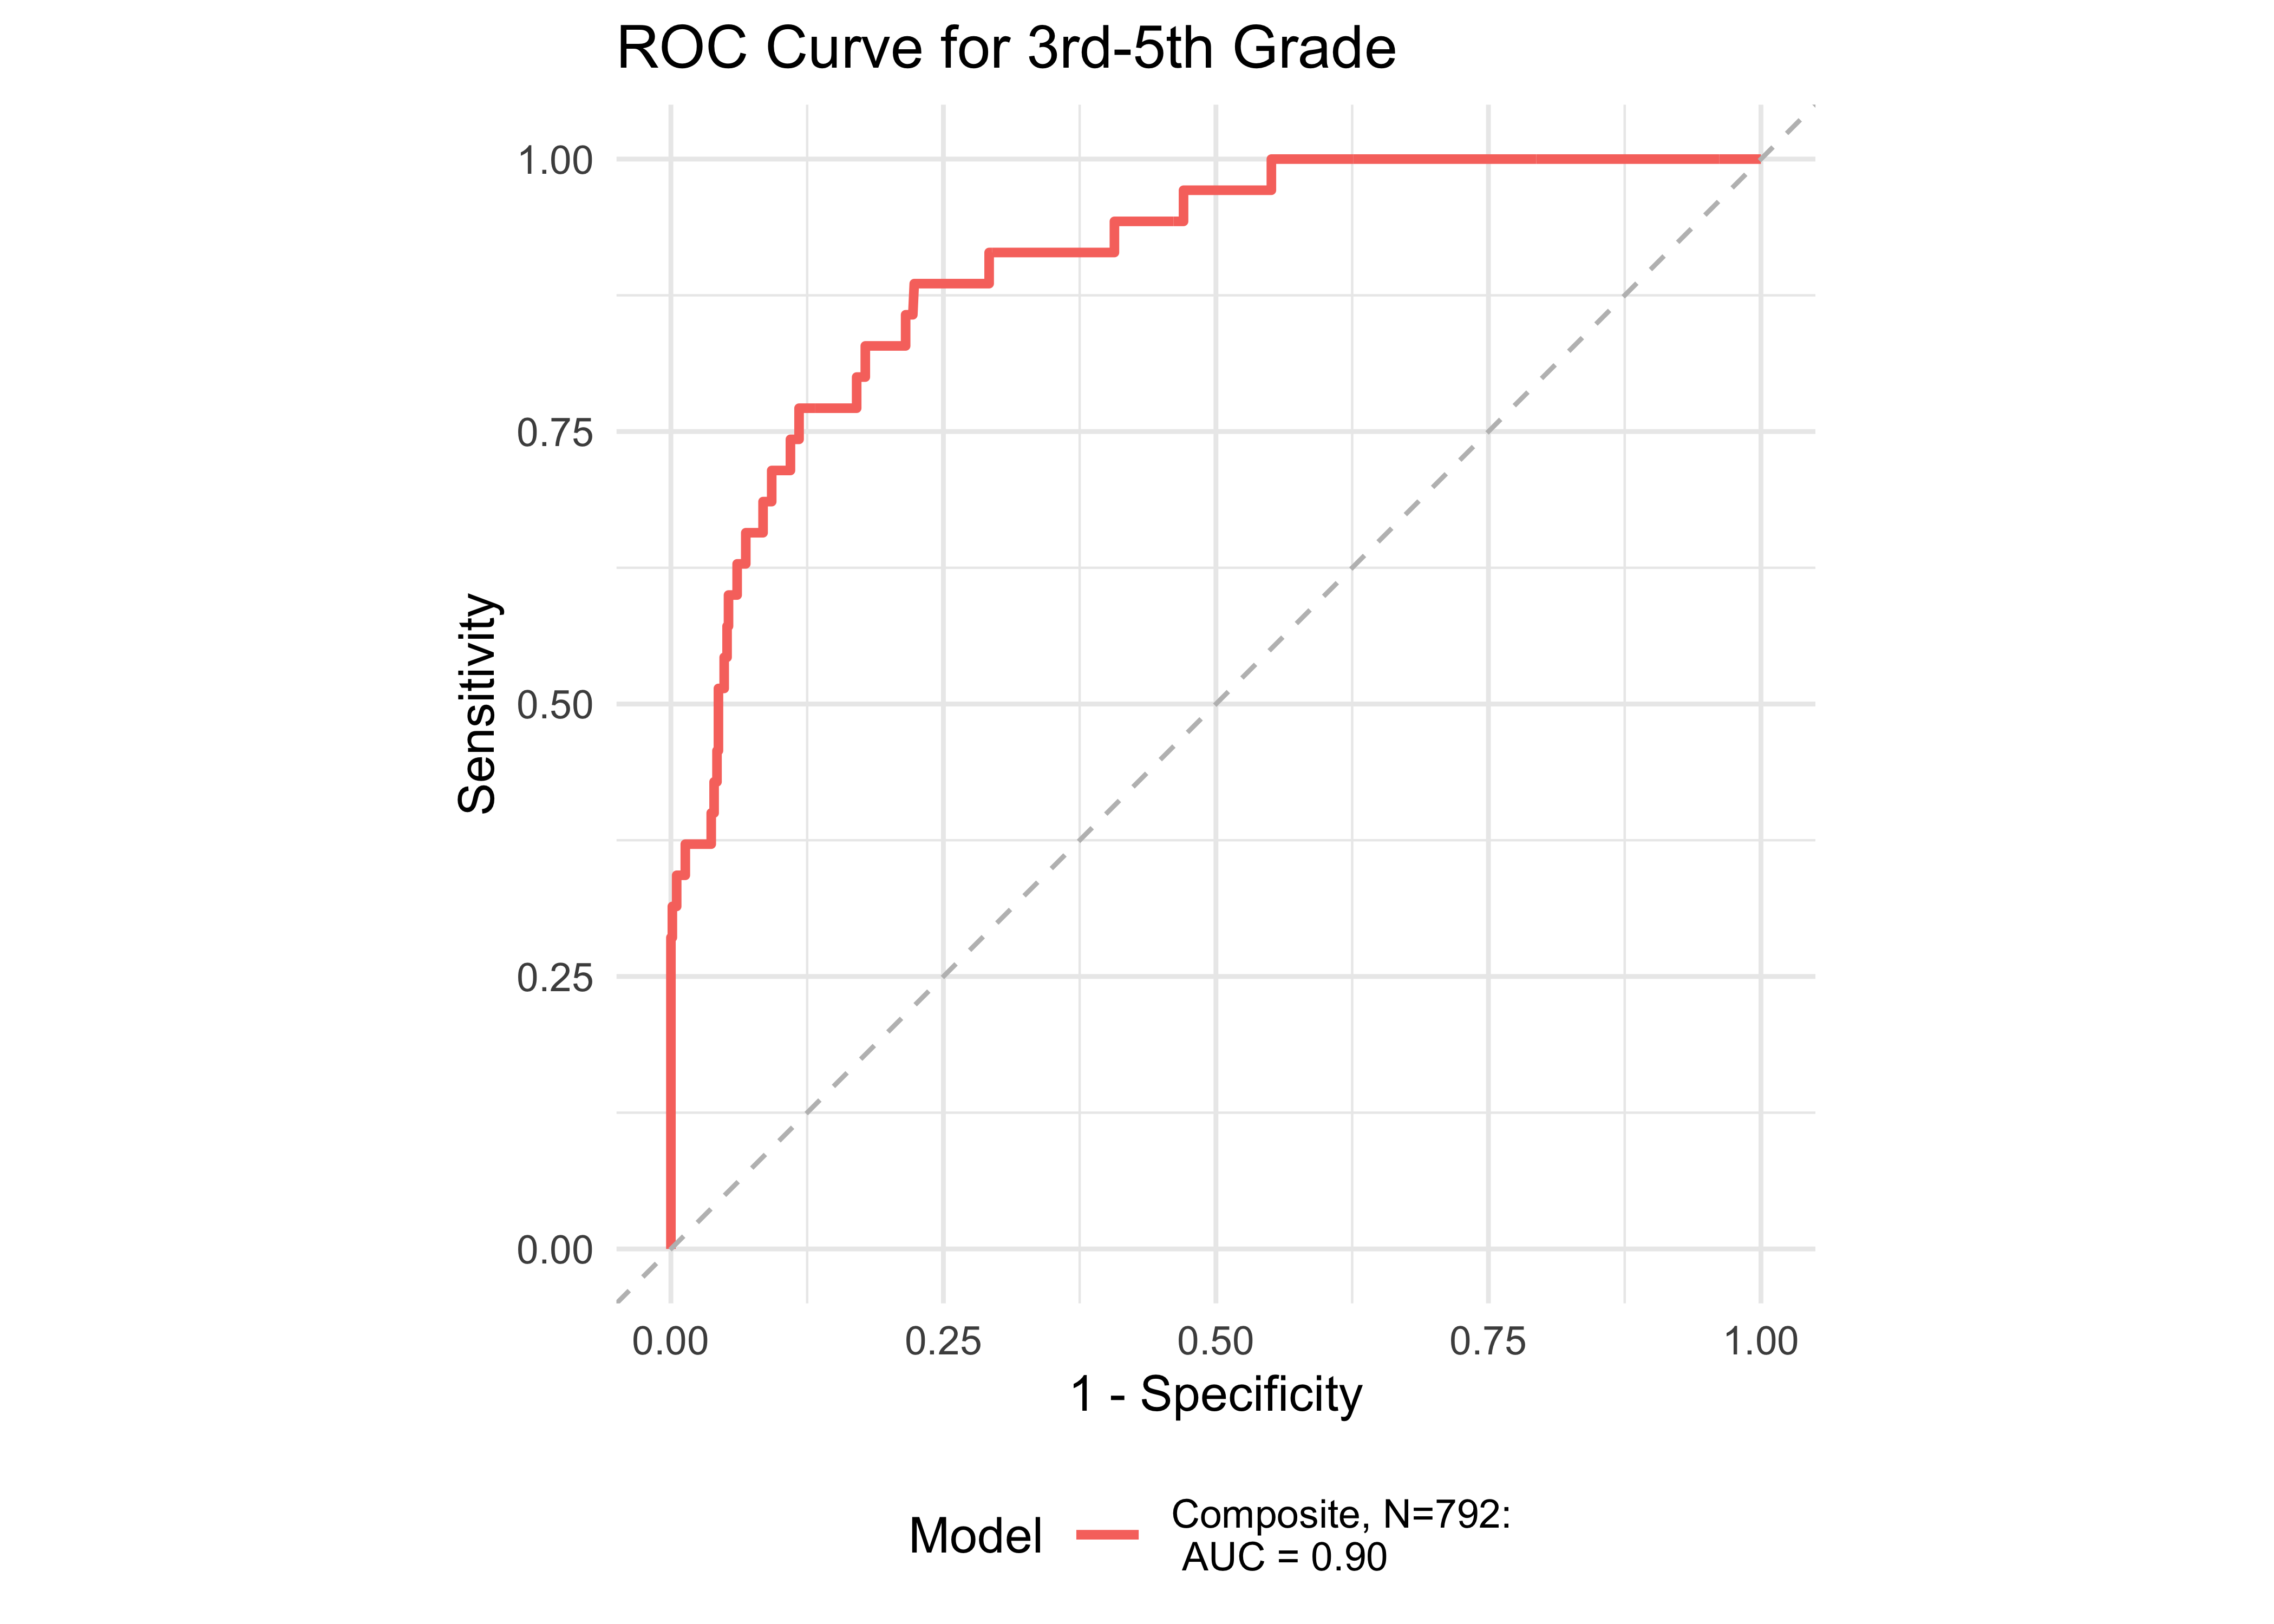
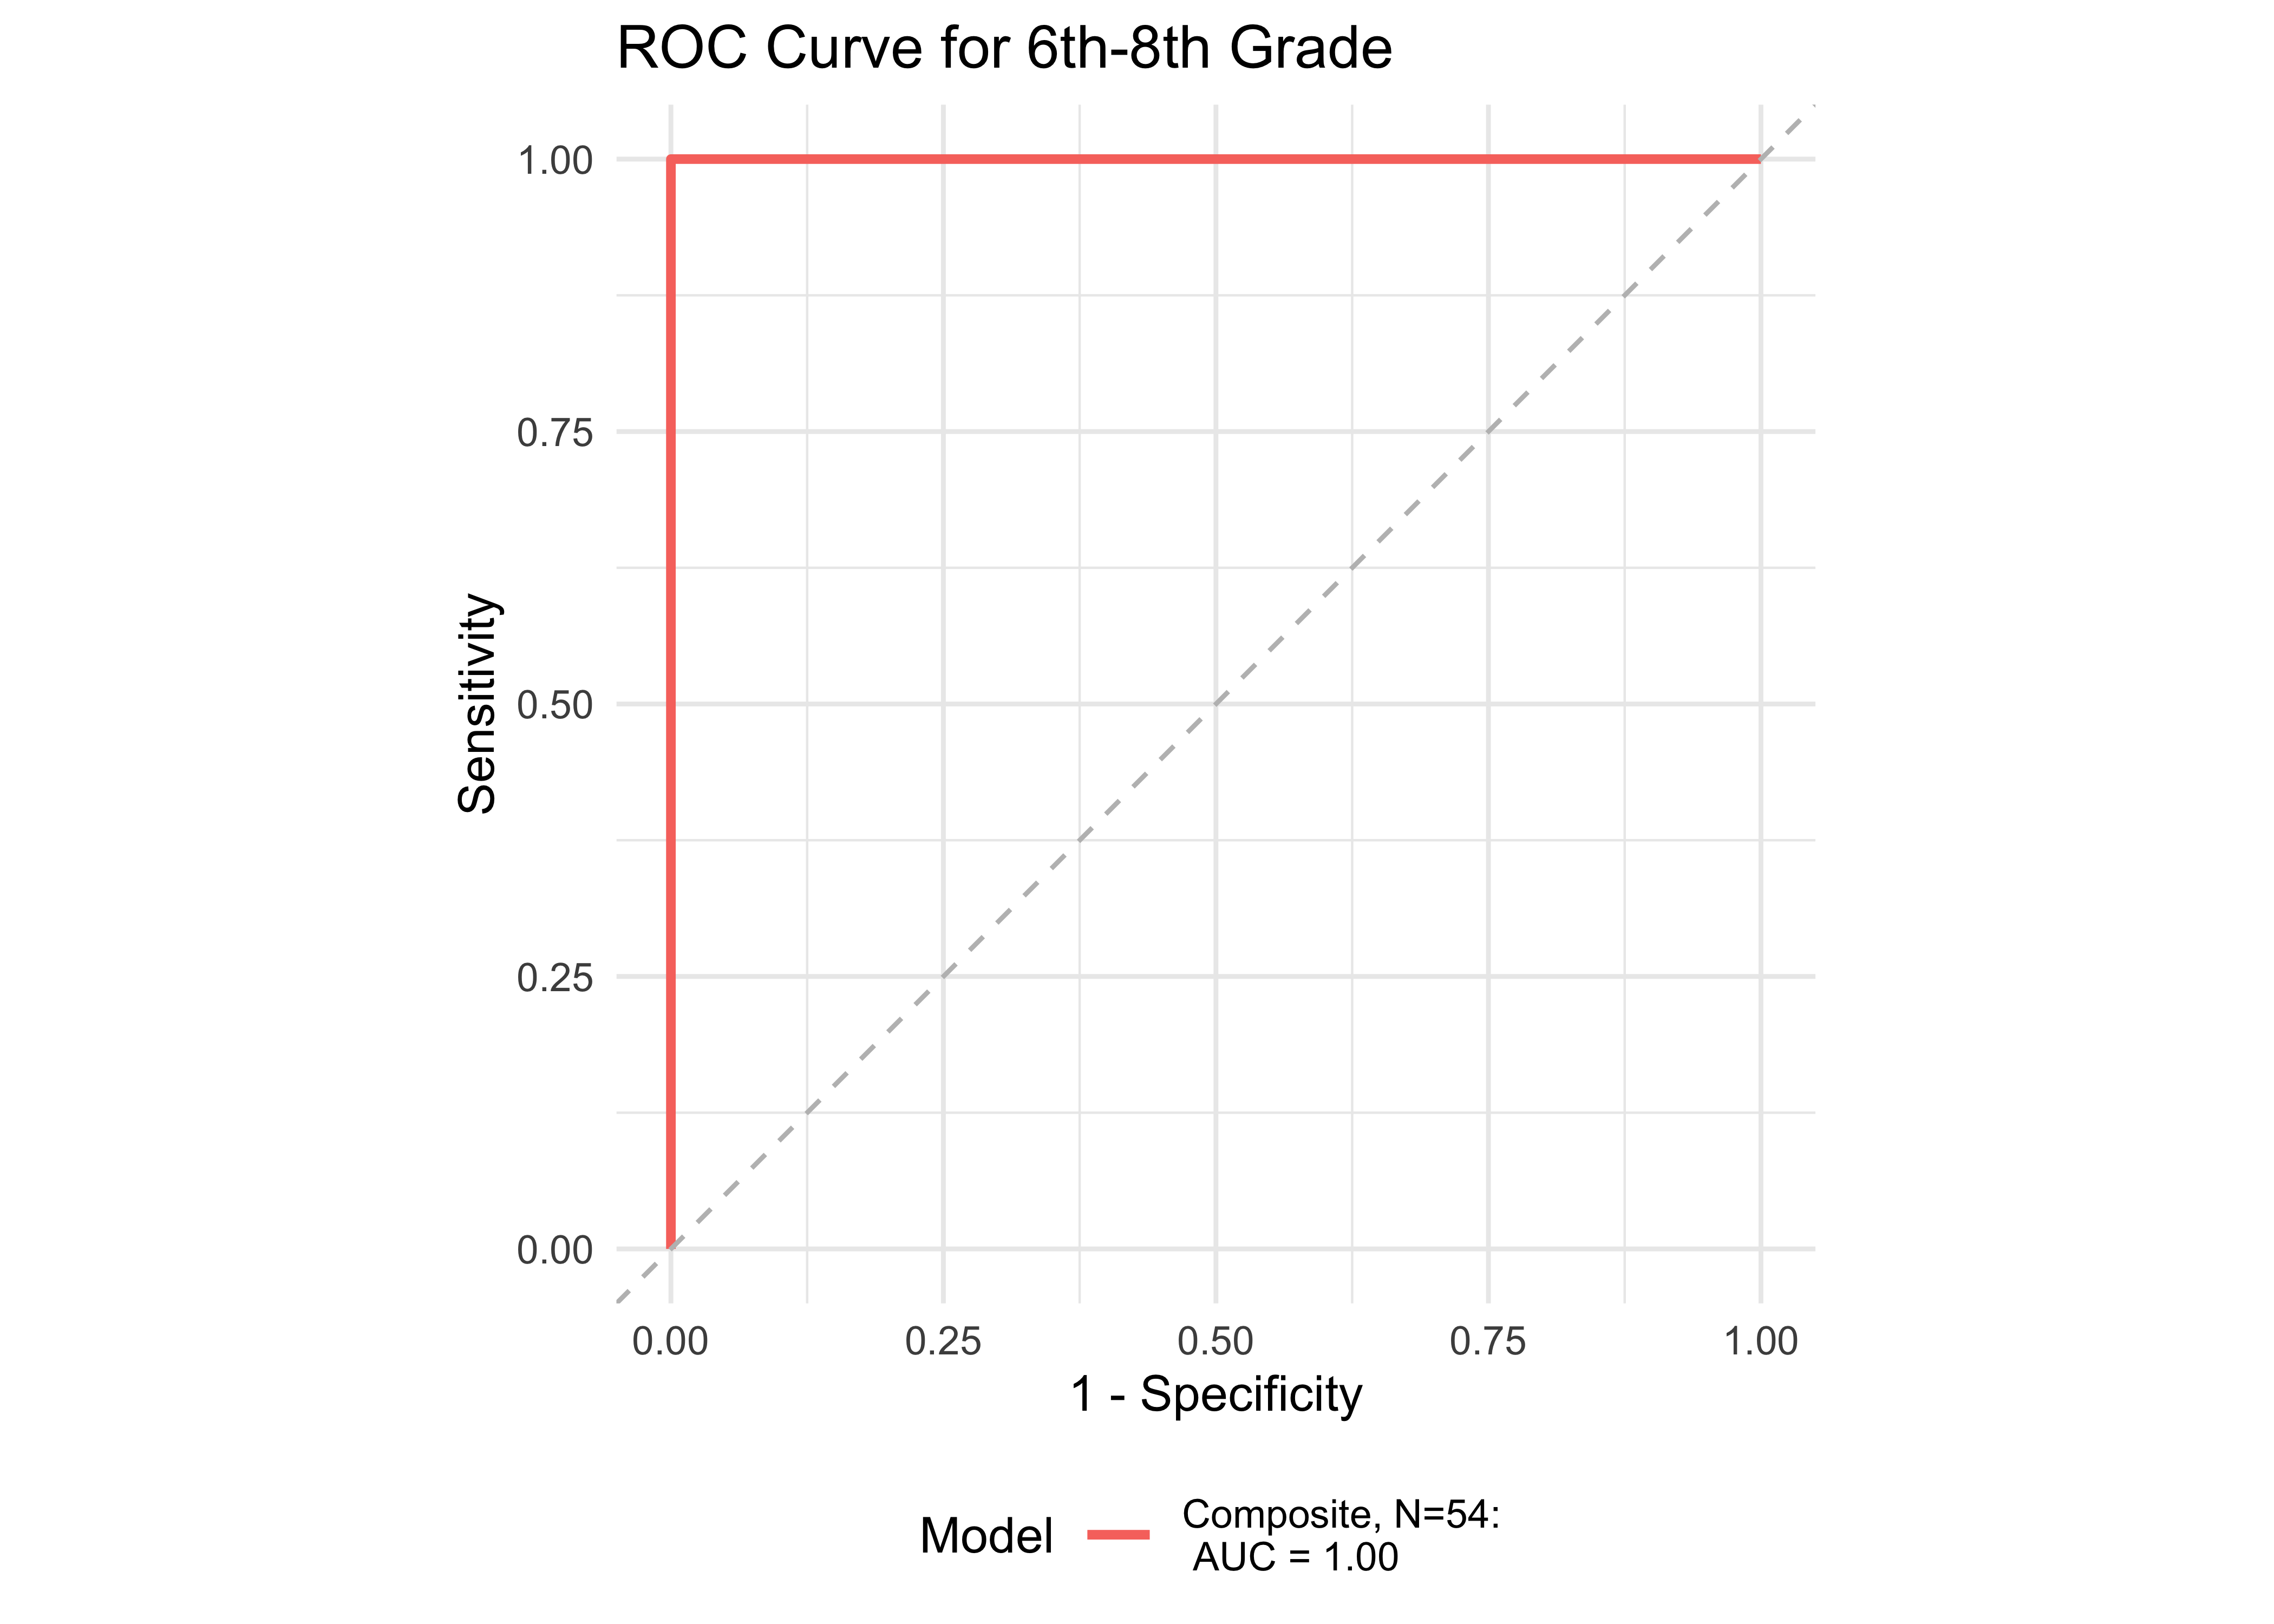
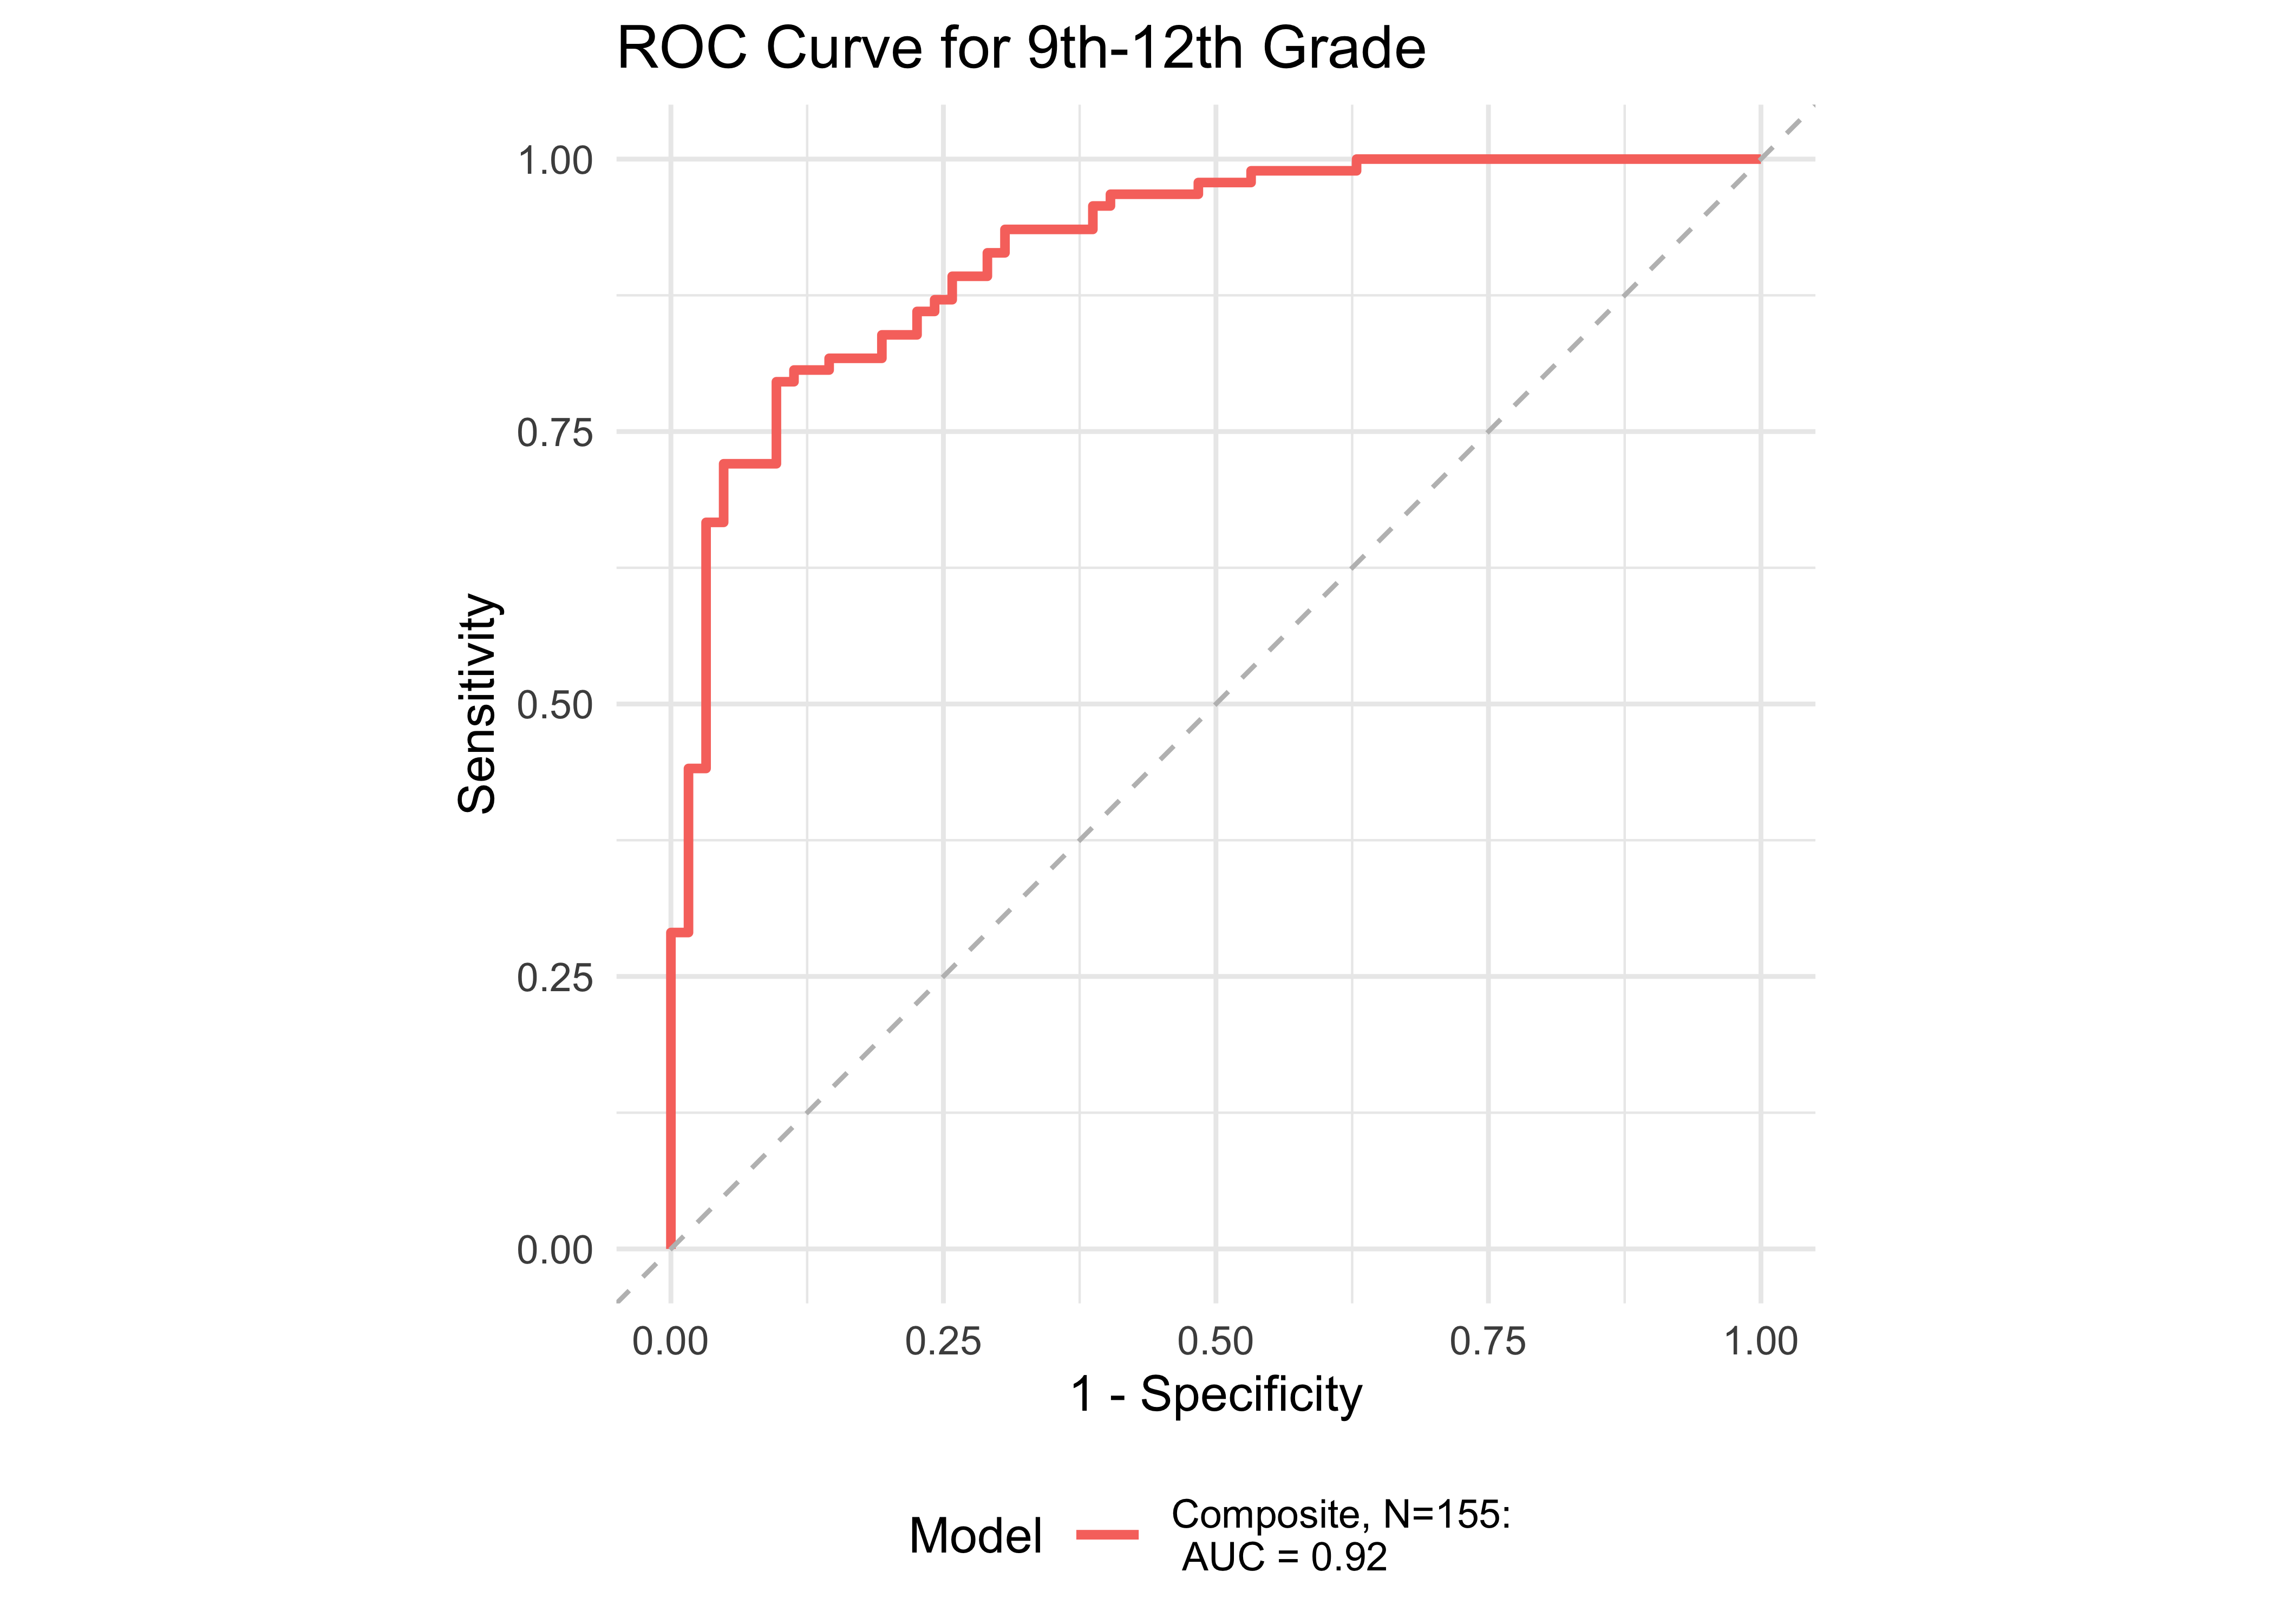
Figure 32.13 shows ROC curves across different grades computed from a generalized additive model (logistic link function) with the ROAR Composite as a predictor of the Woodcock Johnson Basic Reading Skills “Some Risk” category. Figure 32.14 shows an ROC curves for Woodcock Johnson Basic Reading Skills “High Risk” category.
In kindergarten through 12th grade, the ROAR Composite Score as a single predictor achieved acceptable classification accuracy (AUC => 0.78). In grades K-2, ROAR-Word achieved excellent classification accuracy on its own (AUG > 0.9). For older grades accuracy was lower, and this reflects the psychometric properties of the criterion measure in older students. Many middle school and high school students are at the ceiling of the Woodcock Johnson Basic Reading Skills index (for example see Table 27.3 which shows the decline in reliability of WJ in older grades). Despite the lower reliability of the criterion measure, accuracy was still good in middle school for the ROAR Composite Score on its own (AUC = 0.80).
| Age Range | AUC | Best Specificity | Best Sensitivity | Specificity (Sensitivity at 0.9) | Sensitivity at 0.9 | N |
|---|---|---|---|---|---|---|
| Kindergarten | 0.96 | 0.82 | 0.98 | 0.85 | 0.91 | 229 |
| 1st | 0.91 | 0.87 | 0.84 | 0.70 | 0.91 | 235 |
| 2nd | 0.90 | 0.77 | 0.87 | 0.72 | 0.90 | 326 |
| 3rd-5th | 0.81 | 0.84 | 0.63 | 0.51 | 0.90 | 227 |
| 6th-8th | 0.80 | 0.84 | 0.81 | 0.26 | 0.92 | 45 |
| 9th-12th | 0.78 | 0.62 | 0.86 | 0.38 | 0.91 | 104 |


| Age Range | AUC | Best Specificity | Best Sensitivity | Specificity (Sensitivity at 0.9) | Sensitivity at 0.9 | N |
|---|---|---|---|---|---|---|
| Kindergarten | 0.89 | 0.78 | 0.88 | 0.74 | 0.90 | 458 |
| 1st | 0.88 | 0.77 | 0.88 | 0.70 | 0.91 | 521 |
| 2nd | 0.90 | 0.85 | 0.82 | 0.67 | 0.90 | 726 |
| 3rd-5th | 0.90 | 0.78 | 0.89 | 0.59 | 0.91 | 792 |
| 6th-8th | 1.00 | 1.00 | 1.00 | 1.00 | 0.94 | 54 |
| 9th-12th | 0.92 | 0.90 | 0.80 | 0.71 | 0.90 | 155 |
32.4 Study 3: Two-year longitudinal study with Woodcock Johnson’s Basic Reading Skills (BRS)
In a large California school district, all the 1st grade classrooms were administered ROAR Foundational Reading Skills measures three times per year and were followed longitudinally for 2 years. In the fall of 3rd grade, each student was individually administered the Woodcock Johnson Basic Reading Skills (WJ BRS) Composite Index. Based on this criterion measure, we assessed sensitivity and specificity of ROAR at each timepoint for predicting students who were classified as struggling readers with indications of dyslexia.
32.4.1 ROAR measures of foundational reading skills within seasons
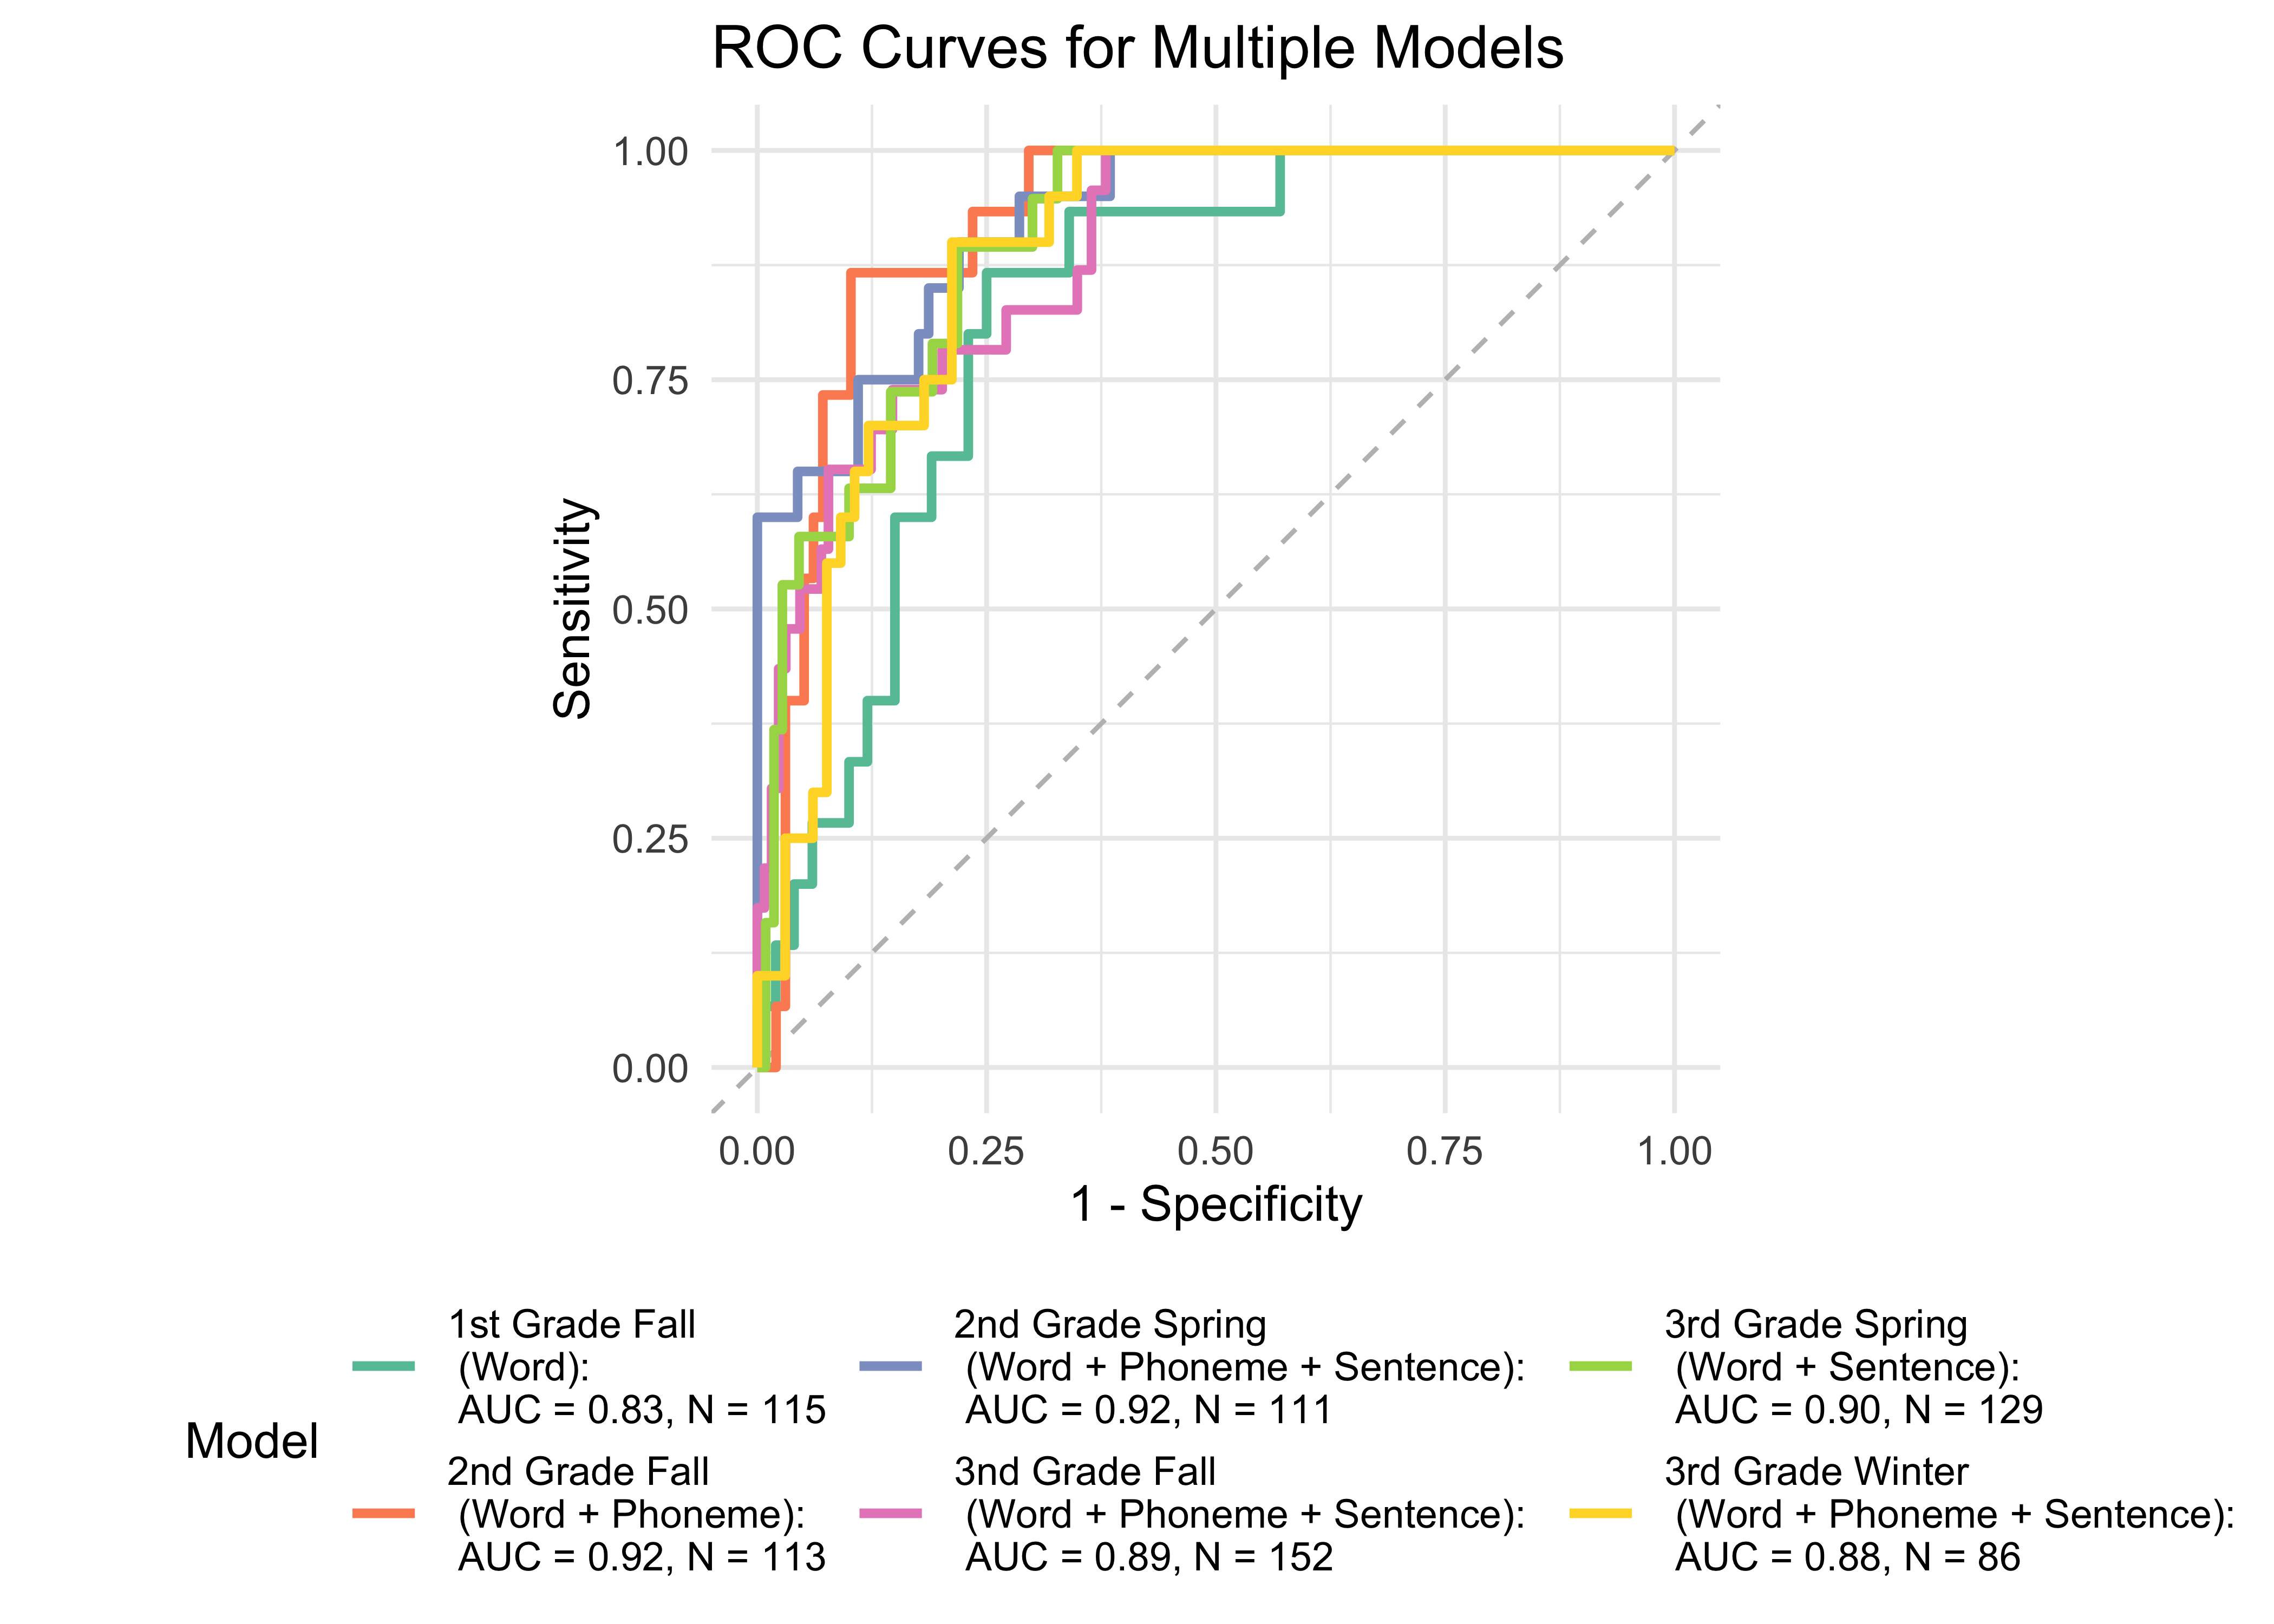
We now examine model accuracy based on a logistic regression model split across various time periods and administrations with combinations of ROAR foundational reading skills measures as predictors. Determining how models perform throughout the school year is an important step in understanding ROAR’s ability to predict students’ reading abilities and Woodcock Johnson Basic Reading Skills scores across multiple school years.
Figure 32.15 shows ROC curves across different grades and timepoints computed from a generalized additive model (logistic link function) with the ROAR Composite as a predictor of the Woodcock Johnson Basic Reading Skills “Some Risk” category. In 1st through 3rd grade, the ROAR Composite Score as a single predictor achieved acceptable classification accuracy (AUC => 0.83). In 2nd grade Fall and Spring and in 3rd grade Fall, the ROAR Composite Score achieved excellent classification accuracy on its own (AUG > 0.9).
32.4.2 ROAR Composite within seasons
We now examine model accuracy based on a logistic regression model split across various time periods and administrations with the ROAR Composite Score as a single predictor Determining how models perform throughout the school year is an important step in understanding ROAR’s ability to predict students’ reading abilities and Woodcock Johnson Basic Reading Skills scores within a year.
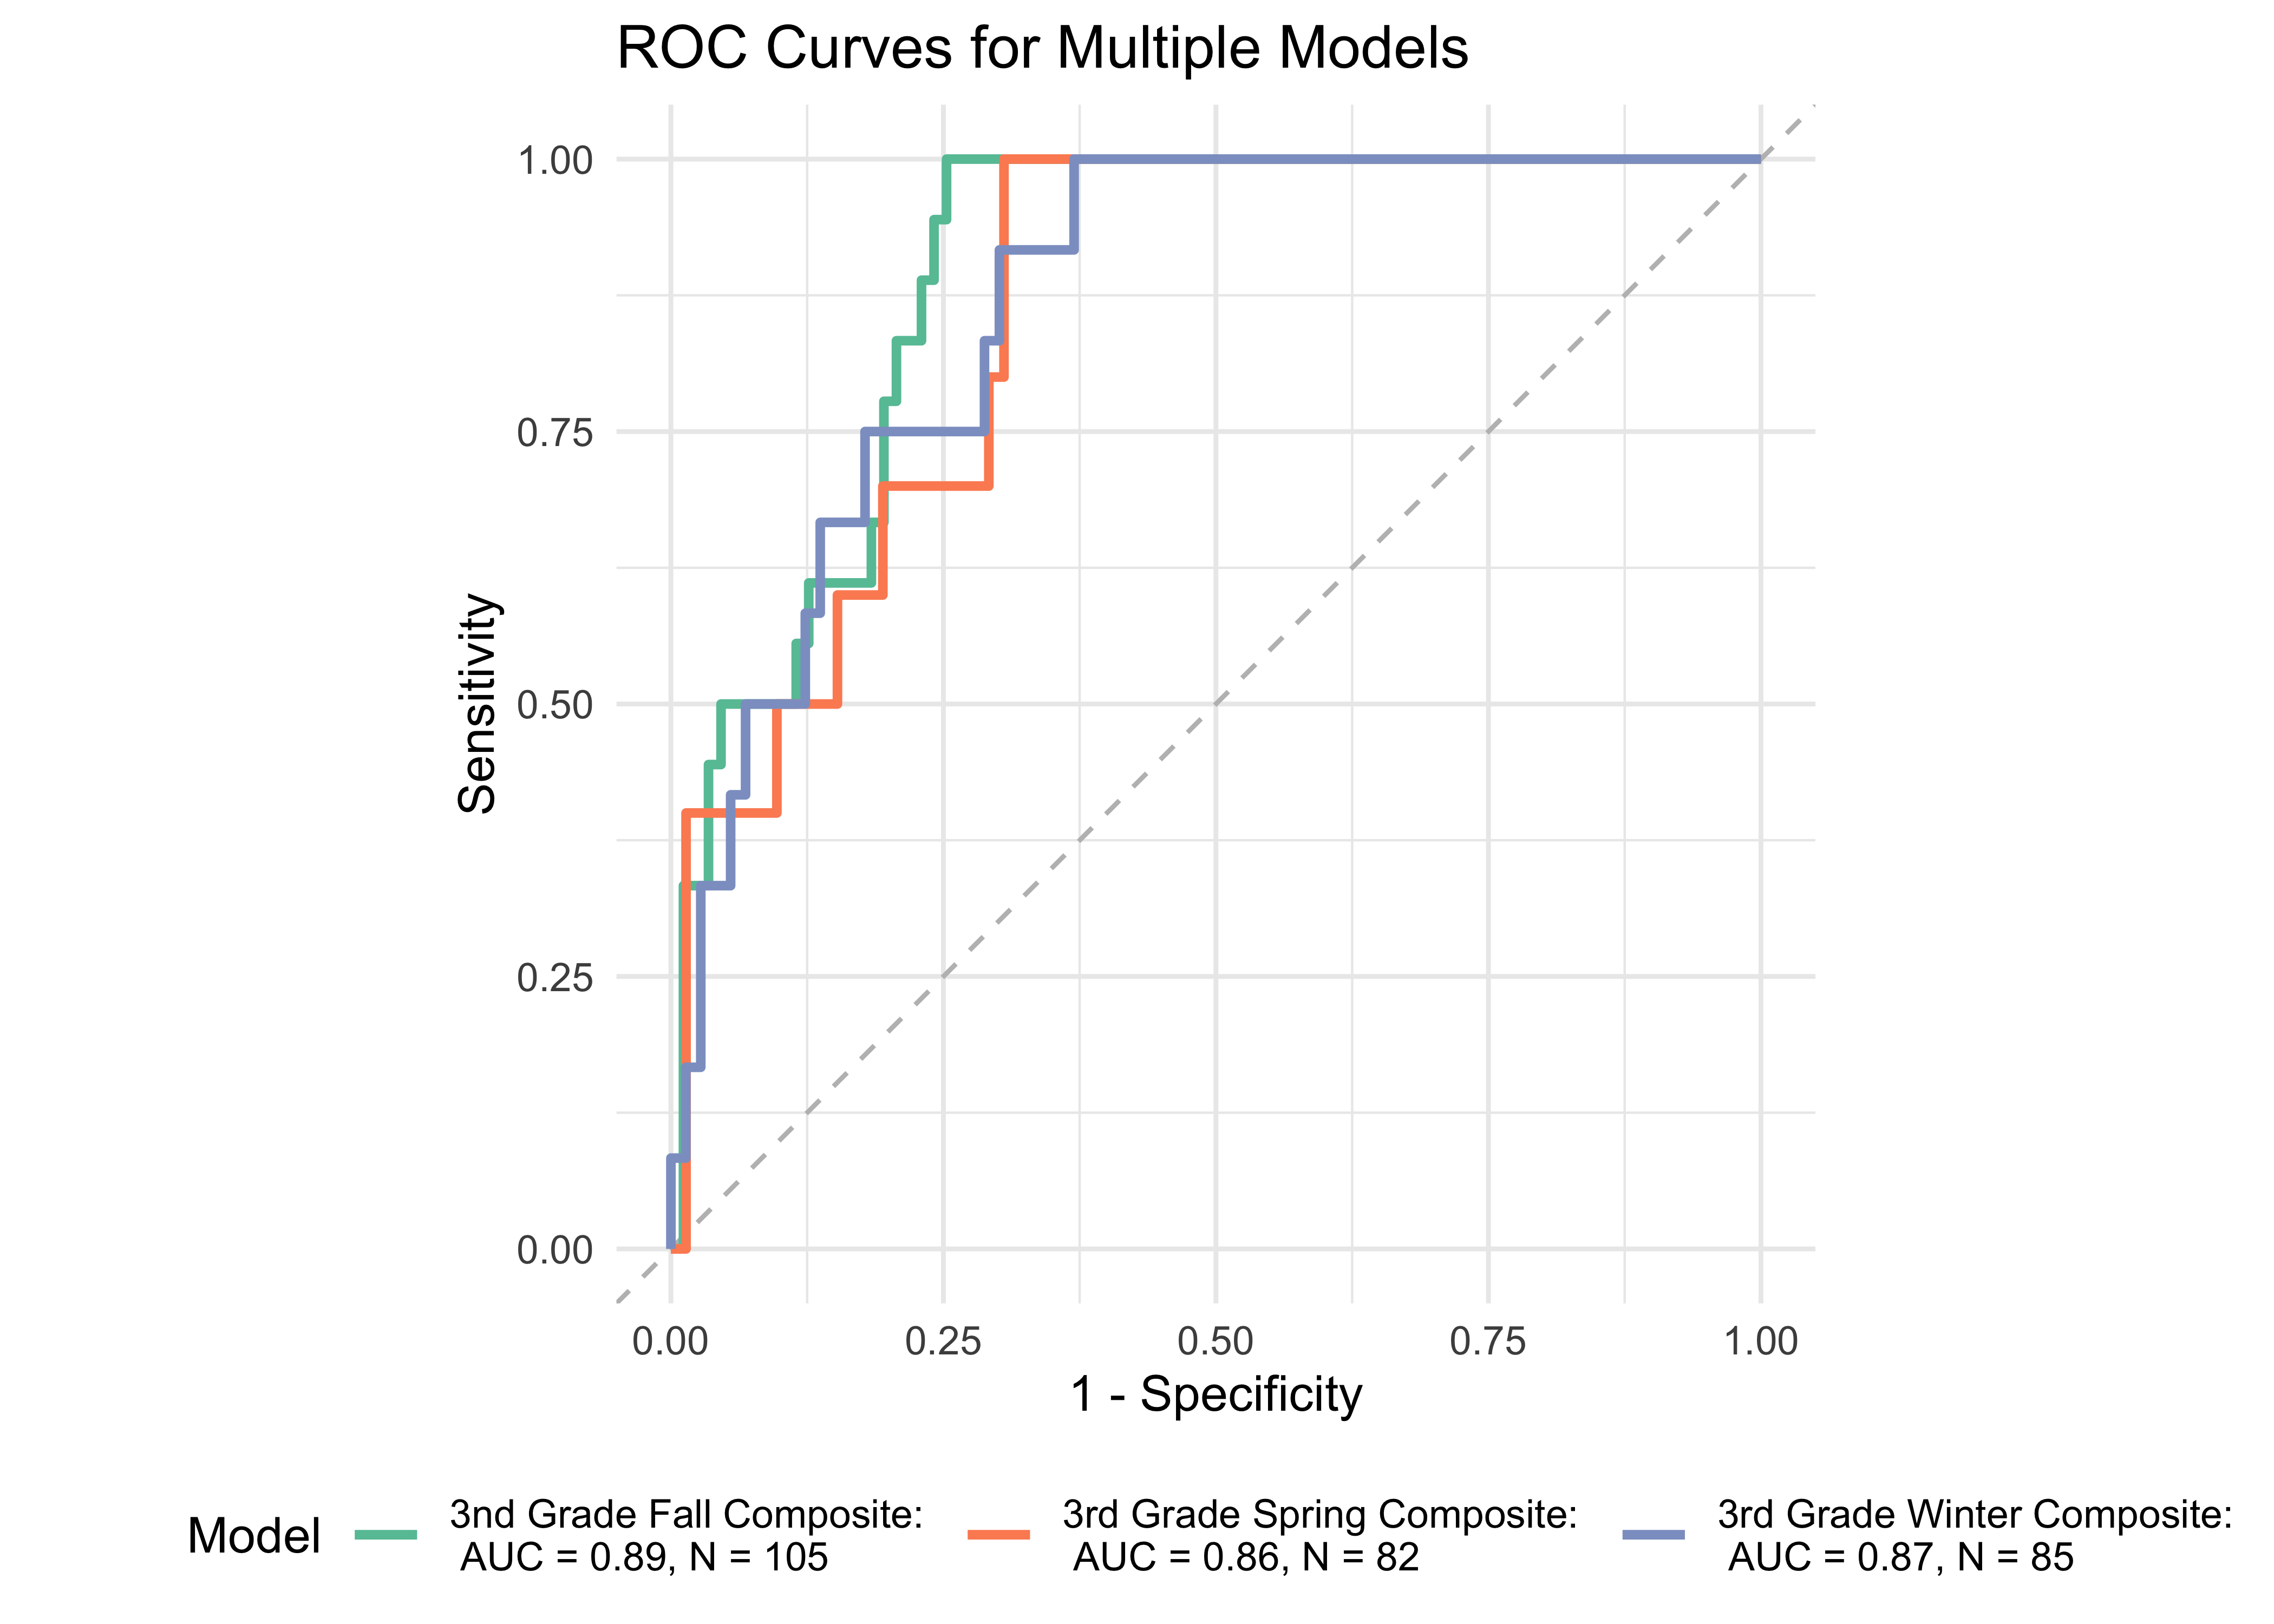
Figure 32.16 shows ROC curves across different grades and timepoints computed from a generalized additive model (logistic link function) with the ROAR Composite as a predictor of the Woodcock Johnson Basic Reading Skills “Some Risk” category. Throughout all seasons of 3rd grade, the ROAR Composite Score as a single predictor achieved acceptable classification accuracy (AUC => 0.86).
32.5 Study 4: K-2 Screening for reading difficulties with Woodcock Johnson Basic Reading Skills (BRS)
Through a research collaboration with a large, diverse and representative district in California, we implemented the ROAR Foundational Reading Skills Suite universally for Kindergarten, 1st, and 2nd grade. The students completed ROAR measures in the Spring of 2024 (2023/24 school year), Fall of 2024, and Spring of 2025 (2024/25 school year). In the Spring of 2025, students were individually administered Woodcock Johnson Letter Word Identification and Word Attack subtest to calculate the Basic Reading Skills Composite score. This standardized score is the most widely used measure in dyslexia research and practice.
32.5.1 ROAR measures of foundational reading skills within seasons
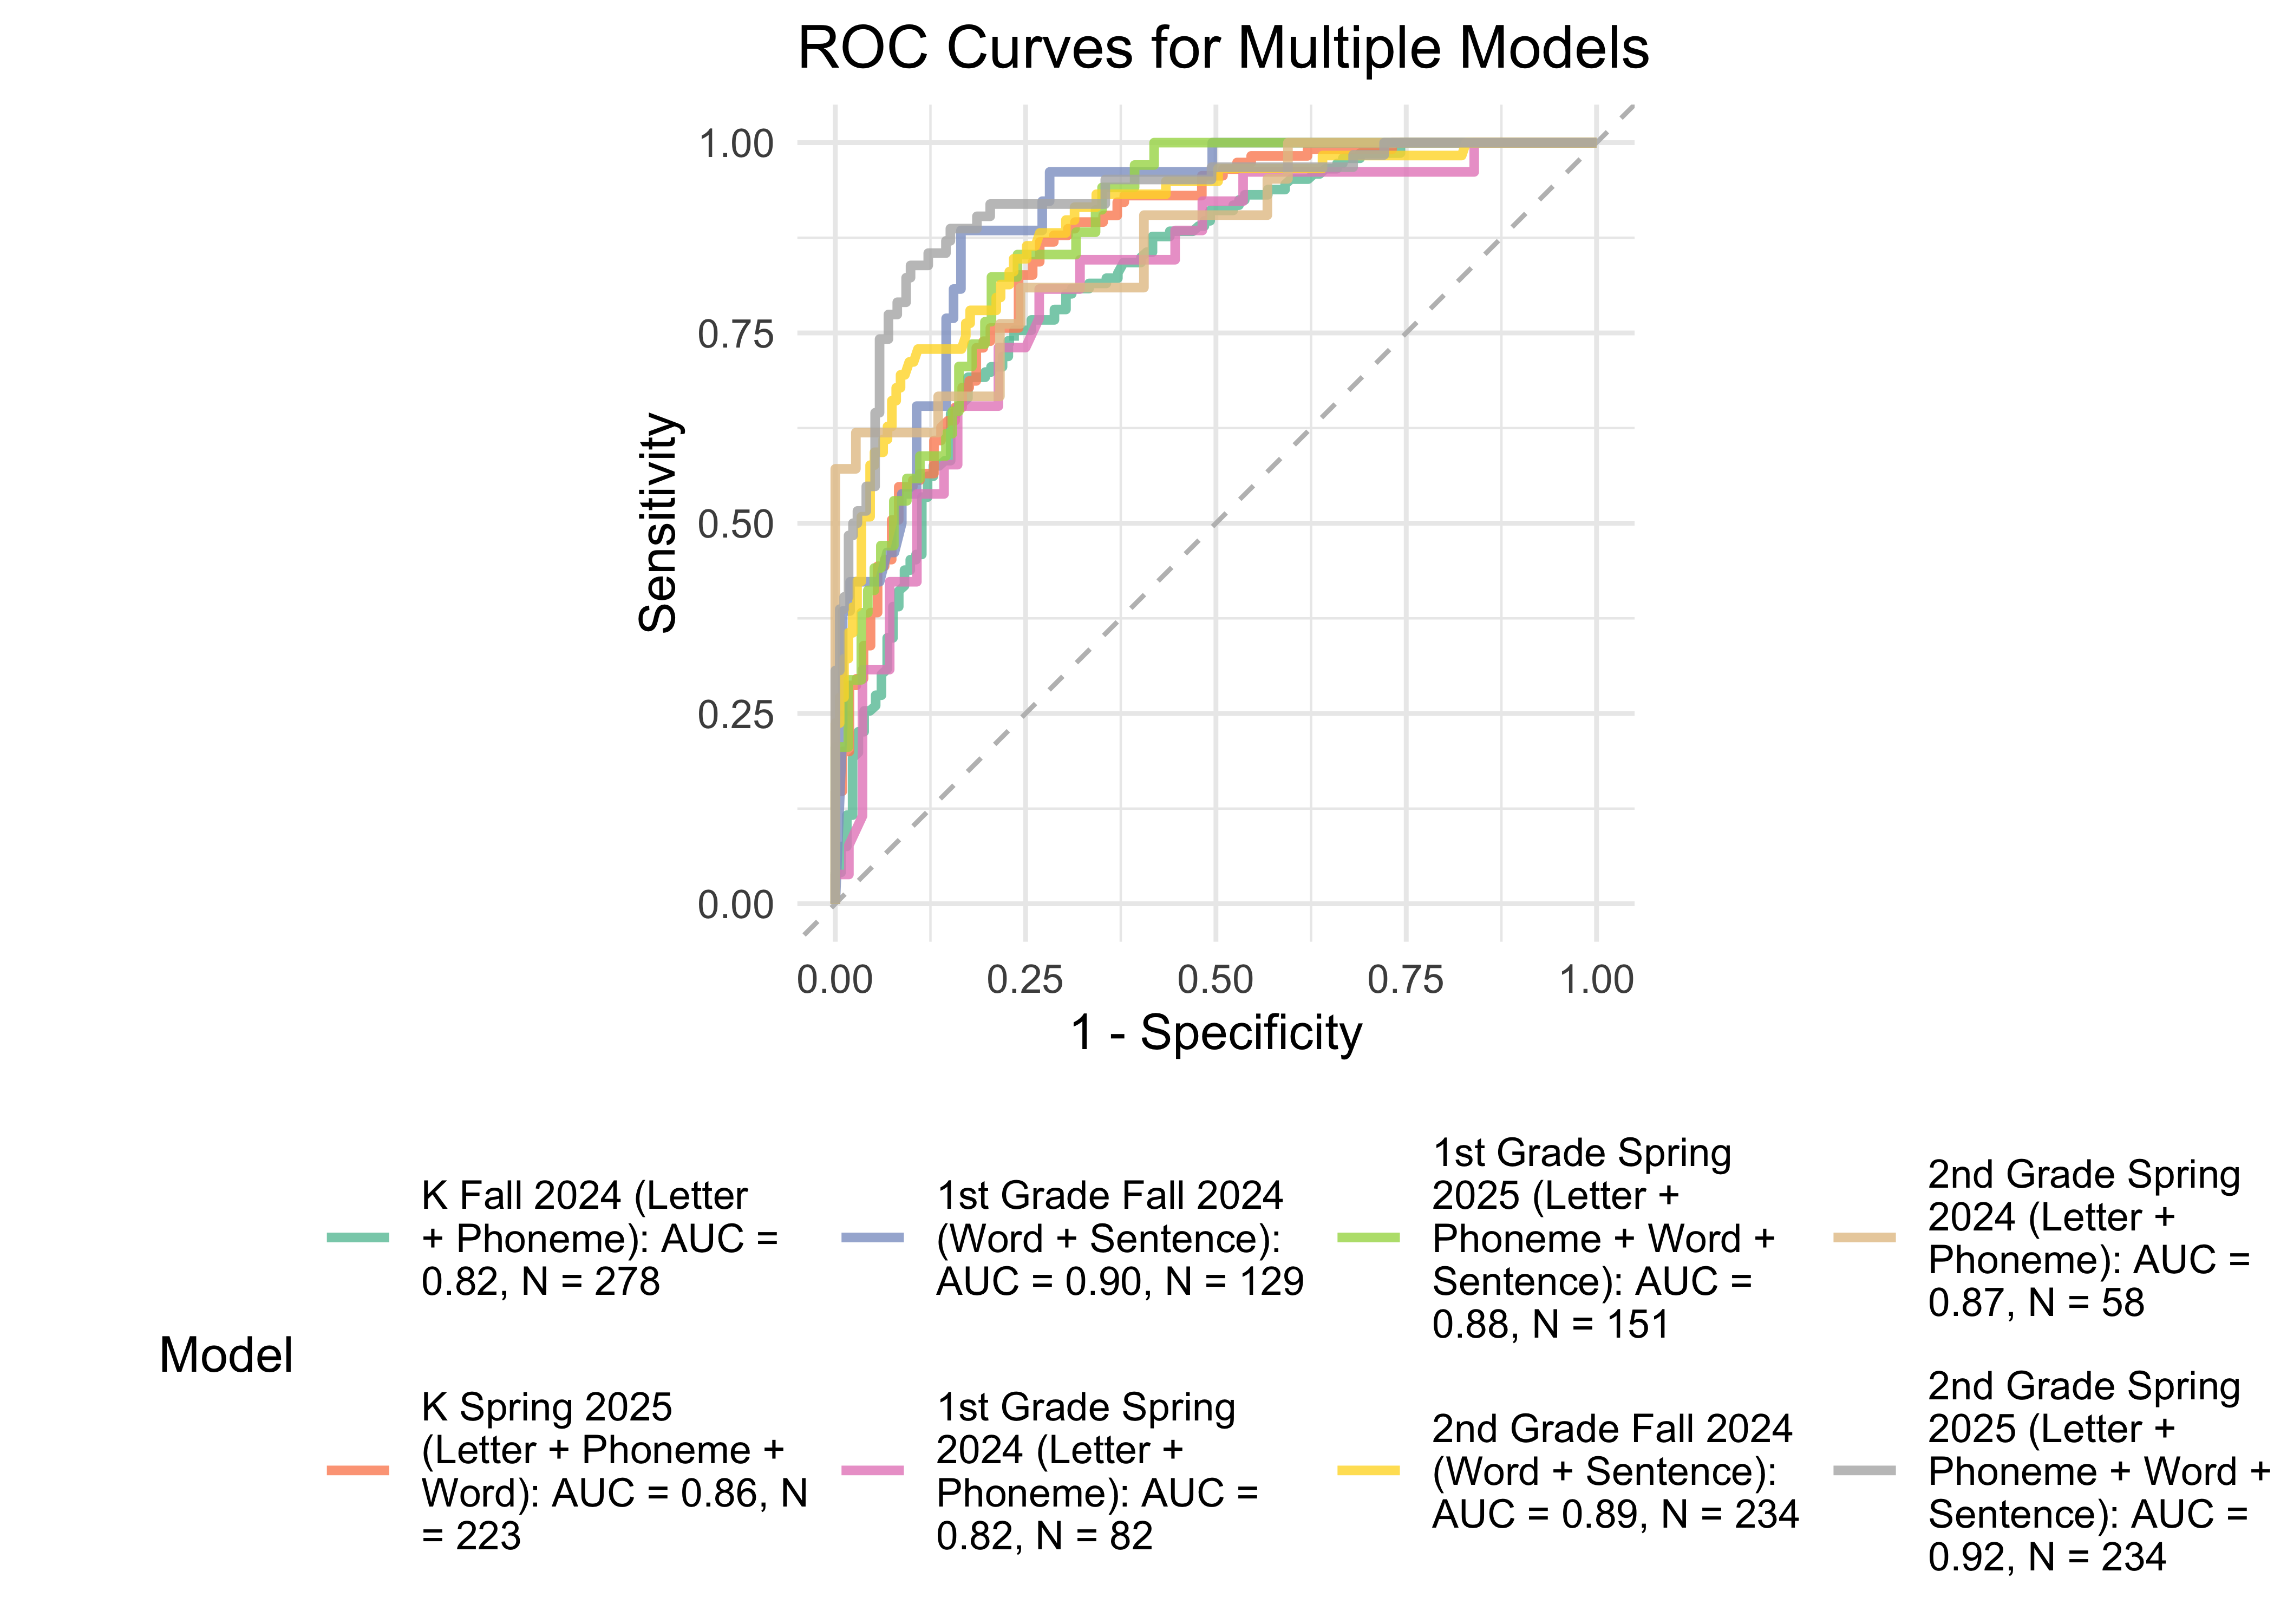
We now examine model accuracy based on a logistic regression model split across various time periods and administrations with combinations of ROAR foundational reading skills measures as predictors. Determining how models perform throughout the school year is an important step in understanding ROAR’s ability to predict students’ reading abilities and Woodcock Johnson Basic Reading Skills scores across multiple timepoints within two school years.
Figure 32.17 shows ROC curves across different grades and timepoints computed from a generalized additive model (logistic link function) with the ROAR Composite as a predictor of the Woodcock Johnson Basic Reading Skills “Some Risk” category. Throughout all seasons and grades, the ROAR Composite Score as a single predictor achieved acceptable classification accuracy (AUC => 0.82).
32.5.2 ROAR Composite within seasons
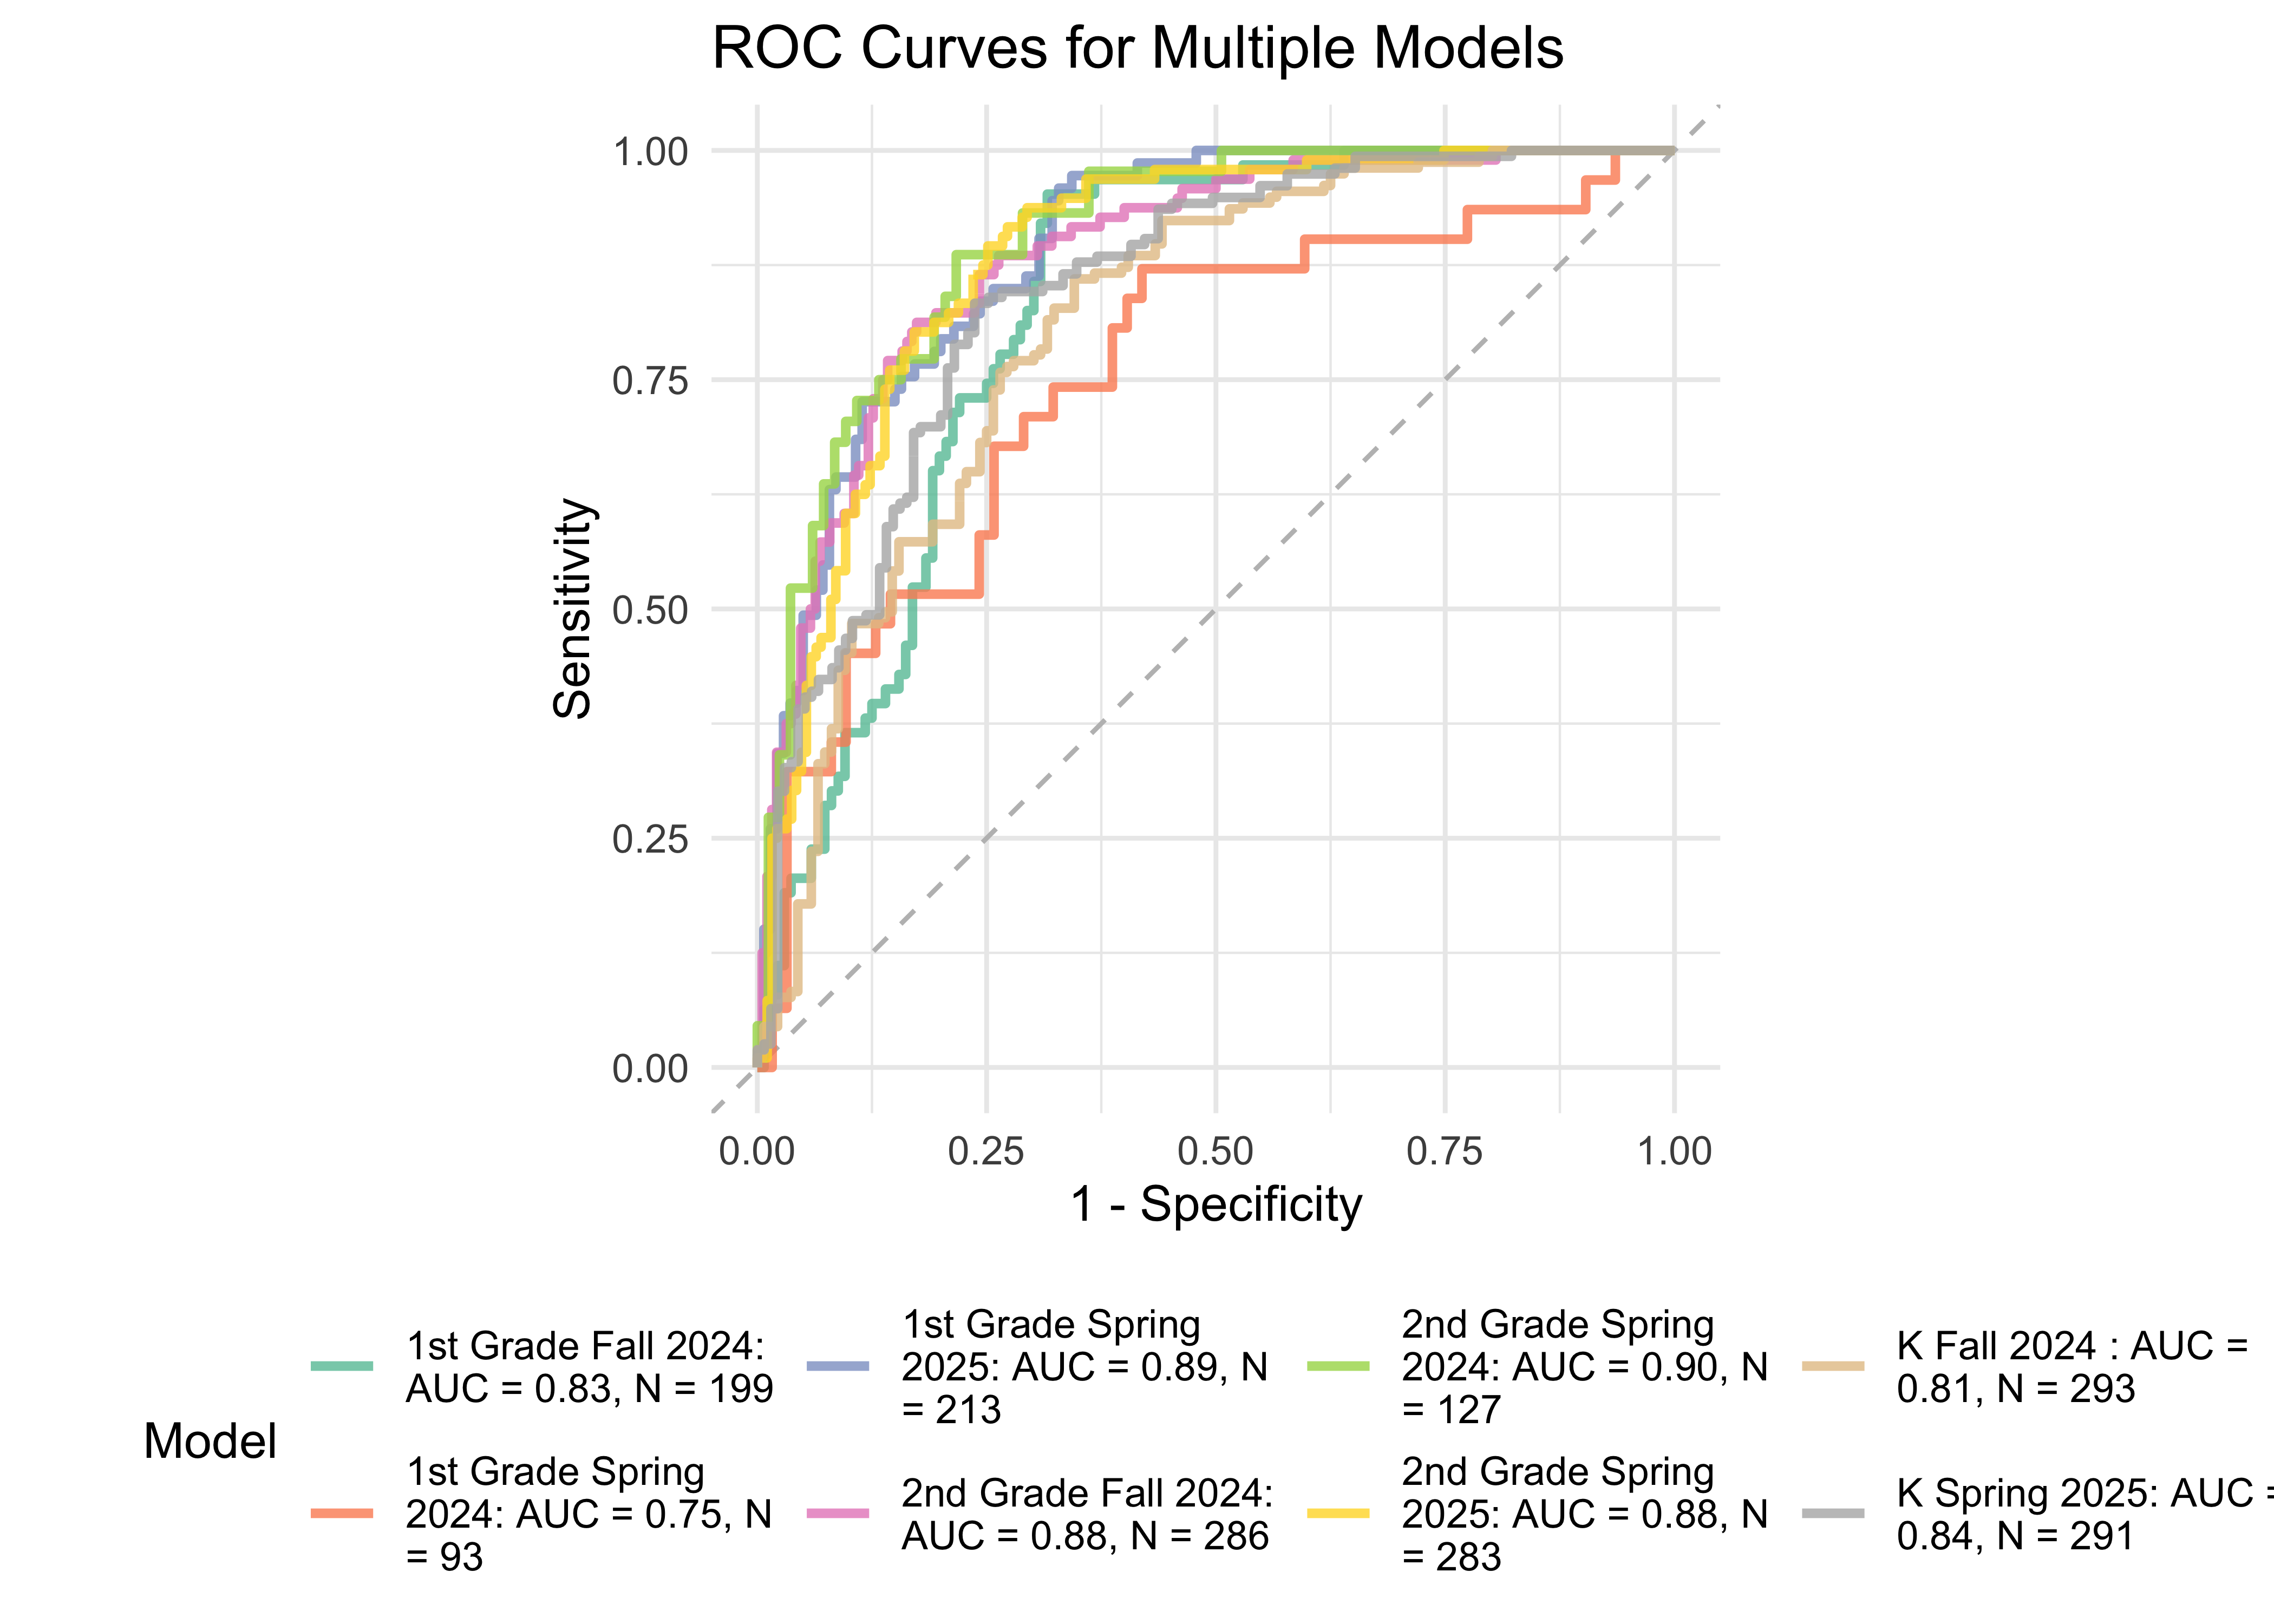
We now examine model accuracy based on a logistic regression model split across various time periods and administrations with the ROAR Composite Score as a single predictor Determining how models perform throughout the school year is an important step in understanding ROAR’s ability to predict students’ reading abilities and Woodcock Johnson Basic Reading Skills scores within a year.
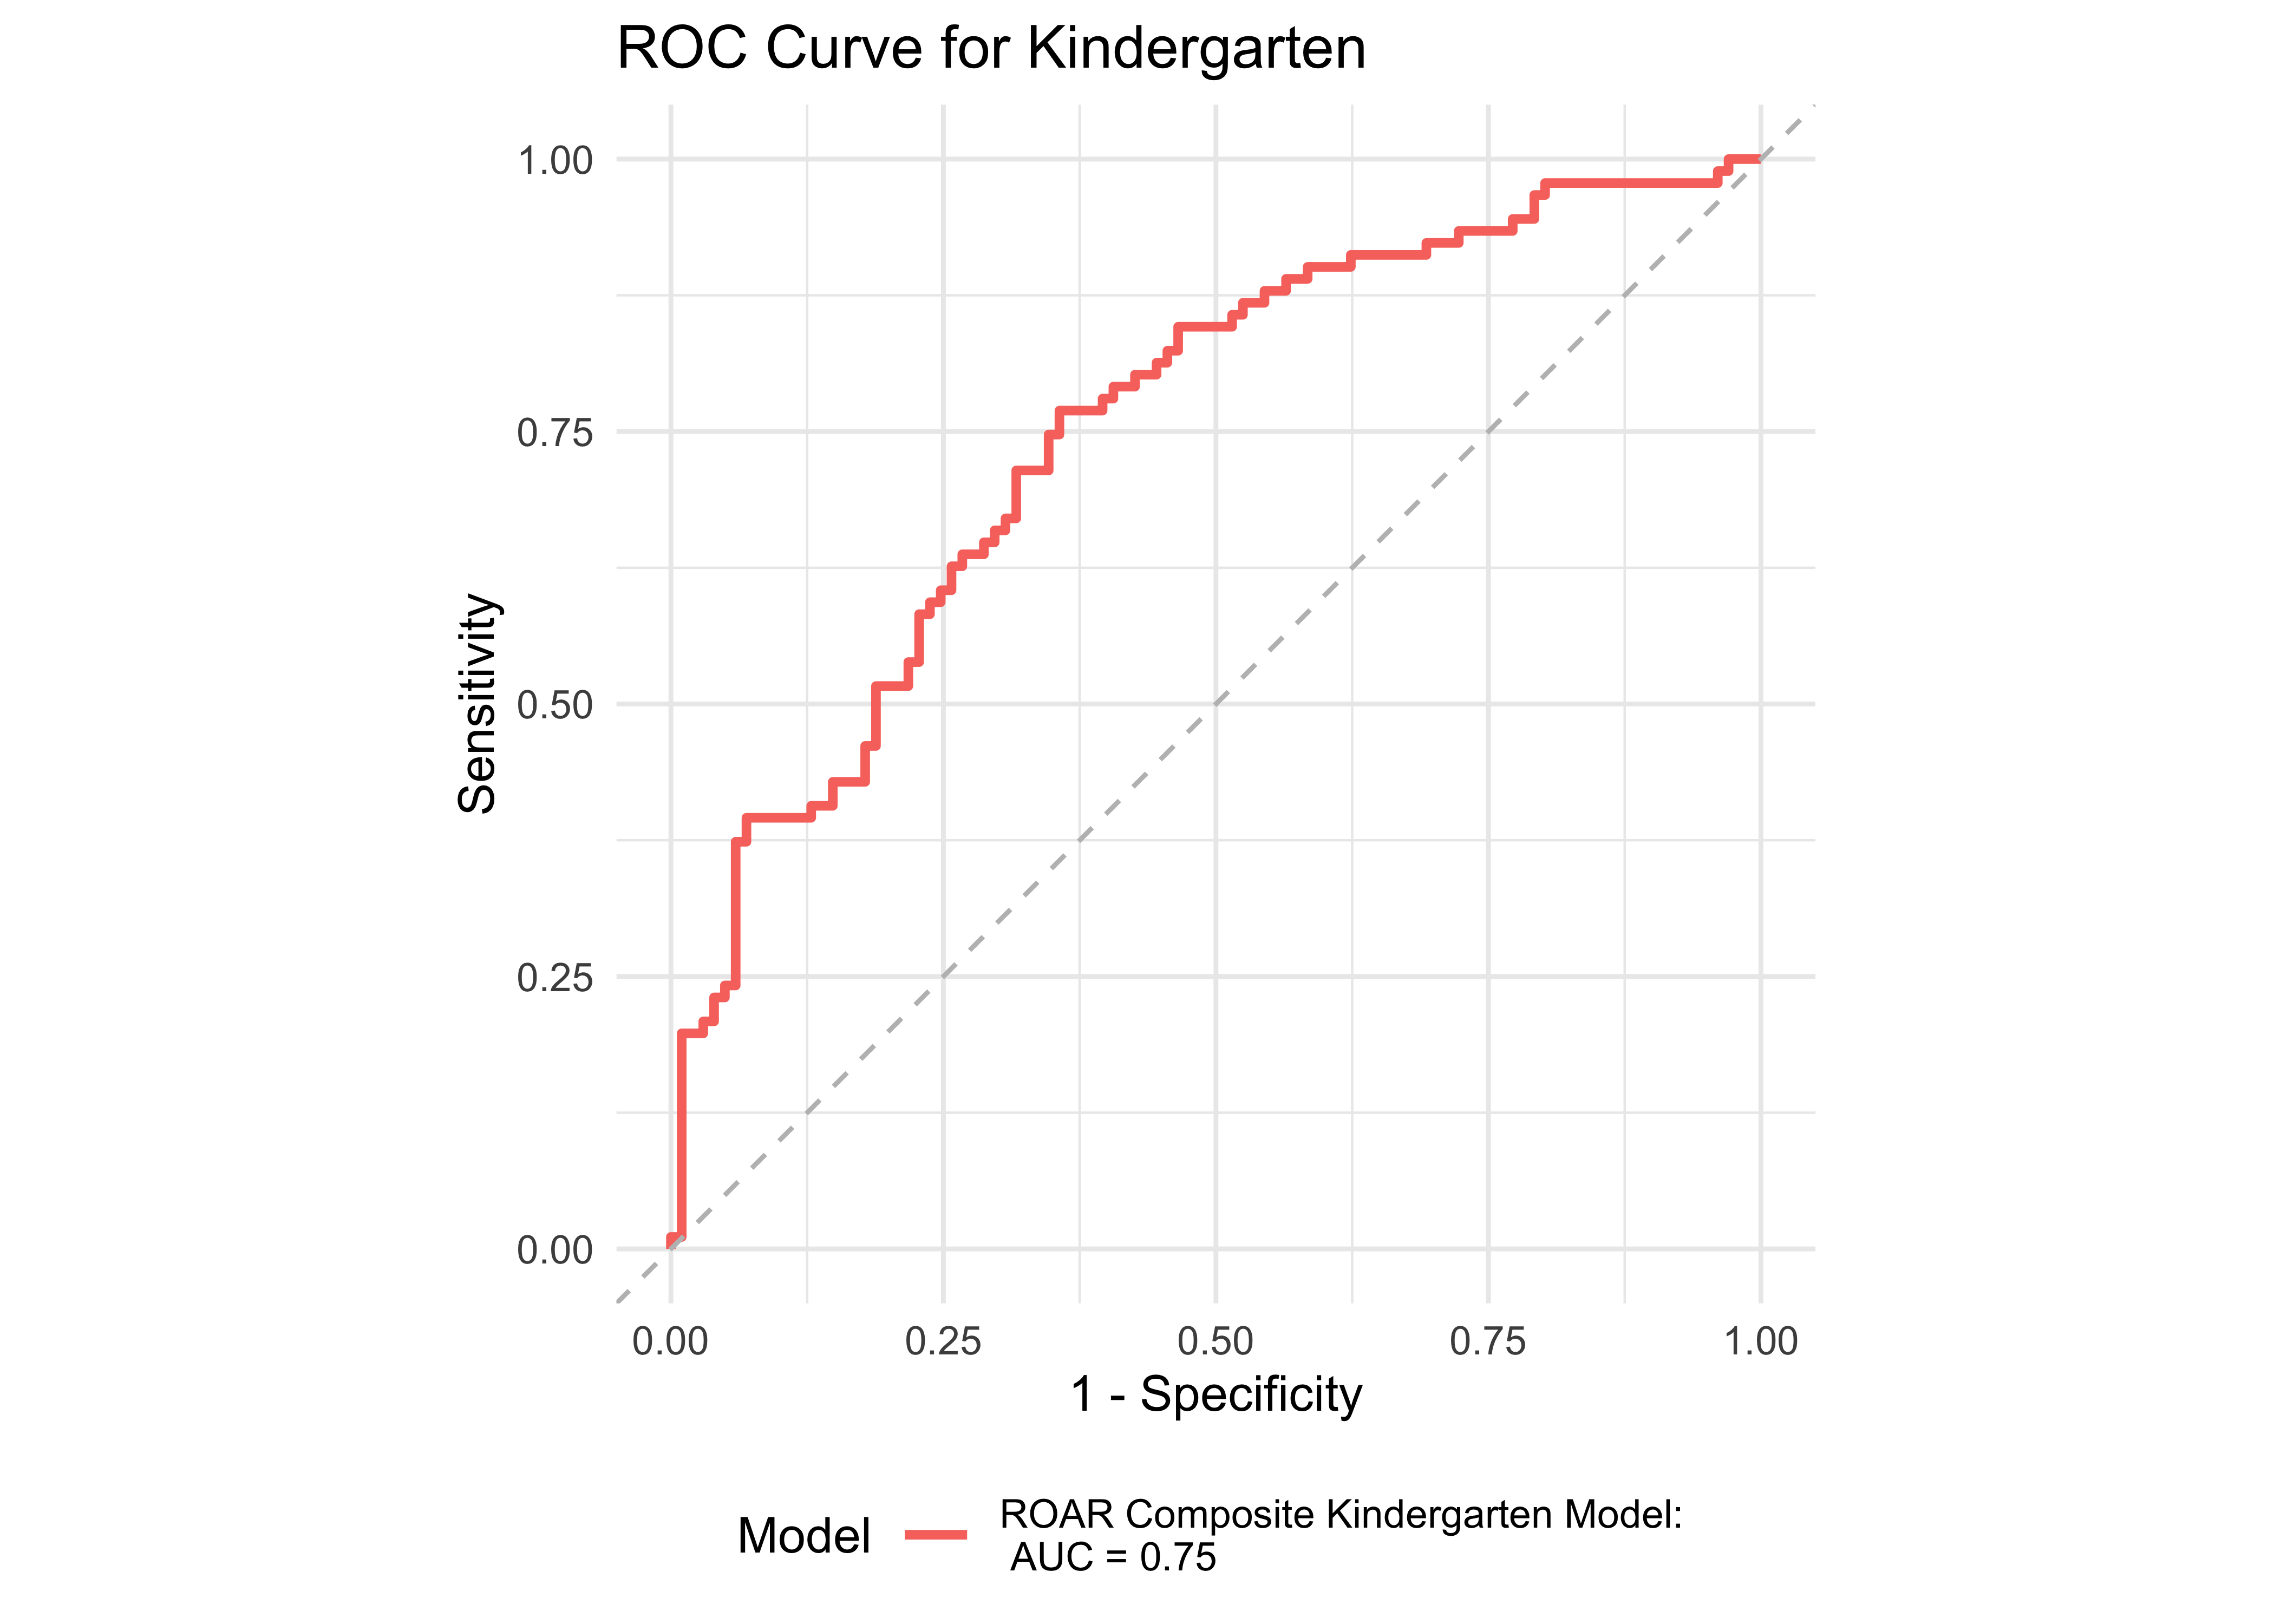
Figure 32.18 shows ROC curves across different grades and timepoints computed from a generalized additive model (logistic link function) with the ROAR Composite as a predictor of the Woodcock Johnson Basic Reading Skills “Some Risk” category. Throughout all seasons and grades, the ROAR Composite Score as a single predictor achieved acceptable classification accuracy (AUC => 0.75).
32.6 ROAR Composite Classification Accuracy Overview
| Grade | Season | AUC | N | Validation Assessments | Figure Referenced |
|---|---|---|---|---|---|
| K | Fall | 0.81 | 293 | WJ BRS | Figure 29.18 |
| K | Winter | 0.80 | 96 | WJ BRS | Figure 31.9 |
| K | Spring | 0.84 | 291 | WJ BRS | Figure 29.18 |
| 1 | Fall | 0.90 | 345 | FastBridge CBM | Figure 29.10.a |
| 1 | Winter | 0.94 | 251 | FastBridge CBM | Figure 29.10.a |
| 1 | Spring | 0.89 | 213 | WJ BRS | Figure 29.18 |
| 2 | Fall | 0.89 | 325 | FastBridge CBM | Figure 29.10.b |
| 2 | Winter | 0.90 | 225 | FastBridge CBM | Figure 29.10.b |
| 2 | Spring | 0.90 | 127 | WJ BRS | Figure 29.18 |
| 3 | Fall | 0.89 | 105 | WJ BRS | Figure 29.16 |
| 3 | Winter | 0.87 | 85 | WJ BRS | Figure 29.16 |
| 3 | Spring | 0.86 | 82 | WJ BRS | Figure 29.16 |
References
Catts, Hugh W, Nicole Patton Terry, Donald L Lonigan Christopher J and Compton, Richard K Wagner, Kelly Steacy Laura M and Farquharson, and Yaacov Petscher. 2024. “Revisiting the Definition of Dyslexia.” Annals of Dyslexia, January.
Elliott, Julian G, and Elena L Grigorenko. 2024. “Dyslexia in the Twenty-First Century: A Commentary on the IDA Definition of Dyslexia.” Annals of Dyslexia, June.
Lyon, G Reid, Sally E Shaywitz, and Bennett A Shaywitz. 2003. “A Definition of Dyslexia.” Annals of Dyslexia 53: 1–14.
Snowling, Maggie, and Charles Hulme. 2024. “Do We Really Need a New Definition of Dyslexia? A Commentary.” Annals of Dyslexia, March.
Yeatman, Jason D. 2022. “The Neurobiology of Literacy.” The Science of Reading: A Handbook, 533–55.
Yeatman, Jason D, and Alex L White. 2021. “Reading: The Confluence of Vision and Language.” Annual Review of Vision Science 7 (1): 487–517.
Youden, William J. 1950. “Index for Rating Diagnostic Tests.” Cancer 3 (1): 32–35.