Background: Published studies
Bhat et al. (2024) reported a large study (N=1,337) examining the relationship between reading skills, math skills, and phonological awareness in Spanish speaking students in Colombia. In this sample, the reported marginal reliability of ROAR-Palabra was 0.92, reliability of ROAR-Frase was 0.82, and ROAR-Fonema was 0.85.
Criteria for identifying disengaged participants and flagging unreliable scores
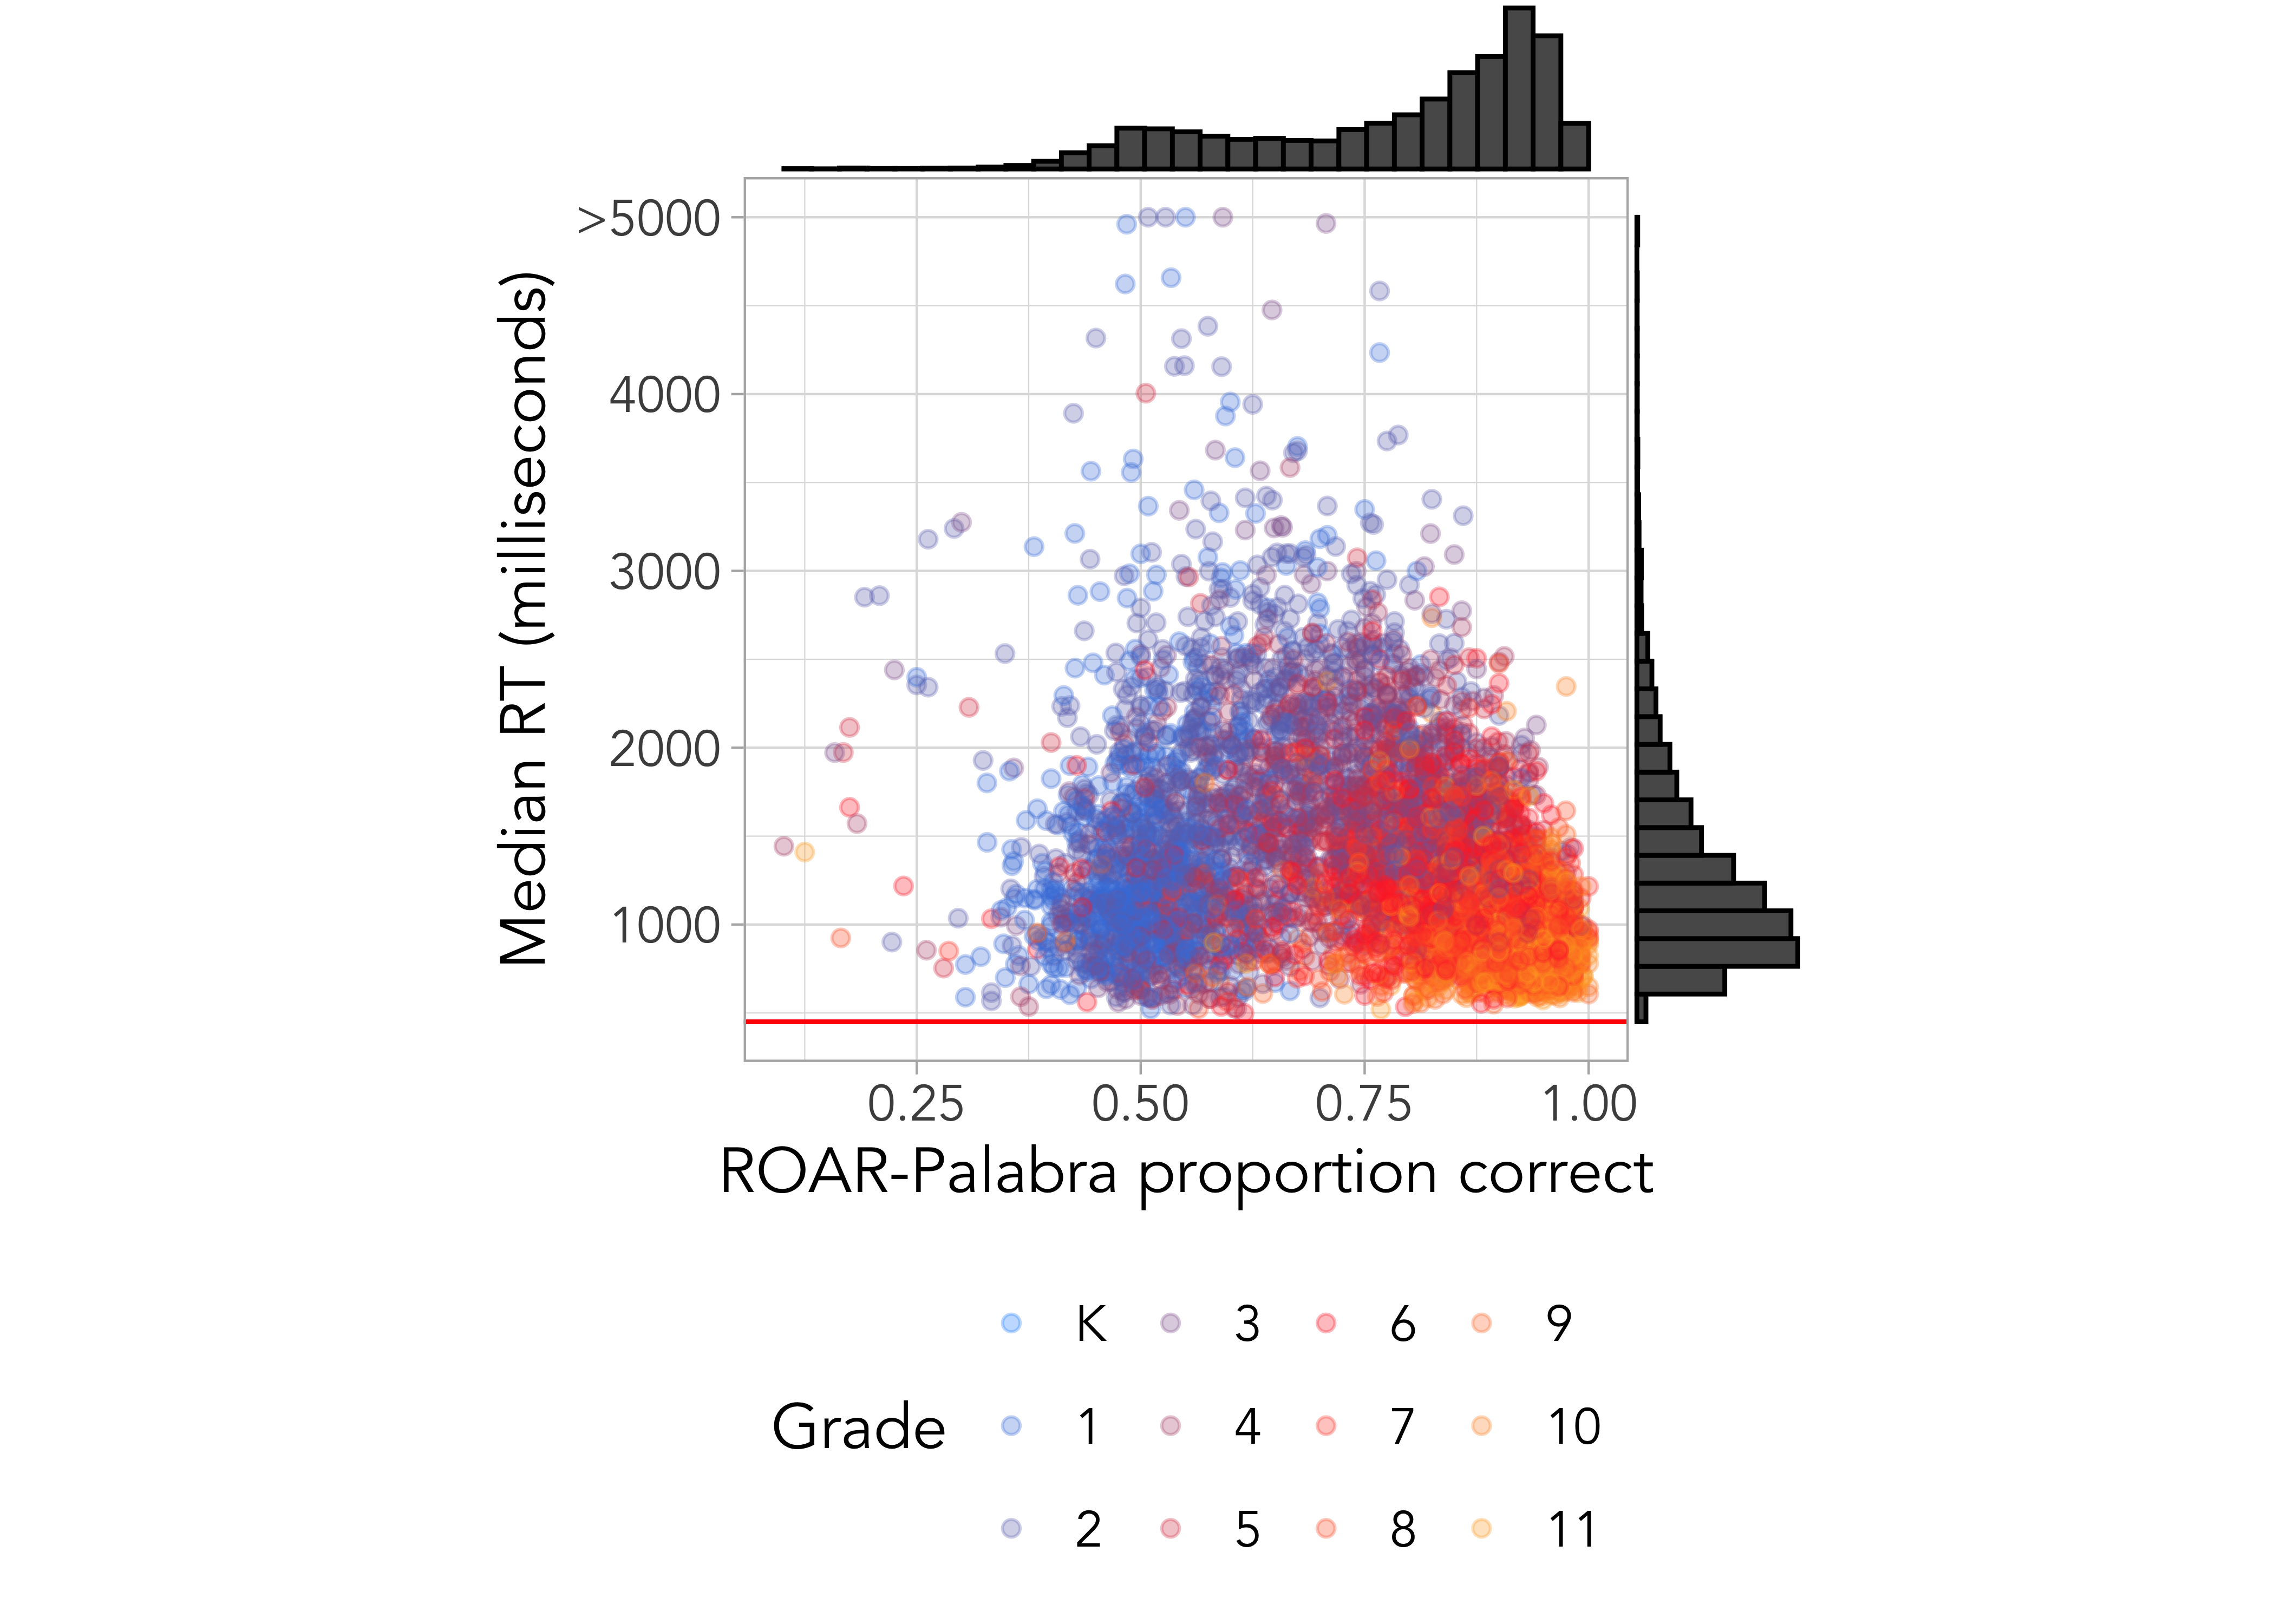
To account for unreliable scores and disengaged participation (as discussed in Chapter 17 and shown in Chapter 13), participants with a median response time <450ms are flagged in ROAR-Score reports and their data is excluded from analyses.
Reliability of fixed-length ROAR-Palabra
ROAR-Palabra runs as fixed-length test and scores are computed based on a Rasch model. The current version of ROAR-Palabra takes about 5 minutes (70 items). In the near future, a computer-adaptive version will become available leveraging the full item bank. Then, more items can be administered for a more precise measure or fewer items can be administered as a quick screener. Table 24.1 reports marginal reliability computed based on data from 6470 students under the IRT model for the standard, 70 item version of ROAR-Palabra. Reliability (\(\rho_{xx^\prime}\)) is computed based on the estimated variance of \(\hat{\theta}\) relative to the estimated standard error (\(\widehat{SE}(\hat{\theta})^2\)) using Equation 26.1:
\[
\hat{\rho}_{xx^\prime} = \frac{\widehat{VAR}(\hat{\theta})}{\widehat{VAR}(\hat{\theta}) + \widehat{SE}(\hat{\theta})^2},
\tag{24.1}\]
To ensure that ROAR-Palabra is fair and equitable for different demographic groups, we also report reliability by gender (Table 24.2), eligibility for free and reduced price lunch (Table 24.3), English learner status based on state of California designations (Table 24.4), primary langauge spoken (Table 24.5), special education (Table 24.6), ethnicity (Table 24.7), and race (@Table 24.8)
References
Bhat, Kruttika G., Alexa Mogan, Ana Saavedra, Mia Fuentes-Jimenez, Julian M. Siebert, Wanjing Anya Ma, Carrie Townley-Flores, et al. 2024.
“Shared and Unique Influences of Phonological Processing on Reading and Math.” OSF Preprints.
https://doi.org/10.31219/osf.io/em3bg.