| Characteristic | N | % |
|---|---|---|
| Gender | ||
| Female | 1770 | 33.0% |
| Male | 1978 | 36.9% |
| Grade | ||
| Kindergarten | 2829 | 52.7% |
| 1st grade | 1372 | 25.6% |
| 2nd grade | 1164 | 21.7% |
| Socioeconomic | ||
| Free or Reduced Lunch | 432 | 8.1% |
| English Learner | ||
| English Learner | 314 | 5.9% |
| Reclassified Fluent English | <50 | — |
| Initial Fluent English | 57 | 1.1% |
| English Only | 622 | 11.6% |
| Home Language | ||
| English | 740 | 13.8% |
| Spanish | 233 | 4.3% |
| Other language | <50 | — |
| Special Education | ||
| IEP / Special Education | 97 | 1.8% |
| Hispanic Ethnicity | ||
| Hispanic or Latino | 998 | 18.6% |
| Race | ||
| White | 1266 | 23.6% |
| Black or African American | 395 | 7.4% |
| Asian | 269 | 5.0% |
| American Indian or Alaska Native | <50 | — |
| Hawaiian or Other Pacific Islander | <50 | — |
| Multiracial | <50 | — |
8 Letter Sound Knowledge (ROAR-Letter)
ROAR-Letter measures knowledge of uppercase and lowercase letter names and sounds. ROAR-Letter is designed to run as a computer adaptive test (CAT) to assess where a student is on the continuum of letter sound knowledge. ROAR-Letter can also be used as a diagnostic measure to guide teaching as it returns specific information about the letter names and letter-sound correspondences that the student does and does not know.
8.1 Structure of the task
ROAR-Letter is a four alternative forced choice (4AFC) task divided into 3 blocks:
- Uppercase letter names (26 items)
- Lowercase letter names (26 items)
- Letter-sound correspondences (36 items)
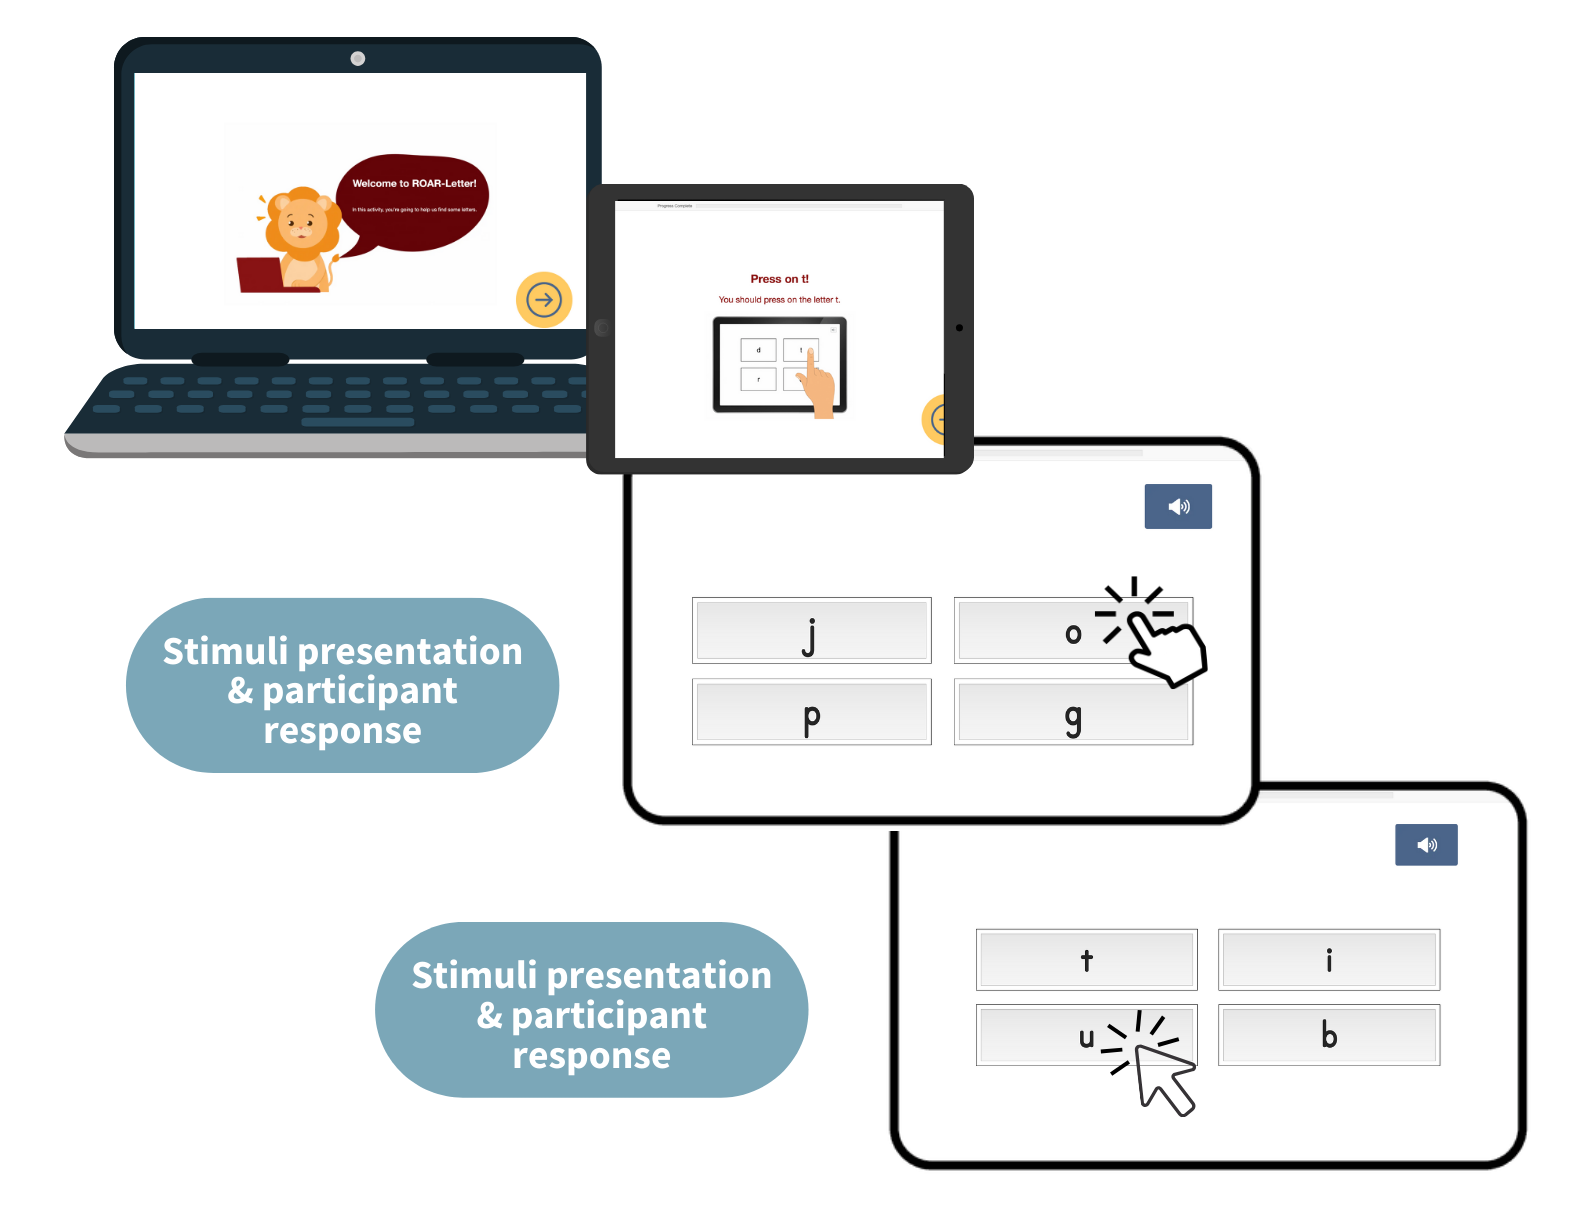
Like all ROAR measures, ROAR-Letter is lightly gamified. The task begins with instructions and practice trials with feedback until the student understands the game. Then, in each block, the student is presented with the name or sound of a letter and asked to select the correct letter from the four choices (see Figure 8.1).
8.2 IRT Model
ROAR-Letter items are calibrated using a Rasch model with a fixed guessing parameter, sometimes called the 1PL-G or Rasch-G model. Because ROAR-Letter is a four-alternative forced-choice (4AFC) task, even a student with no letter knowledge has a 25% chance of selecting the correct answer by chance. The guessing parameter \(g\) is therefore fixed to \(0.25\) rather than estimated, giving the item response function:
\[ P(X_{ij} = 1 \mid \theta_j) = g + (1 - g) \cdot \frac{\exp(\theta_j - b_i)}{1 + \exp(\theta_j - b_i)} \]
where \(\theta_j\) is the latent ability of person \(j\), \(b_i\) is the difficulty of item \(i\), and \(g = 0.25\) is the fixed lower asymptote. The discrimination parameter \(a\) is constrained to 1 across all items (the Rasch constraint), placing all items on a common interval scale. Item difficulty parameters (\(b\)) were estimated for 88 items using data from 5365 participants in kindergarten through second grade.
Table 8.1 shows the demographic characteristics of the sample used to calibrate the item parameters. Table 8.2 summarizes the characteristics of participating schools.
| N | |
|---|---|
| Median Students | 478 |
| Median Free or Reduced Lunch | 275 |
| Race/Ethnicity | |
| Median Hispanic Ethnicity | 145 |
| Median White | 93 |
| Median Black or African American | <50 |
| Median Asian | <50 |
| Median American Indian or Alaska Native | <50 |
| Median Hawaiian or Other Pacific Islander | <50 |
| Median Multiracial | 347 |
| Organization Type | |
| Public School | 12 |
| Charter School | 1 |
| Private School | 1 |
| Summer School/Tutor Program/Other | 0 |
8.3 Scoring
ROAR-Letter items are scored as correct or incorrect (dichotomous scoring) by comparing the participant’s response (mouse click/touchscreen indicating the chosen letter), to the correct answer. Each response is scored in real time. The participant’s ability or Scaled Score (\(\theta\)) on ROAR-Letter is computed based on an item response theory (IRT) model. IRT puts ability (\(\theta\)) on an interval scale meaning that Scaled Scores can be compared over time and across grades. A CAT algorithm is used to optimize the precision and efficiency of ROAR-Letter (see Chapter 20). For more information on interpreting scores see Section 5.4 and Section 3.1.
In addition to a Scaled Score, ROAR-Letter also reports the letter names and letter-sound correspondences that a participant does and does not know. This information can be used for individualizing instruction and/or creating instruction groupings.
8.4 Computer adaptive test design
ROAR-Letter was originally administered as a fixed linear form. Although scores from the full form are highly reliable (\(\hat{\alpha} = 0.97\)), this reliability comes at a cost: all 88 items are presented to every student in the same order, regardless of their actual ability level. Items that are far too easy or far too difficult for a given student contribute little to measurement precision while adding to administration time. A computer adaptive test (CAT) addresses this inefficiency directly by selecting items in real time based on each student’s responses, concentrating measurement information where it is most useful, and reducing the number of items needed to obtain a reliable score.
One important consideration when transitioning from a fixed-length form to a CAT is score reliability. The Spearman-Brown prophecy formula (Nunnally and Bernstein 1994) provides a closed-form approximation of the expected reliability for a test of any given length. This is a useful starting point for thinking about the CAT design. Following Nunnally and Bernstein (1994) and Cicchetti (1994), \(\hat{\rho}_{XX'} \geq 0.80\) is generally considered the minimum acceptable level for score reliability. In practice, this is the point at which reliability stabilizes, meaning the inclusion of additional items produce diminishing returns in precision. Applying the Spearman-Brown formula to the full 88-item form \(\hat{\alpha} = 0.97\) yields predicted reliabilities of \(\hat{\rho}_{XX'} \approx 0.86\) for a 15-item form, \(\hat{\rho}_{XX'} \approx 0.91\) for a 20-item form, and \(\hat{\rho}_{XX'} \approx 0.93\) for a 25-item form. All three lengths comfortably exceed the 0.80 criterion, and the gains in predicted reliability diminish as length increases.
Another consideration for the CAT design is content balancing. ROAR-Letter items span three categories: lowercase letter names, uppercase letter names, and letter-sound correspondences. The difficulty range for lowercase and uppercase letter names items is comparable, while letter-sound items are more difficult. From a psychometric standpoint, if the construct is unidimensional, an unconstrained CAT is permissible. That said, there may be value to requiring items from each category - particularly for students in the tails of the distribution - as long as this does not introduce bias into the estimates of student ability.
To evaluate the trade-offs with test length and content coverage, we used simulation to examine the impact on ability estimates and score reliability under six CAT designs: three test lengths (15, 20, and 25 items) crossed with two item-selection conditions (unconstrained and content-balanced). The simulation was restricted to students who completed all 88 items, so that every possible CAT administration could be replayed using each student’s observed responses. Item selection was implemented with catR using maximum Fisher information (MFI) with randomesque exposure control (the next item was drawn uniformly from the three most informative candidates). In the content-balanced condition, a minimum of five items was required from each of the three content domains before the algorithm was free to select items without restriction. The first item was selected from the three items whose calibrated difficulty was closest to the student’s full-bank EAP theta — emulating an informed teacher who has some sense of where to start a student on the test, rather than cold-starting from a provisional ability of \(\theta = 0\) (which on this negatively-skewed bank would otherwise land on the hardest items first). Interim ability estimates used weighted likelihood (WL) scoring (Warm 1989) to support item selection, and the CAT score reported for each simulated administration was the EAP estimate computed from the administered items — matching the estimator used for the full-bank reference score. The EAP estimator used a standard normal prior and a theta range of \([-6, 6]\). The outcomes of interest were empirical reliability and estimation bias relative to each student’s full-bank EAP estimate from the complete 88-item form.
Table 8.3 shows the empirical reliability, the correlation between the CAT estimates and the full-bank estimates, and the mean bias for each simulation condition. As expected, the reliability increases as the number of items increases; the empirical reliabilities are also notably higher than the 0.80 criterion. The correlations are quite high, indicating that the results of a CAT would be very similar to the scores students receive from the complete form. The mean bias is low for all simulation conditions, for both the unconstrained and content-balanced designs. Based on these results, the use of a 25-item CAT should provide reliable estimates of ROAR-Letter ability. While content balancing does not appear to be strictly necessary from a psychometric standpoint, it remains useful for supporting instructional reporting about the letter names and letter-sound correspondences that a participant does and does not know.
| Items | Selection | N | Empirical Reliability | 95% CI | r (CAT vs ref) | Mean bias |
|---|---|---|---|---|---|---|
| 15 items | Unconstrained | 1171 | 0.824 | 0.81 to 0.83 | 0.946 | 0.104 |
| 15 items | Content-balanced | 1171 | 0.801 | 0.79 to 0.81 | 0.936 | 0.134 |
| 20 items | Unconstrained | 1171 | 0.862 | 0.85 to 0.87 | 0.956 | 0.063 |
| 20 items | Content-balanced | 1171 | 0.851 | 0.84 to 0.86 | 0.957 | 0.057 |
| 25 items | Unconstrained | 1171 | 0.885 | 0.88 to 0.89 | 0.966 | 0.023 |
| 25 items | Content-balanced | 1171 | 0.880 | 0.87 to 0.89 | 0.970 | 0.024 |
References
Cicchetti, Domenic V. 1994. “Guidelines, Criteria, and Rules of Thumb for Evaluating Normed and Standardized Assessment Instruments in Psychology.” Psychological Assessment 6 (4): 284–90. https://doi.org/10.1037/1040-3590.6.4.284.
Nunnally, Jum C., and Ira H. Bernstein. 1994. Psychometric Theory. 3rd ed. New York: McGraw-Hill.
Warm, Thomas A. 1989. “Weighted Likelihood Estimation of Ability in Item Response Theory.” Psychometrika 54 (3): 427–50. https://doi.org/10.1007/BF02294627.