| Proportion correct | |
|---|---|
| V | 0.84 |
| B | 0.85 |
| E | 0.85 |
| H | 0.85 |
| K | 0.85 |
| G | 0.86 |
| P | 0.86 |
| I | 0.87 |
| L | 0.87 |
| N | 0.87 |
| T | 0.87 |
| D | 0.88 |
| J | 0.88 |
| R | 0.88 |
| U | 0.88 |
| C | 0.89 |
| F | 0.89 |
| M | 0.89 |
| Q | 0.89 |
| S | 0.89 |
| Y | 0.89 |
| Z | 0.90 |
| W | 0.91 |
| A | 0.92 |
| O | 0.92 |
| X | 0.92 |
11 Rapid Automatized Naming (ROAR-RAN)
11.1 Structure of the task, administration and scoring
ROAR-RAN is the only ROAR measure that requires verbal responses. Thus, ROAR-RAN has unique considerations for administration and scoring. Whereas all other ROAR measures are specifically designed and validated to produce accurate and reliable results in a large group setting (e.g., a classroom) where dozens (or hundreds) of students are silently completing ROAR assessments at the same time, we recommend that students taking ROAR-RAN are provided a quiet and private space. Even though the automated scoring algorithm implemented in ROAR-RAN can filter out background noise and accurately score ROAR-RAN in a group administration setting, the distraction of hearing other, nearby students rapidly naming the RAN stimuli might affect the validity of scores. This concern is not specific to ROAR-RAN and will be an issue for any group-administered measure that requires verbal responses. This is not an issue for other ROAR assessments because all other ROAR assessments are completed silently, with student responses recorded via the keyboard, mouse, or touchscreen.
RAN is specifically designed to measure naming speed. Since speed is the fundamental unit of the measure, and since naming must be done out loud, it is important that participants are in a space where they can speak rapidly and without distraction while taking ROAR-RAN. Figure 11.1 depicts ROAR-RAN.
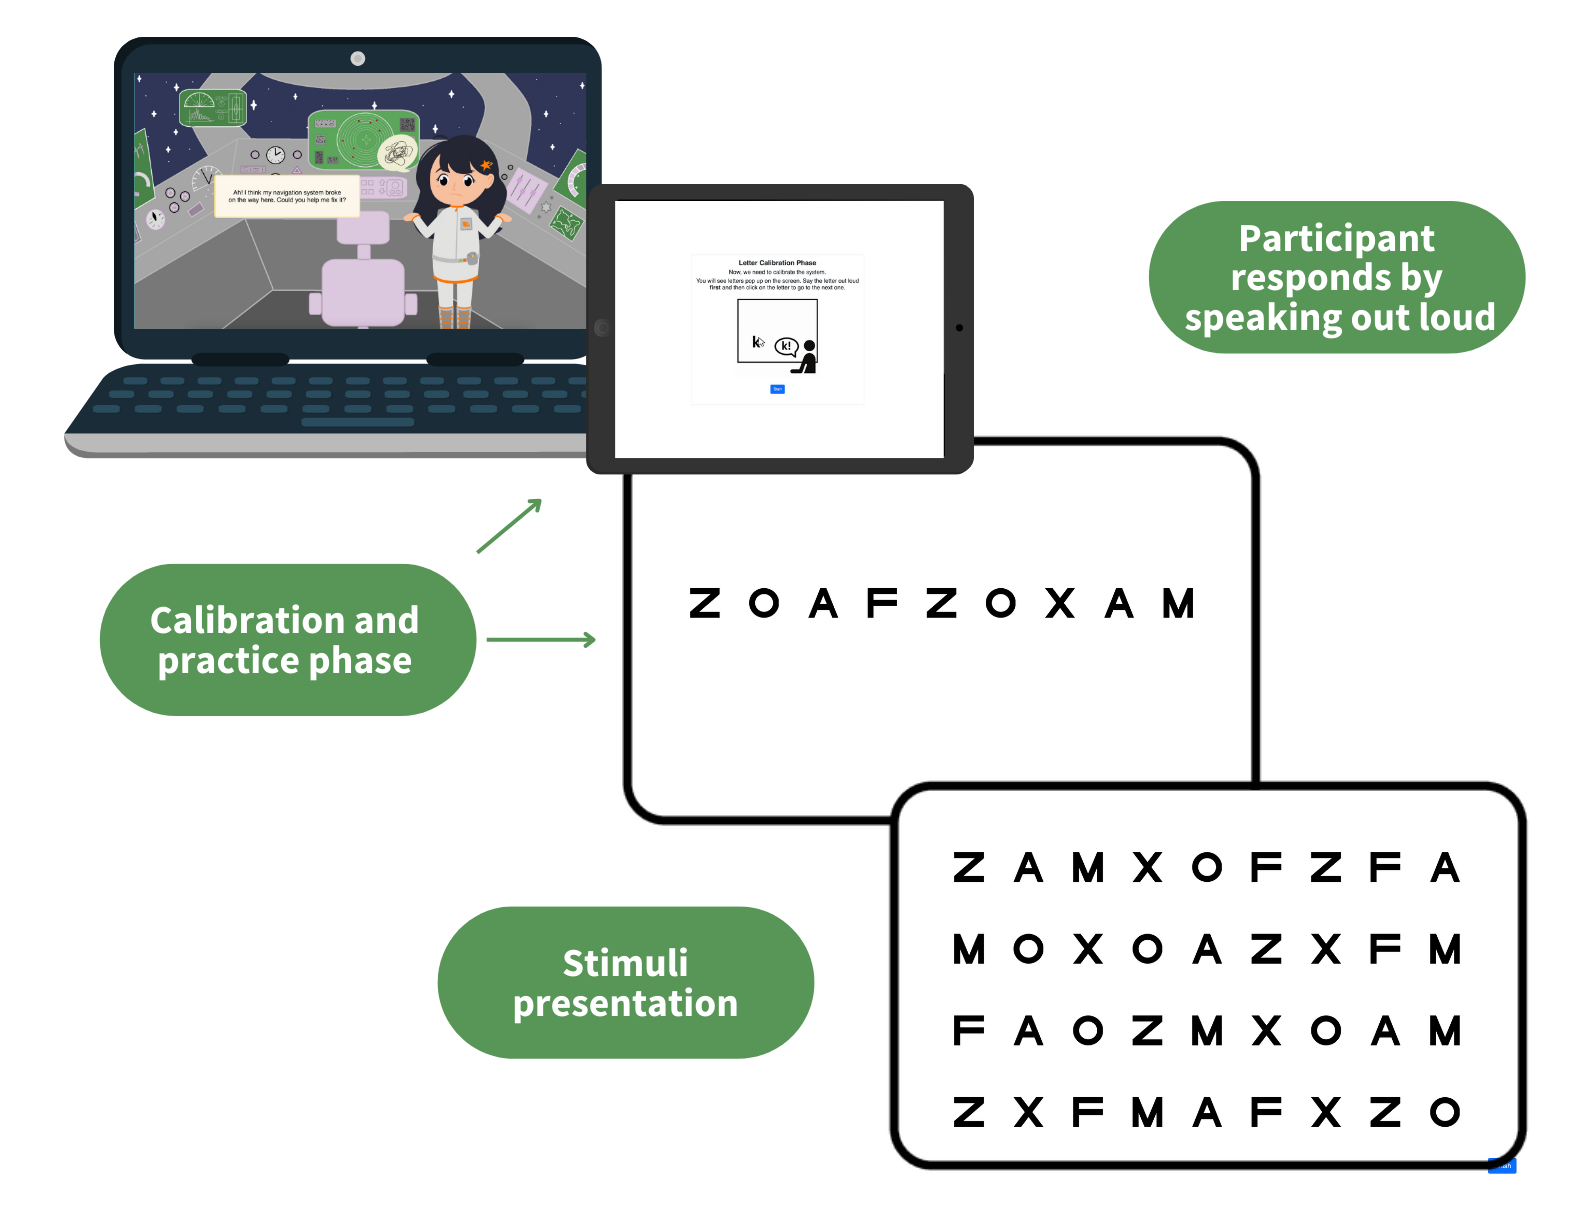
Similar to other ROAR measures, RAN is scored automatically and instructions are narrated by characters in a game-like setting. RAN does not require a test administrator to administer or score the assessment, though young students might need some monitoring in order to stay focused on the task or troubleshoot their device’s microphone. Previous work has validated the use of a digitized, online version of RAN for dyslexia screening (Kim et al. 2024).
To prepare for ROAR-RAN, students should be in a private space where they can speak out loud without distractions. Akin to other ROAR measures, students log in to the dashboard and click to launch the ROAR-RAN assessment. Upon launch, a character will narrate the instructions. The participant will first be cued to name each individual item—letters or numbers. This serves as a check to ensure that the participant knows the name of each item, and the interaction calibrates the devices microphone for audio recording. After the quick calibration phase, the participant is then instructed to name all the items they are about to see in sequence as quickly as possible. A countdown indicates the beginning of the measure, the stimuli are presented, and the participant’s responses are recorded through the microphone. ROAR-RAN can optionally connect to the webcam to track the participant’s gaze to allow the speech data to be co-registered to the item the participant is looking at on the screen, allowing for more precise scoring. If the webcam is enabled for eye-tracking in school settings, absolutely no video data is saved and the webcam is deactivated as soon as the students complete the assessment.
11.2 Scoring RAN
The primary outcome measure of RAN is time, more specifically, the time elapsed between when a participant starts to name the first item in the stimulus array and when they finish naming the last item in the array. Because automaticity encapsulates both speed and accuracy, however, scoring RAN assessments also involves tracking participant errors. Potential sources of error include: skipping an item, incorrectly naming items, and introducing non-word sounds. If an individual commits 4 or more errors within a single stimulus set, that score is deemed invalid. In the context of ROAR-RAN, there are additional audio quality metrics that impact whether a score is valid or not. Because these recordings are captured on student devices, often in the context of noisy classroom environments, several aspects of a recording, including background noise, static, interruptions, and truncated or inaudible audio, can also lead to an invalid or unreliable score.
Because scoring RAN assessments by hand can be time intensive, ROAR-RAN is scored automatically by an automated scoring algorithm (see Section 11.3). The algorithm processes the speech data and records the timestamp and duration for each spoken item, measuring both the speed and accuracy of the participant’s responses. The algorithm also evaluates the speech recordings for various quality issues such as excessive background noise, static, interruptions, off-task speech, and excessive errors. If any of these issues is detected by the algorithm, the score is flagged as invalid. For valid tests, the system calculates the total time taken to complete the task by recording the timestamp of the participant’s response to the first symbol and the timestamp of their response to the last symbol. This total duration, measured in seconds, is then reported as the participant’s score on the ROAR-RAN assessment (see Chapter 23 for validation of the scoring algorithm).
A Microphone is Required for ROAR-RAN
Since RAN is fundamentally about naming, it is the only ROAR assessment that requires a microphone. Responses are recorded, securely stored, scored with an algorithm, and scores are displayed in the ROAR score report. Optionally, the devices webcam can be enabled during the administration of RAN to further improve the precision of the autoscoring algorithm. When using the webcam to perform eye-tracking in classroom settings, absolutely no video data is stored by the assessment. Researchers working in laboratory settings can configure the assessment to store video data but this option is not available for classroom-based assessments.
11.2.1 ROAR-RAN stimuli
We designed both RAN-Letter and RAN-Number to mirror the stimulus items used in the original implementation of RAN (Denckla and Rudel 1976; Wolf and Denckla 2005). For both formats, stimulus arrays consist of 5 unique items, each repeating 10 times, for a total of 50 items arranged in a 5 by 10 item stimulus array. For RAN-Letter, stimulus arrays consist of the characters A, D, L, R, S and for RAN-Number, stimulus arrays consist of 2, 4, 6, 7, 9.
Additionally, for each format, RAN presents one of 20 candidate arrays. Each candidate array has been designed to satisfy certain conditions, including each item appears 5 times, items do not repeat across adjacent locations, and item “chunks” of 4 items or fewer do not repeat. Each time the app runs, one of the candidate arrays is randomly selected and displayed on the screen, thereby reducing the likelihood of stimulus-related confounds while also minimizing the chances that a user repeatedly interacts with the same stimulus array across multiple sessions.
RAN is intended to measure naming that is “automatized”. To validate our choice of stimuli for RAN-Letters we assessed knowledge of upper case letter names in 4,022 kindergarten and first grade students and calculated the proportion of students that knew the name of each upper case letter name (see Table 11.1). For the RAN-Letter stimuli, we observe an accuracy of 0.88 or greater for all our letter stimuli, suggesting that our choice of items is appropriate to measure automatized naming.
Knowledge of upper case letter names
11.3 ROAR-RAN autoscoring and reliability algorithm
11.3.1 Autoscoring
The autoscoring algorithm uses the wav2vec2-base-960h model (Baevski et al. 2020) speech recognition model to automatically score RAN recordings. This model is trained on 960 hours of speech data and specializes in transcribing individual letters from audio recordings. These character level estimates are concatenated to produce an estimated transcript of the input audio recording. For recordings of RAN-Number, we also apply post-processing steps to convert the model’s raw character output to strings of Arabic numerals (i.e S-I-X-F-O-U-R becomes 6-4). In addition to character level estimates of speech transcription, this model also produces estimated timestamps of when each character was said during a recording. We subtract the estimated timestamp of the first character from that of the last character to produce a RAN score.
11.3.2 Audio reliability
To estimate the quality of the audio recordings, and subsequent reliability of the estimated RAN score for each recording, we trained a convolutional neural network on the raw audio recordings. This CNN consisted of four convolutional blocks followed by three fully-connected layers. Each convolutional block consisted of a 2D convolution layer with 3×3 kernels and same-padding, batch normalization, ReLU activation, and 2×2 max pooling. The number of feature maps progressively increased across blocks from 32 to 64, 128, and 256 channels, respectively.
The four convolutional blocks were followed by an adaptive average pooling layer to reduce the spatial dimensions to a fixed 4×4 grid and ensure consistent dimensionality regardless of input spectrogram length. The resulting 4,096-dimensional feature vector was then flattened and passed through two fully connected layers with 512 and 128 hidden units, respectively, and a final output binary output layer. Dropout regularization (p=0.3) and ReLU activation was applied after each hidden layer.
Before being passed into the network, raw audio files were loaded and resampled to a target sampling rate of 8 kHz. Multi-channel recordings were converted to mono by averaging across channels. To ensure uniform input dimensions, audio segments were either zero-padded or truncated to a fixed maximum length of 480,000 samples (60 seconds at 8 kHz). During training, segments exceeding the maximum length were truncated, while during inference, longer segments were preserved and only padded if necessary to meet minimum length requirements.
After resampling, mel-spectrogram representations were computed from the resampled waveforms using a Short-Time Fourier Transform (STFT) with an FFT window size of 500 samples and hop length of 256 samples. The resulting spectrograms were transformed to the mel-scale using 128 mel filterbanks spanning the frequency range of the 8 kHz audio. Power spectrograms were converted to decibel scale using amplitude-to-dB transformation to compress the dynamic range and emphasize perceptually relevant features. For training data, basic augmentation was applied with 50% probability, applying random gain modulation (scaling factor between 0.8 and 1.2) to improve model robustness to volume variations. This preprocessing pipeline produced 128×1876 dimensional mel-spectrogram inputs that served as the feature set for model training and evaluation.
The model was trained for 50 epochs using the ADAM optimizer with a learning rate of 0.001 and weight decay of 0.0001 to minimize binary cross-entropy loss. We implemented early stopping so that training stopped after 10 consecutive epochs where the loss did not improve. After identifying the best set of model weights, we then tuned the cutoff probabilities for labeling a recording as reliable or not. Because the consequences of false positives greatly outweigh those of false negatives, we tuned our probability thresholds to target a precision of 0.98 in the validation set.
11.3.3 Score reliability
Although most unreliable audio recordings and scores were detected by our audio reliability model, there are still cases where the ASR model fails to generate accurate transcripts, even on recordings with high audio quality. These cases largely occur when the speaker is difficult to hear (although still audible to human listeners), the recording is longer, or when the student commits a number of errors when completing the assessment.
To account for these cases, we used string-distance metrics between the ASR generated transcript and expected ground truth to train an XGBoost classifier (Chen and Guestrin 2016) predicting whether the prediction error from the ASR model is greater than 15 seconds. From the ASR transcripts and ground truth stimuli, for each recording we computed several string-distance metrics, including: Levenshtein Distance, Character Error Rate, Jaro Distance, Longest Common Substring Ratio, Jaro Distance, Length Difference, as well as their interactions. The XGBoost model was trained using Bayesian optimization to determine the optimal set of hyperparameters. We performed 5-fold cross-validation across 150 candidate hyperparameter sets, using the results of each iteration to update the next set of hyperparameter candidates.
11.3.4 Combining audio and score reliability
After training our audio and score reliability models, we then identify the thresholds in the joint probability distribution of a recording having high quality audio and a high quality score. To do this, we identified the probability thresholds for both good audio and good score that maximized the correlation between the predicted and observed RAN scores in the training set. From these candidate threshold pairs, we then selected the pair that resulted in the highest correlation in the validation set to be used as our cutoffs in our deployed model. If the probability of a recording having both high quality audio and a high quality score, as output by the audio reliability CNN and XGBoost models respectively, are above these thresholds, the recording will be labelled as reliable. If either one of these probabilities fails to meet these thresholds, the recording will be flagged as unreliable.
References
Baevski, Alexei, Yuhao Zhou, Abdelrahman Mohamed, and Michael Auli. 2020. “Wav2vec 2.0: A Framework for Self-Supervised Learning of Speech Representations.” Advances in Neural Information Processing Systems 33: 12449–60.
Chen, Tianqi, and Carlos Guestrin. 2016. “Xgboost: A Scalable Tree Boosting System.” In Proceedings of the 22nd Acm Sigkdd International Conference on Knowledge Discovery and Data Mining, 785–94.
Denckla, Martha Bridge, and Rita G Rudel. 1976. “Naming of Object-Drawings by Dyslexic and Other Learning Disabled Children.” Brain and Language 3 (1): 1–15.
Kim, Sohyun An, Rebecca Gotlieb, Laura V Rhinehart, Veronica Pedroza, and Maryanne Wolf. 2024. “A Validity Study of the Digitized Version of the Rapid Automatized Naming Test.” Journal of Psychoeducational Assessment 42 (3): 357–65.
Wolf, Maryanne, and Martha Bridge Denckla. 2005. RAN/RAS: Rapid Automatized Naming and Rapid Alternating Stimulus Tests. Pro-ed Austin, TX.