23 Reliability and Validity of ROAR Rapid Automatized Naming (ROAR-RAN)
Reliability and evidence of construct validity was assessed based on correlations among scores across RAN-Letters and RAN-Numbers. The assessment of reliability was conducted by measuring the reliability of the automated scoring system relative to the manual scoring method and computing the split-half reliability using the timestamp estimates produced by the automated scoring pipeline. Convergent validity was assessed by examining the correlation between RAN-Letters and RAN-Numbers and concurrent validity was assessed by computing the correlation between the two RAN measures and the core ROAR reading measures.
23.1 Sample Overview and Model Training
To train and evaluate the RAN automated scoring system, we used 1340 audio recordings from 659 participants who completed RAN. Of these particpants who completed RAN, 398 also completed some combination of ROAR-Phoneme, ROAR-Letter, ROAR-Word, and ROAR-Sentence. Before any modeling, raw audio files were organized into training, validation, and testing splits. First, the recordings were resampled to a sampling rate of 16 kHz. To ensure no data leakage in our training protocol, all of a participant’s audio recordings (i.e Letter and Number) were placed within the same data split. To increase the number of and variation within the training set, we also applied data augmentation on the training data. For each training example, seven different augmentations were created. Augmentations randomly shifted the onset and offset of the audio samples within the 30 second recording window and then convolved the shifted recording with either Gaussian noise, various samples of background noise, or silence.
23.2 Automated Scoring Reliability
We assessed the reliability of our automated scoring system by comparing it to manual scoring in our sample. In the manual process, the duration of each task was measured by manually timing from the start of the first spoken word and the end of the last spoken word. During the manual scoring process, recordings were also labelled as reliable or unreliable. In the automated process, the duration was determined using start and end timestamps generated by our automatic speech recognition model, alongside reliability predictions.
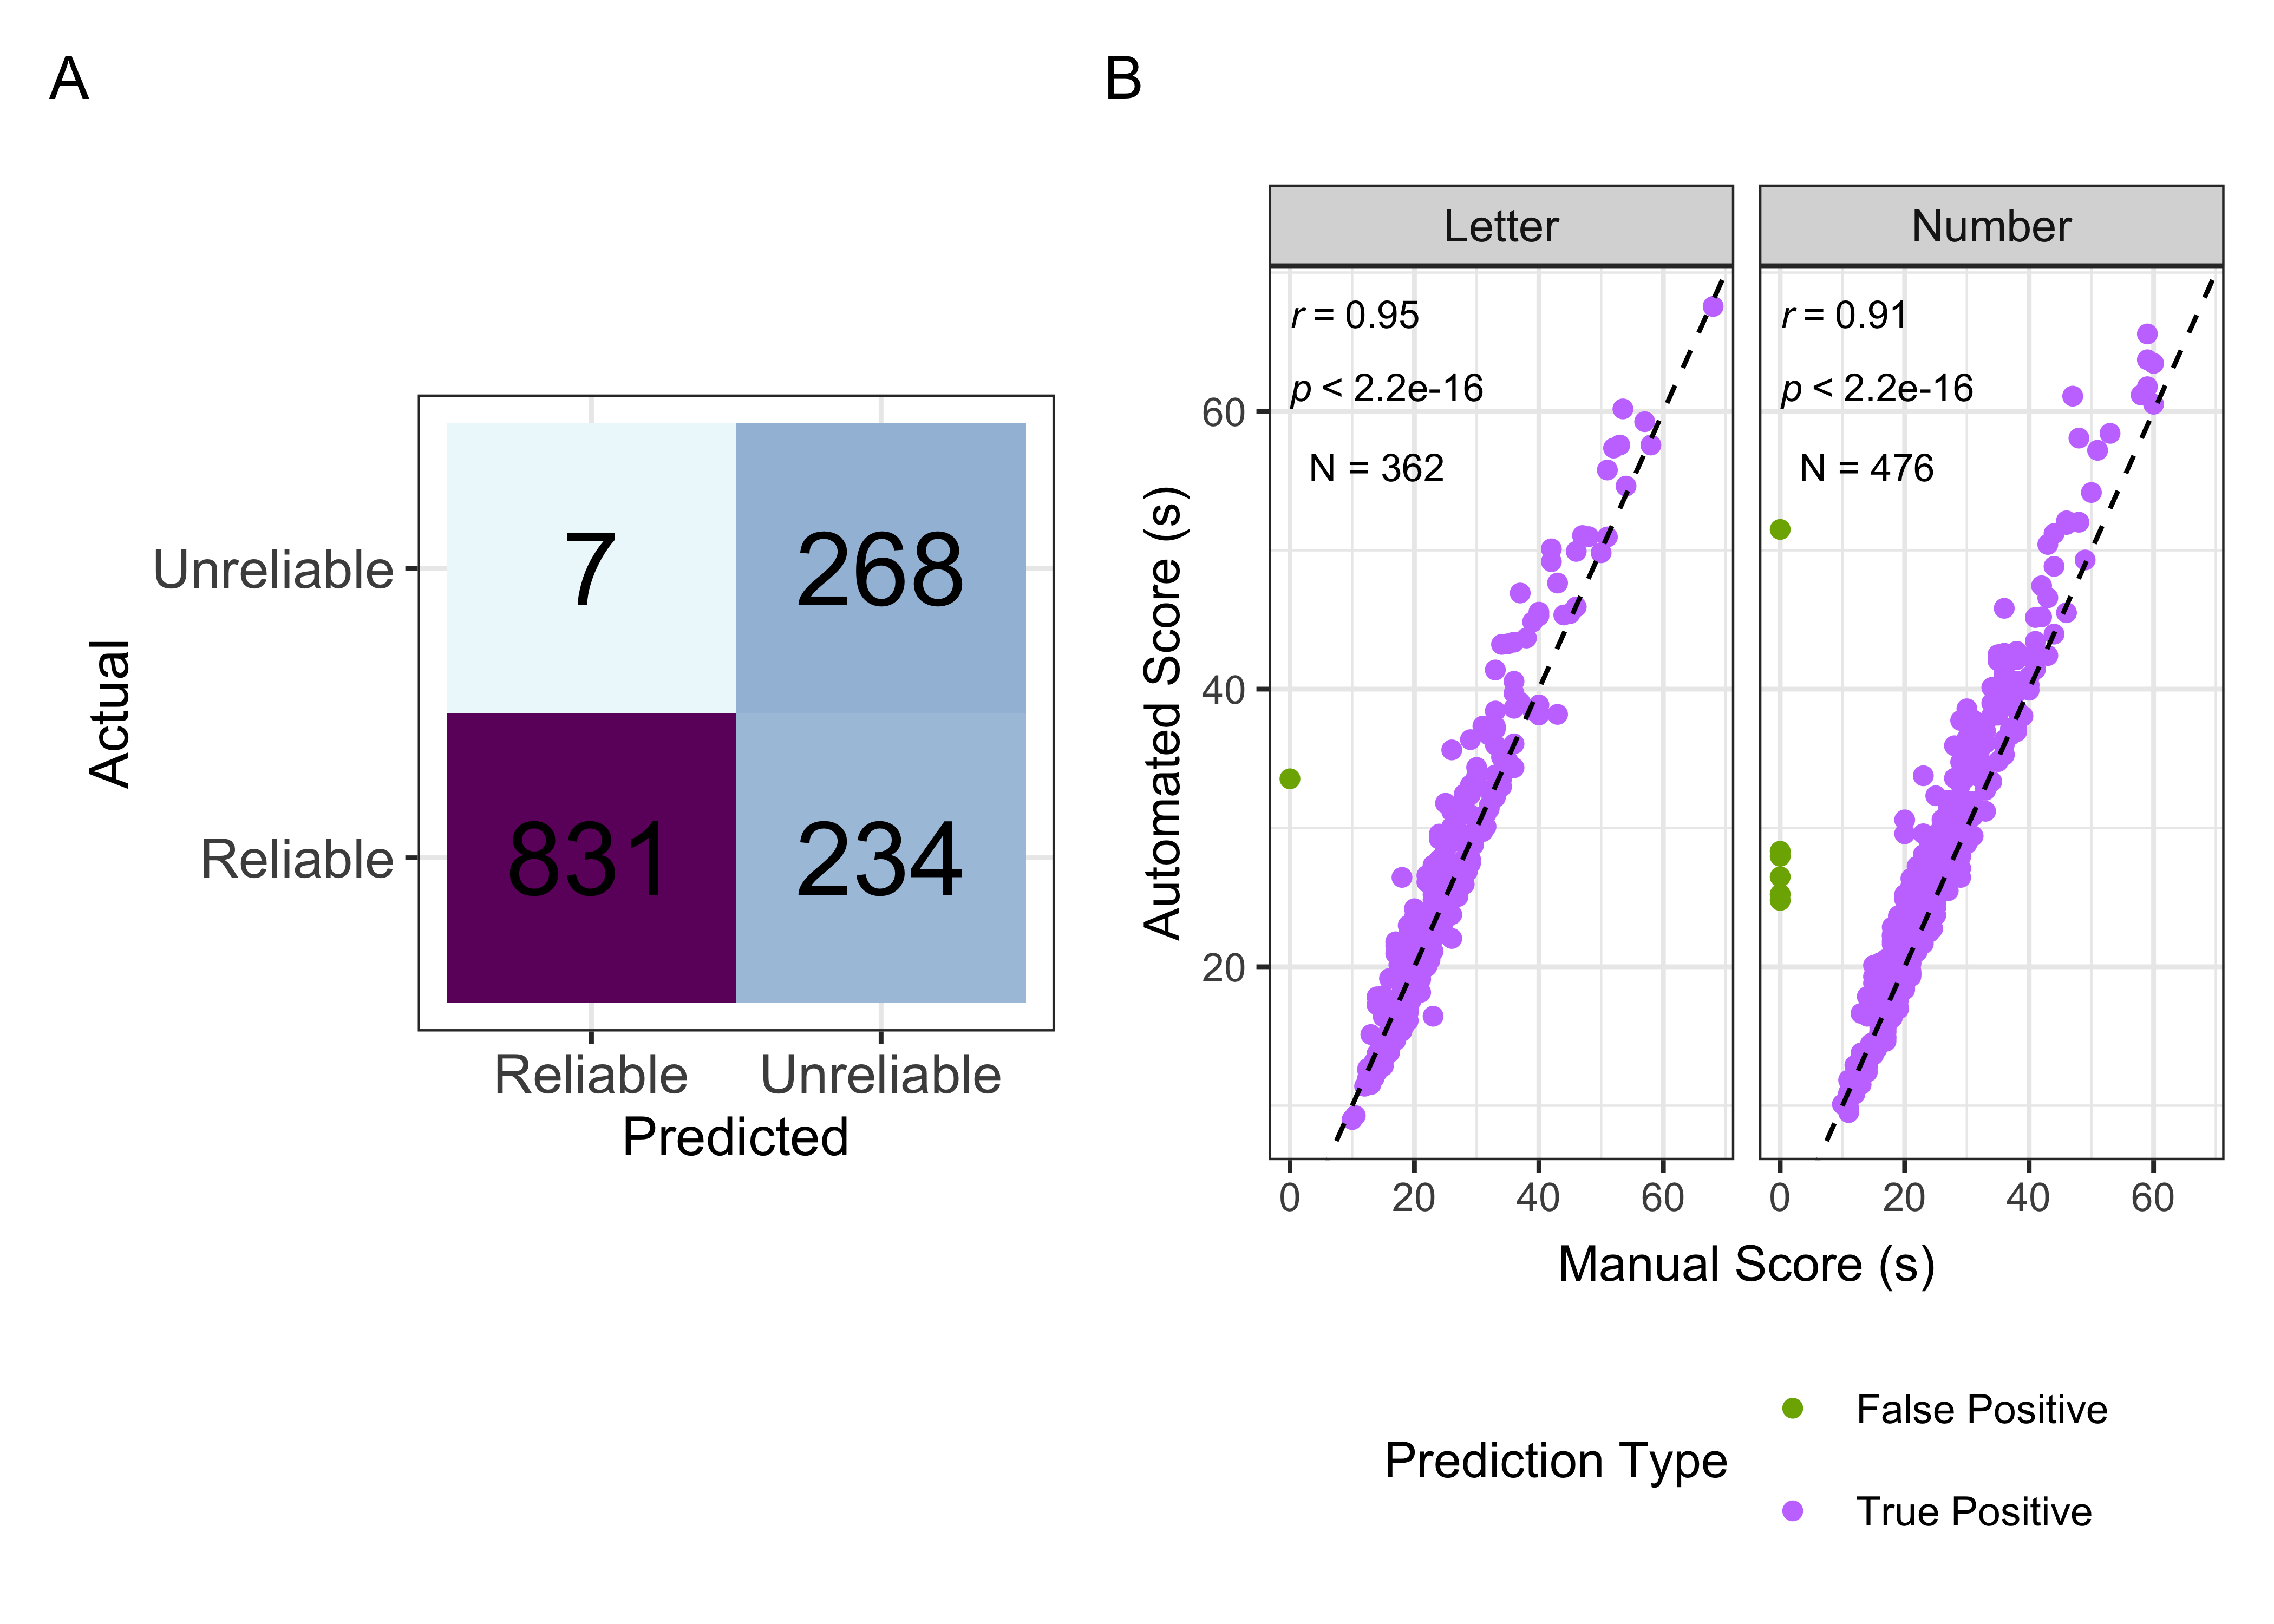
We observed a high degree of agreement between the automated and manually generated labels for audio recording reliability. In the held out test dataset, we observe an F1-score of 0.9022 and an accuracy of 0.863. It should be noted that, the test set accuracy is expected to be slightly lower because we have set up the reliability modeling to minimize false positives at the cost of an increased number of false negatives.
The correlation between manual and automated scoring was calculated for each RAN task, with each task achieving a Pearson correlation coefficient greater than 0.90 (see Figure 23.1). Furthermore, the interclass correlation coefficients between automated scoring and manual scoring were 362, 2, twoway, agreement, single, ICC(A,1), 0.9458951, 0, 37.54414, 361, 361, 4.9043596^{-182}, 0.95, 0.9317024, 0.9569196 and 476, 2, twoway, agreement, single, ICC(A,1), 0.8896618, 0, 20.2496079, 475, 475, 1.1928131^{-179}, 0.95, 0.8228907, 0.9260148 for RAN-Letter and RAN-Number, respectively. These strong correlations suggest that the automated scoring system reliably produces scores that are nearly identical to manual.
In addition to agreement between the autoscored and manually generated RAN scores, we leveraged the character level timestamps output by the speech recognition model to calculate split-half reliability. Using these timestamps, we estimated the time elapsed for the first half and second half of each recording and computed the correlation between these two splits. This revealed a low split-half reliability for RAN-Letter (Pearson’s r = 0.446915) but a relatively high split-half reliability for RAN-Number (Pearson’s r = 0.8639818). Manual inspection of the RAN-Letter recordings with the largest differences between splits revealed that many of these recordings included audio of an adult providing the student with verbal instructions on how to complete the task (RAN-Letter always proceeded RAN-Number in this sample). These verbal artifacts resulted in nearly half the charcters being transcribed in the initial 5 to 10 seconds) of many recordings, thereby skewing the timing of the two splits. Split-half reliability should be reassessed in a fresh sample where instructions have been made explicit before the beginning of the test portion of RAN-Letter.
23.3 Validity of ROAR-RAN
23.3.1 Construct Validity: Correlation Among ROAR-RAN Measures
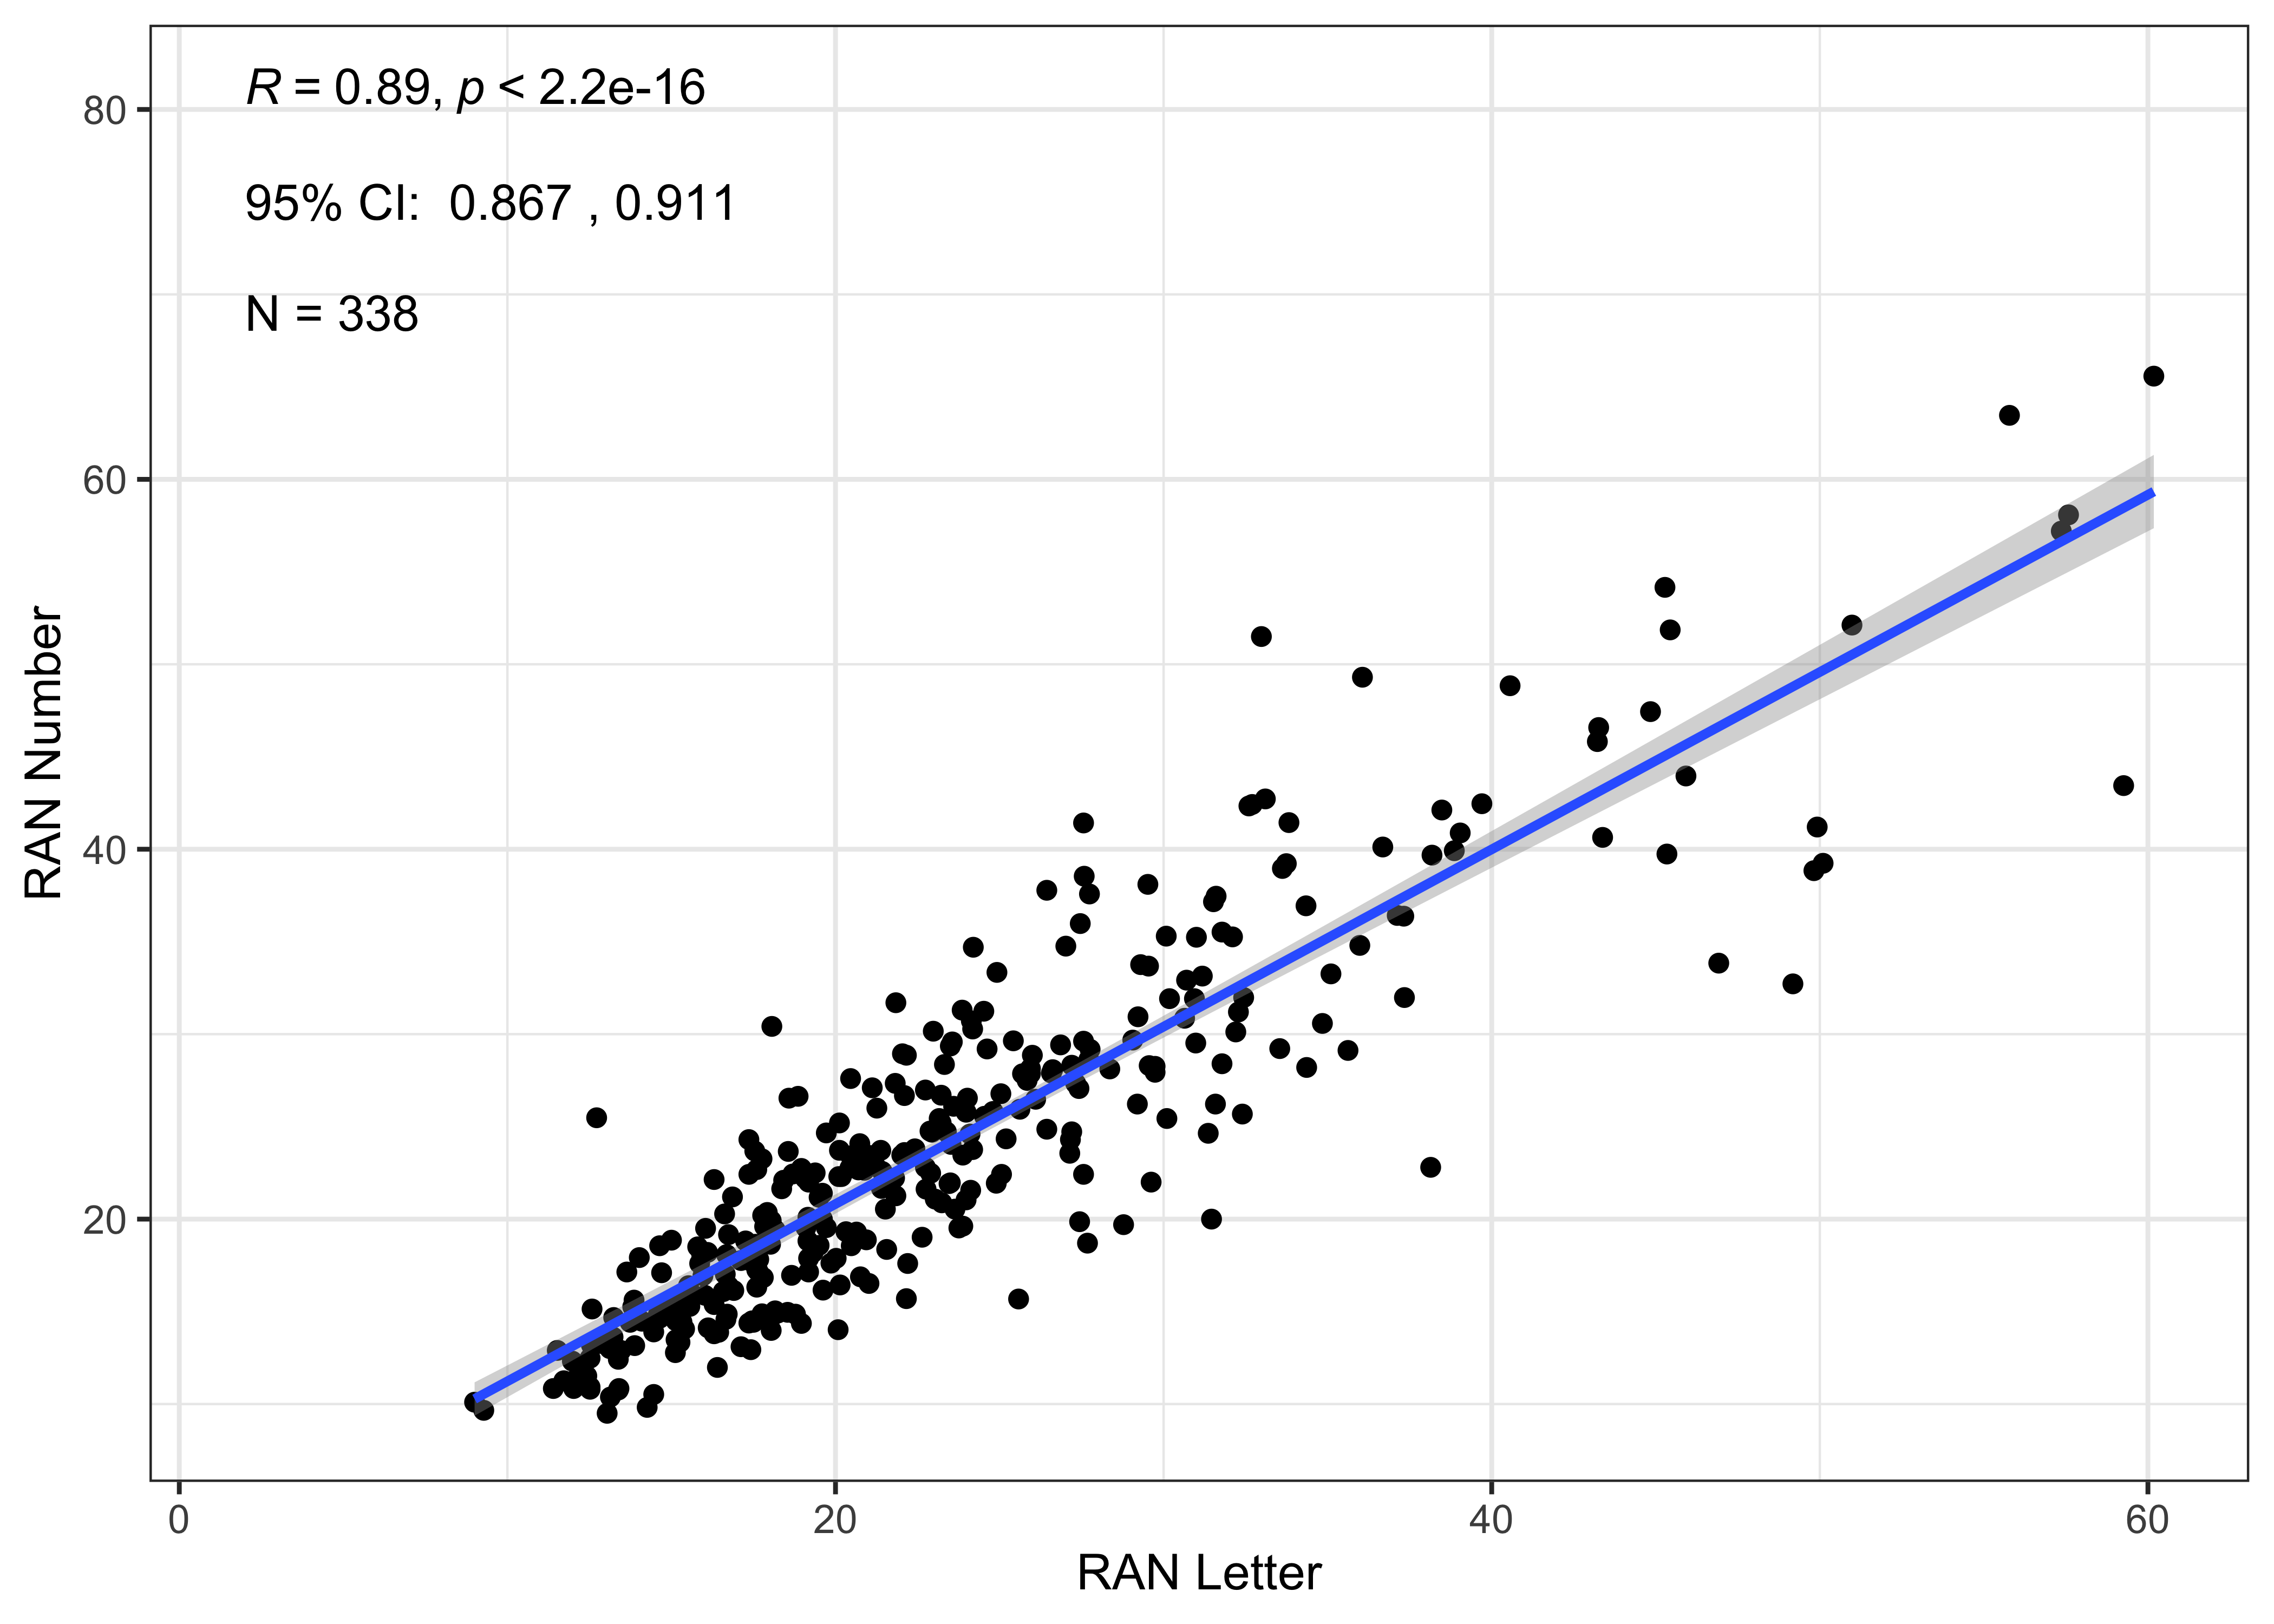
Next, we examined the correlation between the two RAN measures—RAN-Letters and RAN-Numbers—using the automated scores. This analysis aimed to confirm the construct validity of the ROAR-RAN tasks by evaluating the relationships among these measures. Both measures are designed to tap into the same latent construct and, thus, we expect the automated score for the two versions of RAN to be strongly correlated.
We observe a Pearson correlation of 0.8909807 between the automated scores for all 338 participants who completed both RAN-Letters and RAN-Numbers. Figure 23.2 shows these correlations providing evidence that both measures are reliably tapping in to a similar latent construct.
23.3.2 Concurrent Validity: Correlation Between ROAR-RAN and Core ROAR Measures
Research has shown that RAN assessments focused on automatic letter recognition better predict future reading skill compared to number or object based RAN assessments (McWeeny et al. 2022). Although the exact mechanisms behind this link between RAN and reading skill remain unclear, studies across multiple languages have suggested that several cognitive processes, including serial processing, access to phonological representations of letters, and articulation, relate to reading fluency (Georgiou et al. 2013; Georgiou and Parrila 2020). These results suggest that cognitive processes measured through RAN letter assessments are also critical processes involved in skilled reading. Interestingly, interindividual variability in RAN remains relatively stable between kindergarten and eighth grade (Mazzocco and Grimm 2013), suggesting that, although development of automatized naming slows over time, the measure serves a relatively stable predictor of reading skill.
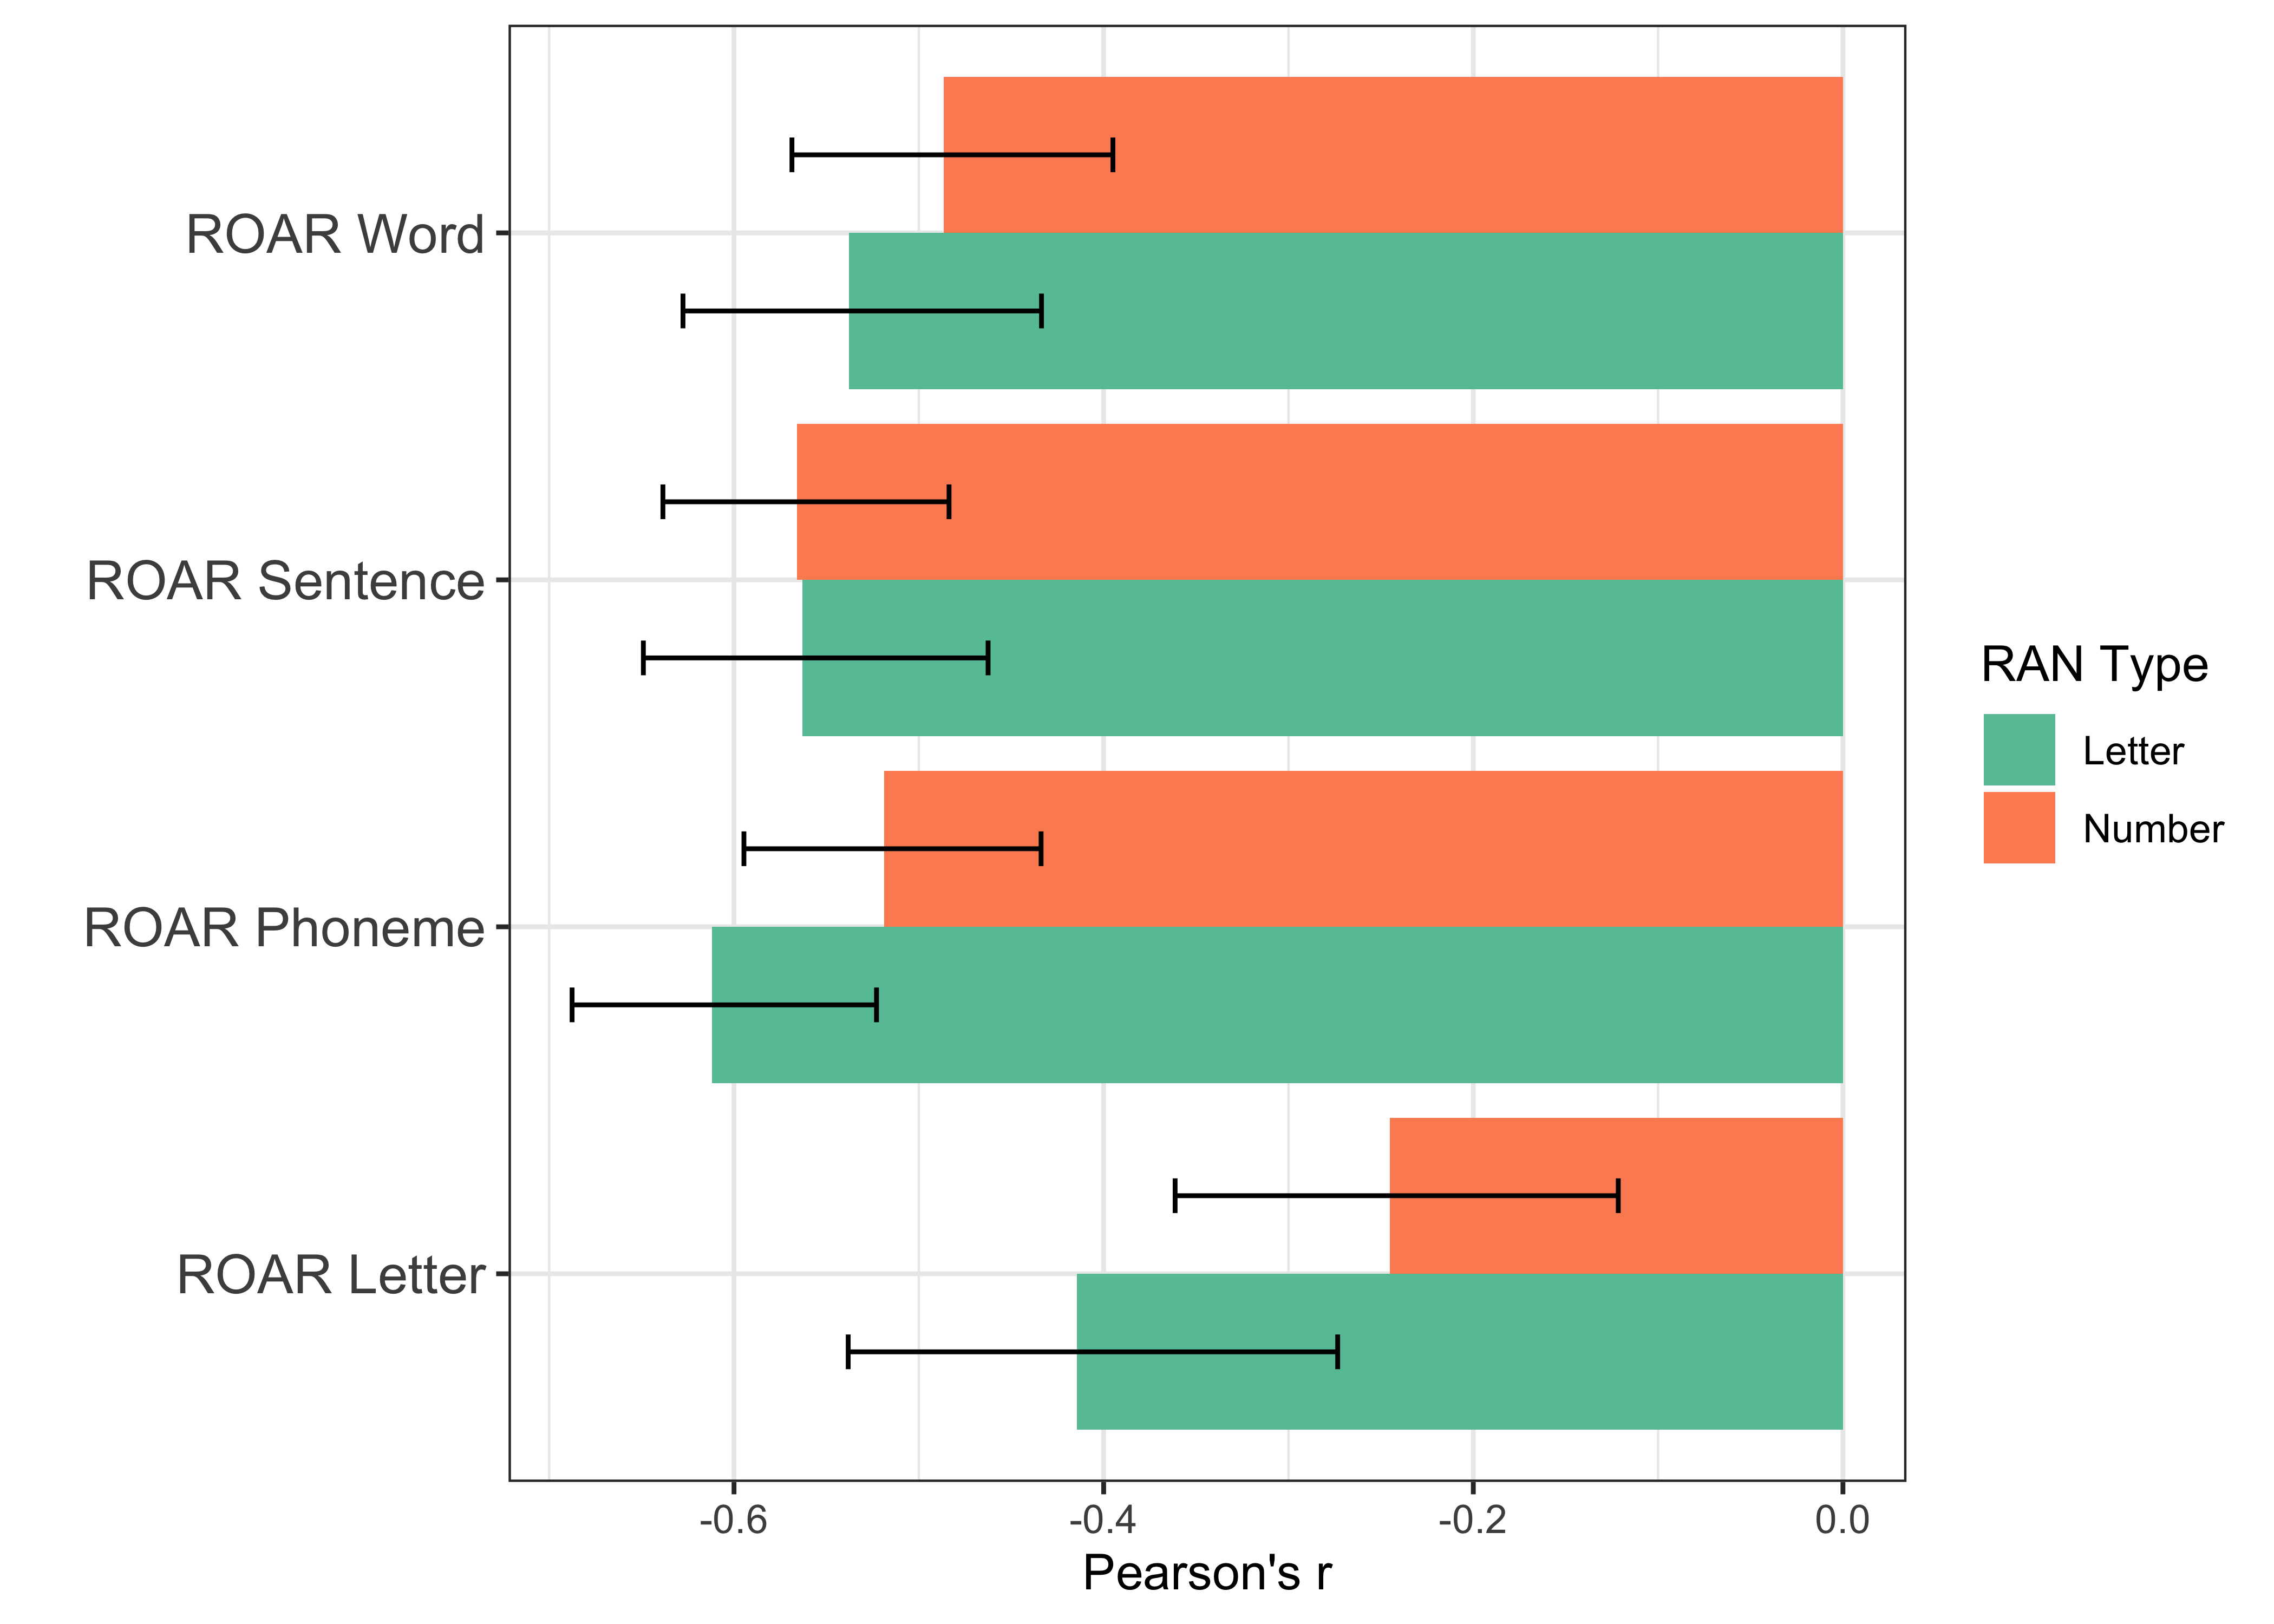
We then looked to replicate these past findings demonstrating a link between RAN and reading skill. To do so, we computed the correlation between the core ROAR assessments and RAN scores for both RAN-Letter and RAN-Number. For RAN-Letter, automated scores demonstrated significant correlations with ROAR-Phoneme, ROAR-Word, and ROAR-Sentence (all r < -0.53), but not ROAR-Letter (all r = -0.415; Table 23.1; Figure 23.3). These results are not altogether unsurprising, as ROAR-Letter demonstrates strong ceiling effect. Because the average age of the present sample is greater than 8 years old, the lack of correlation likely stems from restricted variance in Letter scores.
Furthermore, the correlations between RAN-Number and the other ROAR measures were generally weaker compared to those with RAN-Letter, which is in line with past research suggesting that RAN assessments focused on letters better predict reading skill (McWeeny et al. 2022). Although the correlations between manual RAN scores and ROAR measures were stronger, automated RAN scores demonstrated moderate correlations with other ROAR measures, again suggesting that our autoscoring pipeline is able to capture the same RAN-reading relationship as manual scores, albeit with slightly more susceptibility to measurement errors.
| ROAR Measure | Letter | Number |
|---|---|---|
| Phoneme | -0.612 (-0.688, -0.523) | -0.519 (-0.595, -0.434) |
| Word | -0.538 (-0.628, -0.434) | -0.487 (-0.569, -0.395) |
| Letter | -0.415 (-0.538, -0.273) | -0.245 (-0.361, -0.122) |
| Sentence | -0.563 (-0.649, -0.463) | -0.566 (-0.638, -0.484) |
References
Georgiou, George K, and Rauno Parrila. 2020. “What Mechanism Underlies the Rapid Automatized Naming–Reading Relation?” Journal of Experimental Child Psychology 194: 104840.
Georgiou, George K, Rauno Parrila, Ying Cui, and Timothy C Papadopoulos. 2013. “Why Is Rapid Automatized Naming Related to Reading?” Journal of Experimental Child Psychology 115 (1): 218–25.
Mazzocco, Michèle MM, and Kevin J Grimm. 2013. “Growth in Rapid Automatized Naming from Grades k to 8 in Children with Math or Reading Disabilities.” Journal of Learning Disabilities 46 (6): 517–33.
McWeeny, Sean, Soujin Choi, June Choe, Alexander LaTourrette, Megan Y Roberts, and Elizabeth S Norton. 2022. “Rapid Automatized Naming (RAN) as a Kindergarten Predictor of Future Reading in English: A Systematic Review and Meta-Analysis.” Reading Research Quarterly 57 (4): 1187–1211.